CRM Dashboard With Industry Operations Data Statistics
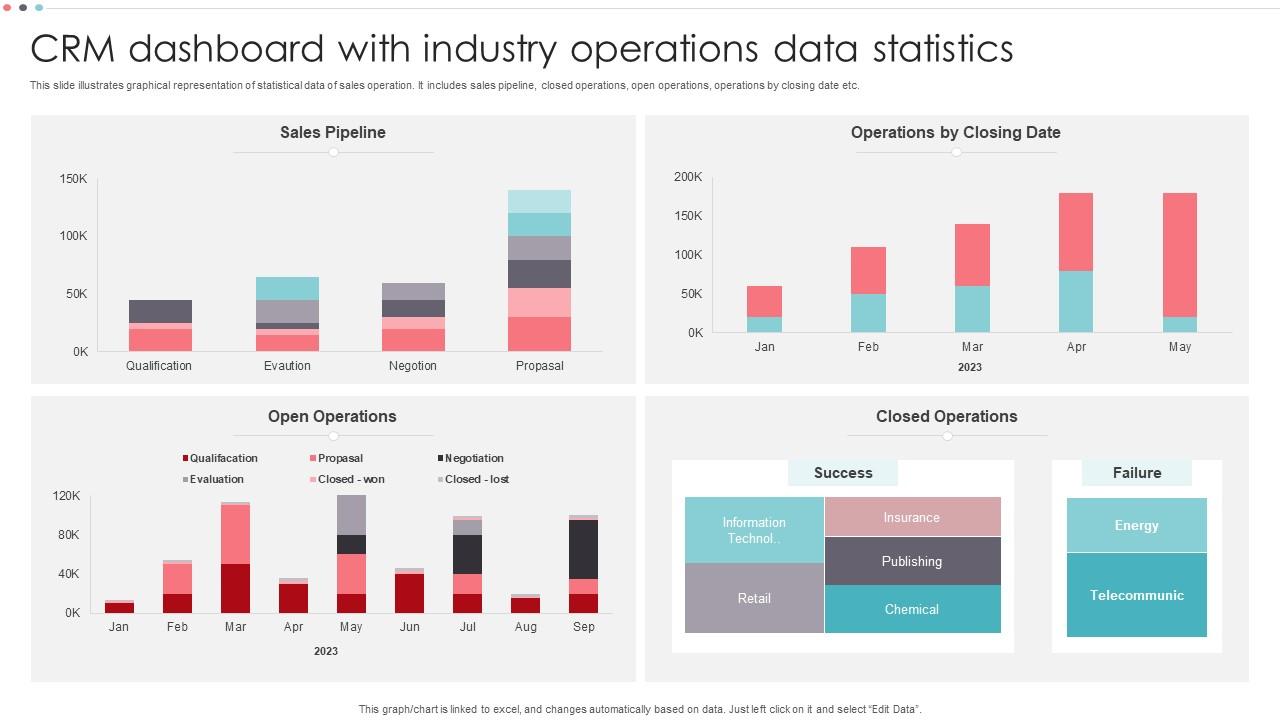
This slide illustrates graphical representation of statistical data of sales operation. It includes sales pipeline, closed operations, open operations, operations by closing date etc.
This slide illustrates graphical representation of statistical data of sales operation. It includes sales pipeline, closed ..
- Google Slides is a new FREE Presentation software from Google.
- All our content is 100% compatible with Google Slides.
- Just download our designs, and upload them to Google Slides and they will work automatically.
- Amaze your audience with SlideTeam and Google Slides.
-
Want Changes to This PPT Slide? Check out our Presentation Design Services
- WideScreen Aspect ratio is becoming a very popular format. When you download this product, the downloaded ZIP will contain this product in both standard and widescreen format.
-

- Some older products that we have may only be in standard format, but they can easily be converted to widescreen.
- To do this, please open the SlideTeam product in Powerpoint, and go to
- Design ( On the top bar) -> Page Setup -> and select "On-screen Show (16:9)” in the drop down for "Slides Sized for".
- The slide or theme will change to widescreen, and all graphics will adjust automatically. You can similarly convert our content to any other desired screen aspect ratio.
Compatible With Google Slides

Get This In WideScreen
You must be logged in to download this presentation.
PowerPoint presentation slides
This slide illustrates graphical representation of statistical data of sales operation. It includes sales pipeline, closed operations, open operations, operations by closing date etc. Presenting our well structured CRM Dashboard With Industry Operations Data Statistics. The topics discussed in this slide are Sales Pipeline, Operations Closing Date. This is an instantly available PowerPoint presentation that can be edited conveniently. Download it right away and captivate your audience.
People who downloaded this PowerPoint presentation also viewed the following :
CRM Dashboard With Industry Operations Data Statistics with all 7 slides:
Use our CRM Dashboard With Industry Operations Data Statistics to effectively help you save your valuable time. They are readymade to fit into any presentation structure.
-
I'm happy to discover your PowerPoint presentations and templates. They met my expectations precisely. Very innovative!
-
Fantastic and innovative graphics with useful content. The templates are the best and latest in the industry.


