Dashboard For Measuring Customer Satisfaction Efficient Management Retail Store Operations
Try Before you Buy Download Free Sample Product
Audience
Editable
of Time
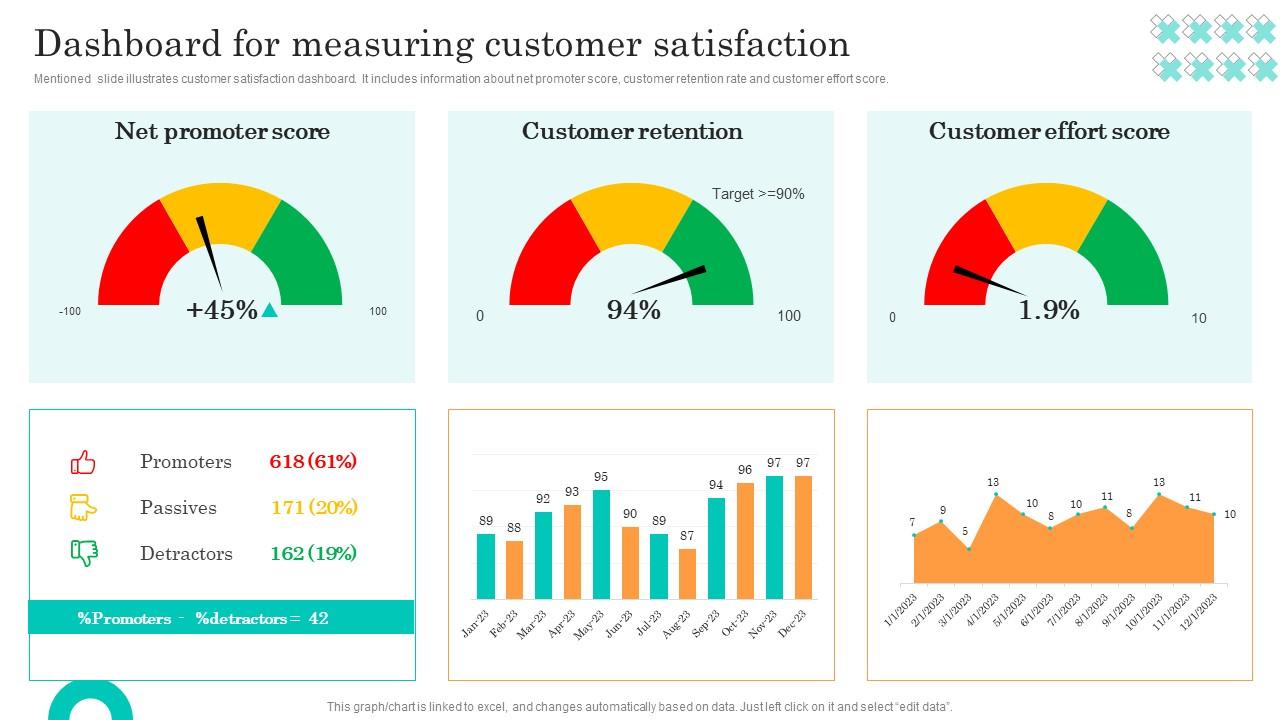
Mentioned slide illustrates customer satisfaction dashboard. It includes information about net promoter score, customer retention rate and customer effort score.
People who downloaded this PowerPoint presentation also viewed the following :
Dashboard For Measuring Customer Satisfaction Efficient Management Retail Store Operations with all 7 slides:
Use our Dashboard For Measuring Customer Satisfaction Efficient Management Retail Store Operations to effectively help you save your valuable time. They are readymade to fit into any presentation structure.
FAQs for Dashboard For Measuring Customer Satisfaction Efficient Management
Customer Satisfaction (CSAT) dashboards should include Net Promoter Score (NPS), Customer Effort Score (CES), churn rate, customer lifetime value (CLTV), and support ticket resolution time. These technologies streamline insights by tracking loyalty, ease of service, retention, profitability, and responsiveness, with many financial services institutions finding that proactive monitoring enhances customer experiences. Ultimately delivering improved retention and increased revenue streams through targeted interventions.
Businesses can effectively visualize customer feedback data through dashboards incorporating sentiment analysis, trend charts, and key metric displays—like Net Promoter Score (NPS) and Customer Satisfaction (CSAT). These technologies streamline data interpretation by highlighting recurring themes, identifying pain points, and tracking changes over time, with many retail and financial services institutions finding that proactive insights enhance customer experiences. Ultimately delivering improved loyalty and targeted service enhancements, these dashboards enable data-driven decisions for sustained competitive advantage.
Surveys and feedback forms are crucial for a customer satisfaction dashboard, providing quantifiable data on experiences, preferences, and pain points through ratings, reviews, and open-ended responses. These technologies streamline data collection by automating distribution, analysis, and reporting, with many banks and retailers finding that consistent feedback loops enhance customer experiences. Ultimately delivering actionable insights and enabling proactive improvements to services, ultimately boosting loyalty and competitive advantage.
Real-time data integration improves customer satisfaction dashboard effectiveness by streamlining data collection, enhancing analytical accuracy, and accelerating response times. These technologies facilitate instant insights from sources like CRM systems, social media, and surveys, enabling organizations to proactively address concerns and personalize customer experiences. Ultimately delivering improved loyalty and a competitive advantage, with many financial services institutions finding that rapid issue resolution significantly boosts customer retention.
Customer satisfaction dashboards often stumble with data overload, focusing on vanity metrics, and lacking clear actionability, ultimately hindering impactful improvements. While comprehensive data collection seems beneficial, it also creates analysis paralysis; therefore, prioritize key performance indicators like Net Promoter Score, Customer Effort Score, and churn rate. With many organizations finding that streamlined views, coupled with defined thresholds for intervention, enhance responsiveness and ultimately deliver improved customer experiences and increased operational efficiency.
Customer satisfaction dashboards can be tailored by incorporating industry-specific KPIs like Net Promoter Score for retail, HCAHPS scores for hospitals, or CSAT for financial services, while also tracking channel-specific feedback. These technologies streamline data collection via surveys, social listening, and transactional feedback, ultimately delivering actionable insights and enhanced customer experiences. With many organizations finding that focused metrics drive targeted improvements, dashboards enable proactive issue resolution and competitive advantage in an increasingly customer-centric landscape.
Customer satisfaction dashboards leverage tools like Qualtrics, Medallia, and SurveyMonkey, alongside data visualization software such as Tableau and Power BI, enabling comprehensive metric tracking. These technologies streamline data collection by integrating surveys, social media listening, and CRM data, ultimately delivering actionable insights and enhanced customer experiences, with many organizations finding that integrated platforms boost response rates.
Sentiment analysis enhances customer satisfaction dashboards by automatically gauging emotional tone from feedback data, including surveys, reviews, and social media comments. While dashboards traditionally track scores, sentiment analysis reveals *why* customers feel a certain way, enabling organizations to proactively address pain points and capitalize on positive experiences. With many financial services and retail institutions finding that nuanced feedback drives targeted improvements, ultimately delivering enhanced customer experiences and increased loyalty.
Net Promoter Score (NPS) on a customer satisfaction dashboard signifies customer loyalty, predicts business growth, and identifies areas for service enhancement through direct feedback. While valuable, it also requires contextual analysis alongside other metrics like Customer Satisfaction (CSAT) and Customer Effort Score (CES), with many organizations finding that a strategic combination delivers actionable insights. Ultimately, consistently monitoring NPS enables proactive improvements to customer experiences and fosters sustainable competitive advantage across industries like banking and retail.
Customer satisfaction dashboards aid in identifying trends over time by visually tracking key metrics like Net Promoter Score, customer churn, and support ticket resolution times. These technologies streamline analysis by aggregating data from various touchpoints—surveys, social media, and CRM systems—ultimately delivering actionable insights and enabling proactive adjustments to customer experiences. With many organizations finding that consistent monitoring reveals emerging issues and opportunities for improvement, dashboards enhance strategic decision-making and foster lasting customer loyalty.
Customer satisfaction dashboard insights are best shared through scheduled reports, interactive online portals, and dedicated cross-departmental meetings, ensuring transparency and alignment. These practices streamline communication by fostering collaboration between sales, marketing, and support teams, ultimately delivering improved customer experiences and enhanced operational efficiency with many organizations finding that proactive insight-sharing minimizes silos and accelerates response times.
Data-driven decisions from a customer satisfaction dashboard improve retention by identifying pain points, personalizing interactions, and proactively addressing concerns—all crucial elements. These dashboards enable organizations to streamline support, enhance product development, and optimize customer experiences, with many financial services institutions finding a 15-20% increase in loyalty.
Customer satisfaction dashboards remain user-friendly and intuitive by prioritizing clear visualizations, customizable metrics—like Net Promoter Score and Customer Effort Score—and role-based access. These technologies streamline data interpretation by enabling drill-down capabilities, automated reporting, and real-time updates, with many financial services and retail organizations finding that simplified interfaces enhance adoption. Ultimately delivering actionable insights and improved customer experiences, ensuring continuous improvement initiatives are data-driven and effective.
Customer satisfaction benchmarks include Net Promoter Score (NPS), Customer Satisfaction Score (CSAT), Customer Effort Score (CES), and churn rate, alongside social media sentiment. These metrics help organizations gauge loyalty by measuring advocacy, contentment, ease of service, and retention, with many financial services institutions finding that consistent monitoring enhances customer lifetime value. Ultimately delivering improved customer experiences and a competitive advantage in an increasingly customer-centric landscape.
Customer satisfaction dashboards facilitate proactive service improvements by centralizing key metrics like Net Promoter Score, customer effort scores, and churn rates, enabling rapid identification of pain points. While providing valuable insights, it also requires consistent data analysis and action planning; with many organizations finding that real-time monitoring streamlines issue resolution, enhances customer experiences, and ultimately delivers increased loyalty and reduced operational costs.
-
Innovative and Colorful designs.
-
Great work on designing the presentation. I just loved it!