- Sub Categories
-
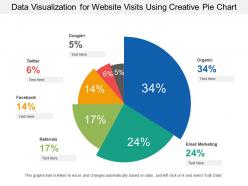 Data visualization for website visits using creative pie chart
Presenting this set of slides with name - Data Visualization For Website Visits Using Creative Pie Chart. This is a six stage process. The stages in this process are Data Visualization, Data Management, Data Representation.
-
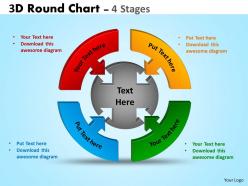 3d round chart 4 stages diagram ppt templates 4
Introducing 3D round chart 4 stages diagram PowerPoint slide. High in demand due to their easy use and accessibility. High quality professional visual slide. Has the propensity to increase the overall look and feel of your presentation. Trustworthy and accurate PowerPoint slide show. Enough space to add your information alongside the image. Option to include business content i.e. name, logo and text. Effortless conversion into PDF/ JPG format. Beneficial for entrepreneurs, aspiring business owners, supply managers, retailers, financiers, professors, students.
-
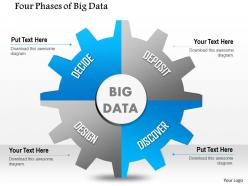 1114 four phases of big data showing in gear wheel ppt slide
We are proud to present our 1114 four phases of big data showing in gear wheel ppt slide. This Power Point slide has been designed with graphic of gear. This big gear contained the big data details. Use this PPT slide and build presentation for data computing.
-
 Process improvement journey
Presenting Process Improvement Journey PPT theme which is completely editable. It is readily available in both 4:3 and 16:9 aspect ratio. This template is compatible with Google Slides which makes it easily accessible at once. You can open and save your presentation in various formats like PDF, JPG and PNG. Change the colors, fonts, font size, and font types as per your requirement.
-
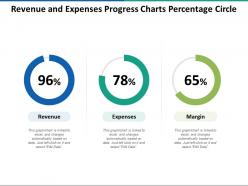 Revenue and expenses progress charts percentage circle
Presenting this set of slides with name - Revenue And Expenses Progress Charts Percentage Circle. This is a three stage process. The stages in this process are Percentage Circle, Percentage Round, Pie Chart.
-
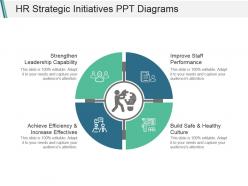 Hr strategic initiatives ppt diagrams
Introducing Hr Strategic Initiatives PowerPoint template diagram with four stages. Effortlessly changeable PowerPoint template as shading, content and textual style is alterable. This PowerPoint template is hundred percent compatible with Google Slides. You can easily download the template and save into JPEG and PDF format. The designer has used the best quality images, graphics, color, and icons. Easy to incorporate the company signature and logo. Picture quality does not get blur when displayed on widescreen.
-
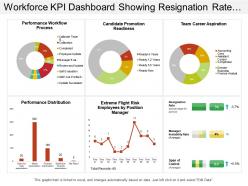 Workforce kpi dashboard showing resignation rate manager instability rate and performance workflow process
Presenting this set of slides with name - Workforce Kpi Dashboard Showing Resignation Rate Manager Instability Rate And Performance Workflow Process. This is a six stage process. The stages in this process are Staff, Personnel, Workforce.
-
 3d puzzle process diagram 4 stages powerpoint slides and ppt templates 0412
• Compatible with Google slides. • Compatible with numerous other format and software. • Easy to edit and incorporate changes. • Availability of guidance to edit the slide diagram. • Wide screen projection does not deter the visual quality. • Easy to customize and personalize the slides with company name or logo. • The abstract visual of slide makes it usage and application wide. • Widely used by marketers, business analysts, students and teachers.
-
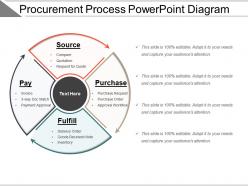 Procurement process powerpoint diagram
Presenting procurement process powerpoint diagram. This is a procurement process powerpoint diagram. This is a four stage process. The stages in this process are procurement, purchasing, ?bidding.
-
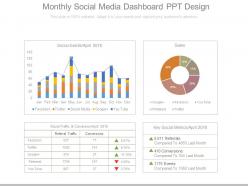 Monthly social media dashboard snapshot ppt design
Presenting monthly social media dashboard snapshot ppt design. This is a monthly social media dashboard ppt design. This is a four stage process. The stages in this process are social events, sales, social traffic and conversion, key social metrics, referrals, conversions, events.
-
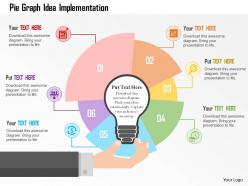 Pie graph idea implementation flat powerpoint design
SlideTeam proudly presents to you its pie graph idea implementation flat PowerPoint design. As this presentation slideshow is fully editable you can modify the font size, font style and even the font color of the text used as per your requirements. You can view the template in either standard size display ratio of 4:3 or widescreen display ratio of 16:9. The PPT slideshow can be saved in format of PDF or JPG. This deck of slides is also compatible with Google slides.
-
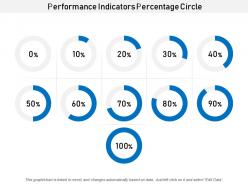 Performance indicators percentage circle
Presenting this set of slides with name - Performance Indicators Percentage Circle. This is a eleven stage process. The stages in this process are Percentage Circle, Percentage Round, Pie Chart.
-
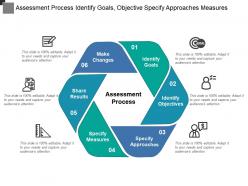 Assessment process identify goals objective specify approaches measures
Presenting this set of slides with name - Assessment Process Identify Goals Objective Specify Approaches Measures. This is a six stage process. The stages in this process are Assessment Process, Assessment Cycle, Assessment Management.
-
 1214 five paper infographics for data flow powerpoint template
We are proud to present our 1214 five paper infographics for data flow powerpoint template. Five staged info graphics has been used to craft this power point template. This PPT contains the concept of data flow. Display data related technology in any presentations with this unique PPT.
-
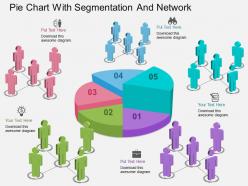 Bn pie chart with segmentation and network powerpoint template
We are proud to present our bn pie chart with segmentation and network powerpoint template. Graphic of pie chart with segmentation and network has been used to design this power point template diagram. This PPT diagram contains the concept of result analysis and networking .Use this PPT diagram for business and marketing related presentations.
-
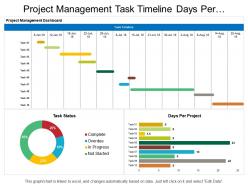 Project management task timeline days per project dashboard
Introducing project management task timeline days per project dashboard PPT template. Access to convert the presentation design into JPG and PDF. Offer 100% access to change the values, size and style of the slides once downloaded and saved in the desired format. High quality charts, images and visuals used in the designing process. Choice to get presentation slide in standard or in widescreen view. Easy to convert in JPEG and PDF document. Compatible with Google slides. Easy and hassle-free downloading process.
-
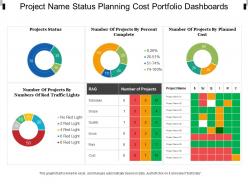 Project name status planning cost portfolio dashboards
Introducing project name status planning cost portfolio dashboards PPT template. Presentable and easy to comprehend visual graphic. The presentation template can be downloaded and saved in any desired format. Valuable for the business presenters and entrepreneurs as they can showcase their business success in a creative way. Privilege of insertion of logo and trademarks for more personalization. Adaptable to wide screen view without the problem of pixilation. Can be used with Google slides. Beneficial for industry professionals, managers, executives, researchers, sales people, etc.
-
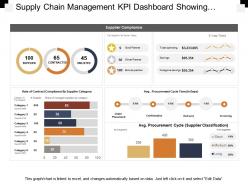 Supply chain management kpi dashboard showing supplier compliance stats
Presenting this set of slides with name - Supply Chain Management Kpi Dashboard Showing Supplier Compliance Stats. This is a four stage process. The stages in this process are Demand Forecasting, Predicting Future Demand, Supply Chain Management.
-
 Five staged pentagon design with icons flat powerpoint design
Re workable Presentation designs, verse, themes, figures etc. Reasonable for business experts, marketing managers etc., Immense Quality Presentation graphics adaptable with all Google slides and operating systems, Ample scope to insert titles or subtitles in PPT images, Cognizant and easy downloadable PowerPoint designs which saves time, compatible with other file formats also like PDF or JPG.
-
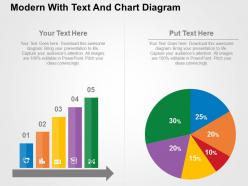 Modern with text and chart diagram flat powerpoint design
PowerPoint slides effortlessly coordinate with Google slides. Vertical bars and pie chart can have customised colors according to liking. High resolution PPT graphics leave no scope for pixilation on bigger and wider screens. Useful for data analysts, students and consumer-based companies. Amendable PPT layouts gives pin point control to the user. Supporting variety of software's, presentation design can be transformed into JPG and PDF easily.
-
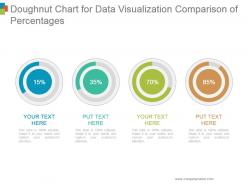 Doughnut chart for data visualization comparison of percentages powerpoint slides design
Presenting doughnut chart for data visualization comparison of percentages powerpoint slides design. This is a doughnut chart for data visualization comparison of percentages powerpoint slides design. This is a four stage process. The stages in this process are business, marketing, financial, percentage, increase.
-
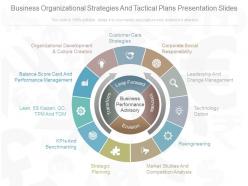 A business organizational strategies and tactical plans presentation slides
Flexibility to execute the adjustments in shading, textual style, content and more according to one's close to home decision. Simplicity of personalization with your organization name and logo. Run well with wide assortment of company alternatives. Congruous with set of programming alternatives, accessible both on the web and disconnected. The stages in this process are customer care strategies, corporate social responsibility, leadership and change management and much more.
-
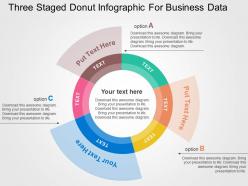 Three staged donut infographic for business data flat powerpoint design
Fine Picture quality used in the designing. Perfectly blend with other software programs such as JPG and PDF. Easy access to modify the PPT visual as color, text and layout amendable. Stress free consideration of organization's customized content. High determination slide demonstrate. Presentation image can be demonstrated in both standard and widescreen view. Appropriate for business data analyst team, corporate presentation experts, finance and accounts managers as well as executives.
-
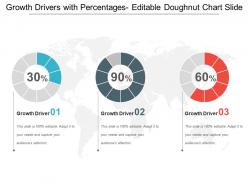 Growth drivers with percentages editable doughnut chart slide
Presenting a PPT template named Growth drivers with percentages editable doughnut chart slide. This template is professionally designed and is completely editable. The Font color, Font size, Font style, background color and color of the diagram can be altered as per your suitability. The text in the template can be rewritten and replaced with your desired content. The slide is totally compatible with Google slides and can be easily saved in JPG or PDF format. You can customize the template conveniently by changing the data in excel sheet, as this template is Excel-linked. Editable icons make the presentation more presentable. Download it now to make a hassle free presentation.
-
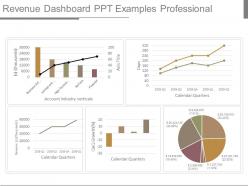 Revenue dashboard snapshot ppt examples professional
Presenting revenue dashboard ppt examples professional. This is a revenue dashboard snapshot ppt examples professional. This is a five stage process. The stages in this process are account industry verticals, calendar quarters, growth, marketing, finance.
-
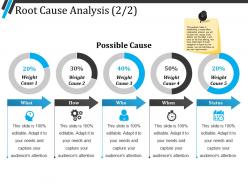 Root cause analysis ppt summary
Presenting Root Cause Analysis PPT Summary which is designed professionally for your convenience. You can change the color, fonts, font size, and font types of the template as per the requirements. The slide is readily available in both 4:3 and 16:9 aspect ratio. It is adaptable with Google Slides which makes it accessible at once. Can be converted into formats like PDF, JPG, and PNG.
-
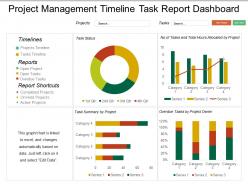 Project management timeline task report dashboard snapshot
Introducing project management timeline task report dashboard snapshot PPT template. An easy access to make the desired changes or edit it anyways. Wide screen view of the slides. Easy conversion into Jpeg or Pdf format. The PPT images offer compatibility with Google Slides. High resolution icons for clear message delivery. Unique and informational content. Valuable for business professionals, sales representatives, marketing professionals, students and selling investigators. High quality charts and visuals used in the designing process. They enhance the performance of the presentation.
-
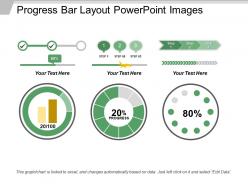 Progress bar layout powerpoint images
You can download this PPT completely free of cost. You just have to edit the data in a pre-designed format and present it. You can insert fonts and icons to this ready-made slide. All these slides are fully compatible with Google Slides. This presentation can be downloaded in JPG and PDF formats. It can be viewed in the 16:9 ratio widescreen size and the ratio of 4:3 standard screen size.
-
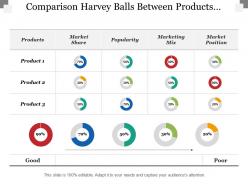 Comparison harvey balls between products market share popularity
Presenting this set of slides with name - Comparison Harvey Balls Between Products Market Share Popularity. This is a four stage process. The stages in this process are Differentiation, Comparison, Compare.
-
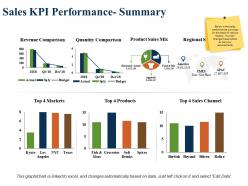 Sales kpi performance summary revenue comparison product sales mix
Presenting this set of slides with name - Sales Kpi Performance Summary Revenue Comparison Product Sales Mix. This is a three stage process. The stages in this process are Revenue Comparison, Quantity Comparison, Product Sales Mix, Regional Sales Mix, Top Sales Channel.
-
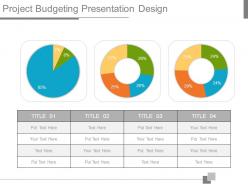 Project budgeting presentation design
Presenting project budgeting presentation design. This is a project budgeting presentation design. This is a three stage process. The stages in this process are project, budgeting, finance, strategy, marketing, management.
-
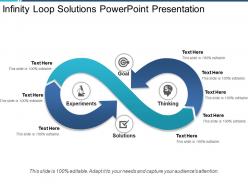 Infinity loop solutions powerpoint presentation
Presenting to you PPT template on Infinity Loop Solutions Powerpoint Presentation.Customization of the design with business name, image and tagline is very simple and easy. Presentation layout comes in both standard and widescreen slide The slides are of high quality. Colors, text and font can be easily changed as the PowerPoint diagram is completely editable. It is compatible with Google Slides and other softwares too.The slides are easily downloadable and can be saved in JPG or PDF format.
-
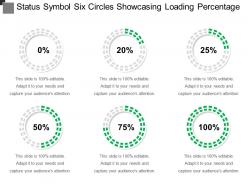 Status symbol six circles showcasing loading percentage
Presenting status symbol six circles showcasing loading percentage. This is a status symbol six circles showcasing loading percentage. This is a six stage process. The stages in this process are status symbol, status icon.
-
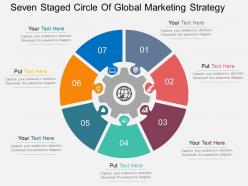 Qg seven staged circle of global marketing strategy flat powerpoint design
Pre-designed Presentation templates. Enough space available to enter text and its related points in the PPT slide. Completely editable content. Pictures do not pixelate when projected on Widescreen. Easy to insert company logo, trademark or name. This PPT Slide is available in both Standard and Widescreen slide size. Easy and quick downloading process. Compatible with multiple formats like JPEG, PDF and Google slides.
-
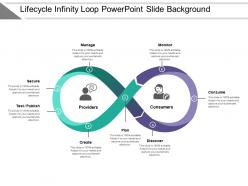 Lifecycle infinity loop powerpoint slide background
Presenting lifecycle infinity loop PowerPoint slide background PPT slide. After downloading this infinite loop slide, save it into JPG & PDF format. A user can also display this infographic template in the standard or widescreen view. You can also do changes in the slide including color, text, font type, font size, aspect ratio, etc. The template is 100% compatible with Google Slides and editable in PowerPoint as well. A presenter can share the slide with large segment due to its amazing pixel quality. You can also insert the related text in text placeholder of the template.
-
 Ten staged business icons pie graph powerpoint template
They provide the convenience to manually organize the icons and edit the information. Merging this PPT design with the presentation is effortless and does not require much time. It has a hassle free downloading. Enhance the impact of your presentation. Runs effortlessly with all software’s. Can be presented on both standard and widescreen formats.
-
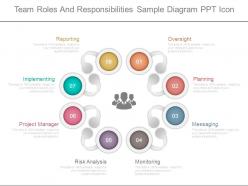 Team roles and responsibilities sample diagram ppt icon
Presenting team roles and responsibilities sample diagram ppt icon. This is a team roles and responsibilities sample diagram ppt icon. This is a eight stage process. The stages in this process are reporting, implementing, project manager, risk analysis, monitoring, messaging, planning, oversight.
-
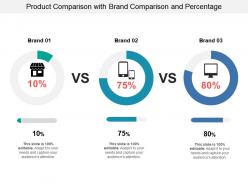 Product comparison with brand comparison and percentage
Presenting this set of slides with name - Product Comparison With Brand Comparison And Percentage. This is a three stage process. The stages in this process are Business Swot Analysis, Product Comparison And Competitive Landscape, Competitive Analysis, Swot Analysis Competitor Comparison.
-
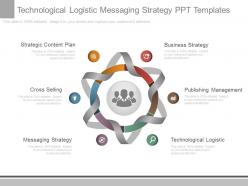 Innovative technological logistic messaging strategy ppt templates
They provide numerous opportunities to improve the decision-making process. They are technology and action oriented. They contain easy merging capabilities. Their icons and orientation can be altered without any hassles. They aim to make the business objective clear to the audience. The stages in this process are strategic content plan, cross selling, messaging strategy, technological logistic, publishing management, business strategy.
-
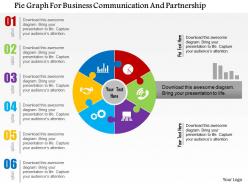 Pie graph for business communication and partnership flat powerpoint design
This presentation template is fully compatible with Google slides. Picture quality remain unaffected even when resize the image. Easily converted to other software’s like JPG and PDF formats. Ideal recommendation for marketing, entrepreneurs and big organizations. Change PowerPoint design for font, text, color and design as per your style. Trouble-free data input of company logo, brand or name.
-
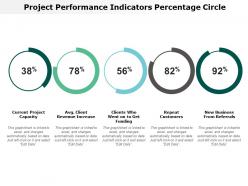 Project performance indicators percentage circle
Presenting this set of slides with name - Project Performance Indicators Percentage Circle. This is a five stage process. The stages in this process are Percentage Circle, Percentage Round, Pie Chart.
-
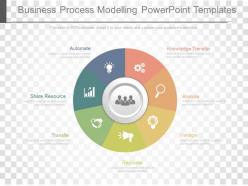 Business process modelling powerpoint templates
Presenting, business process modeling PowerPoint templates. Edit the color schemes in the circular layout. Move or replace the icons used. Project it on a widescreen without pixilation. Reinstate the content with your own business information. Include your brand’s logo or name in the slide background. Works well with the Google Slides. Availed for every small and large business firm. Downloading it will release its full version which allows you to use in 4:3 standard and full-screen version 16:9.
-
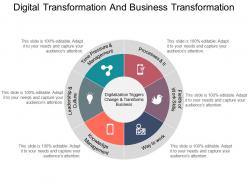 Digital transformation and business transformation good ppt example
Presenting digital transformation and business transformation good ppt example. This is a digital transformation and business transformation good ppt example. This is a six stage process. The stages in this process are digital transformation.
-
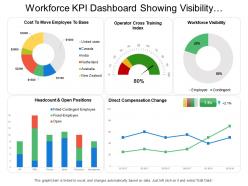 Workforce kpi dashboard showing visibility headcount and direct compensation change
Presenting this set of slides with name - Workforce Kpi Dashboard Showing Visibility Headcount And Direct Compensation Change. This is a five stage process. The stages in this process are Staff, Personnel, Workforce.
-
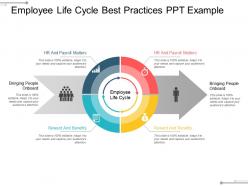 Employee life cycle best practices ppt example
Presenting employee life cycle best practices ppt example. This is a employee life cycle best practices ppt example. This is a four stage process. The stages in this process are employee relationship management, employee life cycle, employee relations.
-
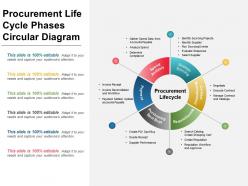 Procurement life cycle phases circular ppt slide
Presenting procurement life cycle phases circular ppt slide. This is a procurement life cycle phases circular ppt slide. This is a six stage process. The stages in this process are procurement, purchasing, ?bidding.
-
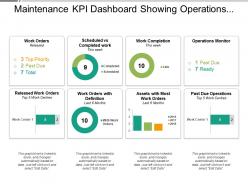 Maintenance kpi dashboard showing operations monitor and past due operations
Presenting this set of slides with name - Maintenance Kpi Dashboard Showing Operations Monitor And Past Due Operations. This is a three stage process. The stages in this process are Maintenance, Preservation, Conservation.
-
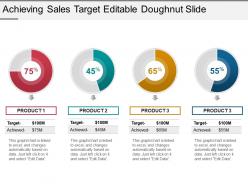 Achieving sales target editable doughnut slide powerpoint slides
The biggest advantage of downloading this sales target achievement doughnut PPT diagram is the use of excel linked chart. Include your business related statistics over linked excel sheet and get it directly updated in the PPT design. Design allows full editing. PPT can be quickly downloaded into JPEG and PDF formats. You can open the design with Google Slides and Microsoft PowerPoint software.
-
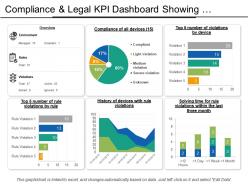 Compliance and legal kpi dashboard showing violations by devices
Presenting this set of slides with name - Compliance And Legal Kpi Dashboard Showing Violations By Devices. This is a six stage process. The stages in this process are Compliance And Legal, Legal Governance, Risk Management.
-
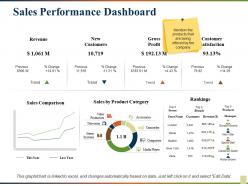 Sales performance dashboard
Presenting this set of slides with name - Sales Performance Dashboard. This is a seven stage process. The stages in this process are Revenue, New Customers, Gross Profit, Customer Satisfaction, Rankings .
-
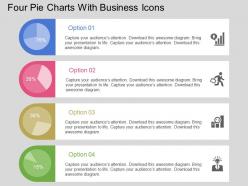 Four Pie Charts With Business Icons Flat Powerpoint Design
Presenting four pie charts with business icons flat PowerPoint template. Slides can be viewed in wide screens for more clear vision. PowerPoint slides are well-matched with Google slides. Fully editable PPT template as can be edited as required. Download is quick and saving is possible. Easy to convert into Jpeg and Pdf document. Perfect for business professionals and managers. They propose the information precisely without any confusions. They can be converted to different formats. They are result and technology oriented.
-
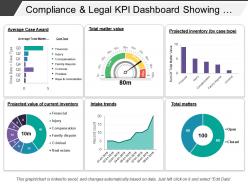 Compliance and legal kpi dashboard showing total matter value
Presenting this set of slides with name - Compliance And Legal Kpi Dashboard Showing Total Matter Value. This is a six stage process. The stages in this process are Compliance And Legal, Legal Governance, Risk Management.
-
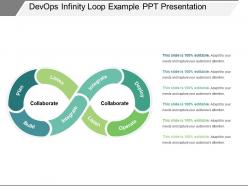 Devops infinity loop example ppt presentation
Presenting devops infinity loop example PPT presentation. Visuals used in PPT are just perfect for software development and operation slideshows. You can easily edit the design by following instructions given. Easy and quick downloading available. Download the design into JPEG and PDF formats. PPT can be opened with Google Slides and other online and offline software.
-
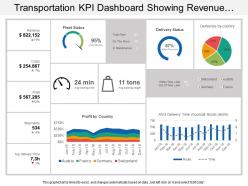 Transportation kpi dashboard snapshot showing revenue costs profit fleet status
Presenting KPI dashboard snapshot showing revenue costs profit fleet status slideshow. Change PowerPoint structure, font, text, color and design as per your requirements. Easy to input data with excel linked charts, just right to click to input data. This presentation theme is totally attuned with Google slides. Easy conversion to other software’s like JPG and PDF formats. Image quality of these PPT diagram remains the unchanged even when you resize the image or portray on large screens.
-
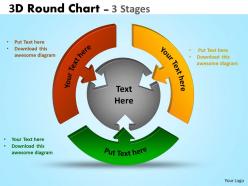 3d stages diagram ppt templates 4
This template is skillfully designed and is completely editable to suit all the needs and requirements of the user. The color of the font, its size, style, and all other elements can be customized according to the user's desire The text in the PPT placeholder can be replaced with the desired information making this template highly flexible and adaptable as well. This template is also compatible with various Microsoft versions and formats like Google Slides, JPG, PDF, etc so the user will face no issue in saving it in the format of his choice.
-
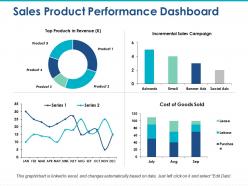 Sales product performance dashboard incremental sales campaign
Providing sales product performance dashboard incremental sales campaign presentation template with editing preference as images, icons, colors, text and layout can be edit as required. PowerPoint design can be downloaded and save into JPG and PDF format. High resolution ensures no pixel break. PPT diagram downloadable in standard and widescreen view. Fully adjustable slide as works well with Google slides. Easy to adjust and present when required. Quick to share message effectively.
-
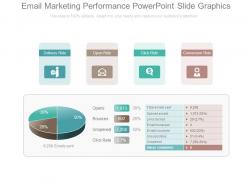 Email marketing performance powerpoint slide graphics
Presenting email marketing performance PowerPoint template. Access to convert the presentation design into JPG and PDF. Offer 100% access to change the size and style of the slides once downloaded and saved in the desired format. High quality charts, images and visuals used in the designing process. Choice to get presentation slide in standard or in widescreen view. Easy to convert in JPEG and PDF document. Compatible with Google slides. Easy and hassle free downloading process.
-
 Status symbol four circles loading round progress bar 1
Presenting status symbol four circles loading round progress bar 1. This is a status symbol four circles loading round progress bar 1. This is a four stage process. The stages in this process are status symbol, status icon.
-
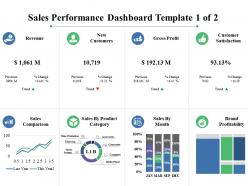 Sales performance dashboard revenue new customers
Providing sales performance dashboard revenue new customers PowerPoint template. PPT graphic can be shared in standard and widescreen view. High resolution picture quality ensures no pixel break up even when shared with large set of audience. Presentation slide is adaptable with Google slides. Magnificent to share business communication effectively. PPT slide is available with different nodes and stages. PowerPoint design can be edited as needed and change into JPG and PDF format.
-
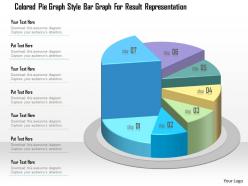 1214 colored pie graph style bar graph for result representation powerpoint template
PowerPoint slides works well with the Google slides. Completely amendable PPT layouts, one can change the colour, shape and size. Downloading is speedy and can be effortlessly changed over into JPEG and PDF record. Ideal for business experts, entrepreneurs, and marketers. Free of all sorts of space limitation issues. Manual editing option giving easy pinpoint control to user.


