- Sub Categories
-
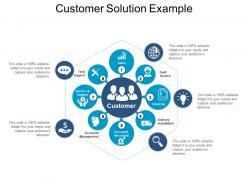 Customer solution example
Presenting Customer Solution Example PowerPoint graphic which is designed professionally for your convenience. This template is adaptable with Google Slides, which makes it easily accessible at once. You can customize the colors, fonts, font size, and font type of the slide as per your business needs. Can be changed into various formats like PDF, JPG, and PNG.
-
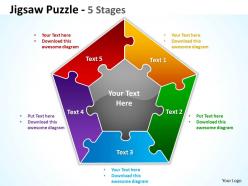 Jigsaw puzzle diagram 7
This template is skillfully designed and is completely editable to suit all the needs and requirements of the user. The color of the font, its size, style, and all other elements can be customized according to the user's desire The text in the PPT placeholder can be replaced with the desired information making this template highly flexible and adaptable as well. This template is also compatible with various Microsoft versions and formats like Google Slides, JPG, PDF, etc so the user will face no issue in saving it in the format of his choice.
-
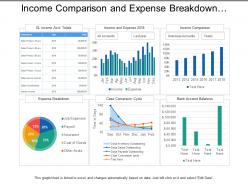 Income comparison and expense breakdown utilities dashboard
Presenting this set of slides with name - Income Comparison And Expense Breakdown Utilities Dashboard. This is a six stage process. The stages in this process are Utilities, Use, Advantage.
-
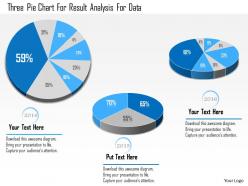 1114 three pie chart for result analysis for data powerpoint template
We are proud to present our 1114 three pie chart for result analysis for data powerpoint template. Display the concept of result analysis with this Power Point template slide. This PPT slide contains the graphic of three pie chart . This PPt slide can be used for business and sales data related analysis.
-
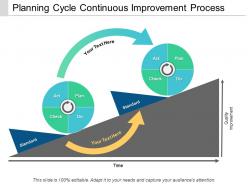 Planning cycle continuous improvement process powerpoint guide
Presenting planning cycle continuous improvement process PowerPoint guide. This slideshow offers easy data entry options to put in the company logo, brand or name. Perfect design for marketing teams, entrepreneurs, business managers, and big companies. This presentation theme is totally attuned with Google Slides. Easy conversion to other software like JPG and PDF formats. Image quality remains unchanged even when you resize the image or portray on big screens. You can change PowerPoint structure, font, text, color, and design as per your requirements.
-
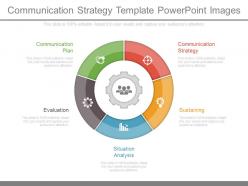 Communication strategy template powerpoint images
Beneficial for staff, donors, community, groups, social service workers. Use of professional stock photos and smart art design. Presentation slide is compatible with Google slide. PPT icon supports replacing and adding your own photo. Orientation of any graphic can be changed. Change color, font, and size with no loss of resolution.
-
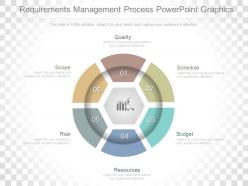 Requirements management process powerpoint graphics
An universal PowerPoint visual narratives clenching the content matter effectively , Manageable to PDF, JPG or other various file configurations, Arduous Presentation graphics for entreating the viewer’s, Scope available to replace dummy Presentation template diagrams, Erratic vector based visuals ,symbols, texts, pictures etc., Presenting your business idea through an immense quality visual options,The stages in this process are quality, schedule, budget, resources, risk, scope.
-
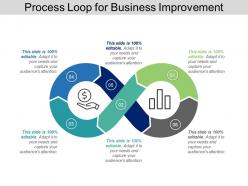 Process loop for business improvement ppt images
Presenting process loops for business improvement PPT design. This PowerPoint design is adaptable with all the Google Slides. This Presentation slide can also be simply exportable into PDF or JPG file schemes. This PPT image can be displayed in a larger screen ratio with an unaffected high resolution. All the aspects or features of this Presentation graphic like matter, pattern, context, etc. are fully alterable.
-
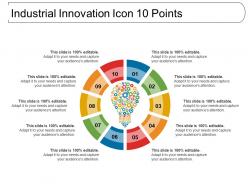 Industrial innovation icon 10 points
Presenting this Industrial Innovation Icon 10 Points template. The slide is fully adaptable in PowerPoint and other related software. You can alter the font type, size, diagram color, background color, etc. The slideshow is also compatible with Google Slides and can be saved in numerous image formats such as JPEG, PNG or document formats such as PDF without any difficulty. Moreover, high-quality graphics will ensure that picture quality does not decrease.
-
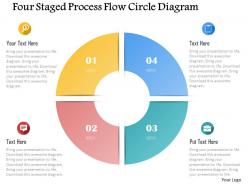 0115 four staged process flow circle diagram powerpoint template
We are proud to present our 0115 four staged process flow circle diagram powerpoint template. Four staged process flows has been used to design this power point template. This PPT diagram contains the concept of data flow. Use this PPT for business and marketing data related topics in any presentation.
-
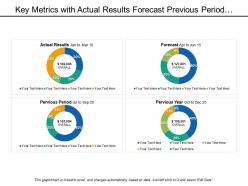 Key metrics with actual results forecast previous period and year
Presenting this set of slides with name - Key Metrics With Actual Results Forecast Previous Period And Year. This is a four stage process. The stages in this process are Key Metrics, Key Performance Indicator, Kpi.
-
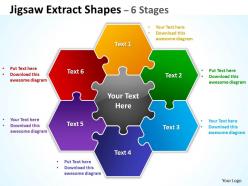 Jigsaw extract diagram shapes 6 stages 9
Intelligently designed and developed puzzle PowerPoint diagram. Resourceful presentation infographics. High quality visuals for convenient wide screen output. No error of pixilation. Compatible with multiple formats and software. Thoroughly editable slide content. Ease of personalization with company logo, name and trademark. Reference for execution the editing section has been provided. Applied by the entrepreneurs, sales management, logistics department, promotional management and educators.
-
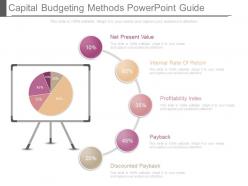 New capital budgeting methods powerpoint guide
High resolution PPT diagrams. 100 percent editable format. Easy inclusion and exclusion of information as per individual choice. Adaptable and convertible into various formats. Simple to download. For more of personalization one may easily add the company name, logo or trademark. Productive set of PowerPoint icon images for entrepreneurs, investors, internal and external stakeholders, researchers, business analysts and education professionals. The stages in this process are net present value, internal rate of return, profitability index, payback, discounted payback.
-
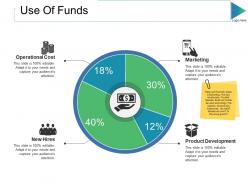 Use of funds ppt slides clipart
Presenting this set of slides with name - Use Of Funds Ppt Slides Clipart. This is a four stage process. The stages in this process are Operational Cost, New Hires, Product Development, Marketing, Business.
-
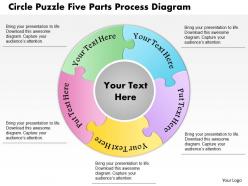 0914 business plan circle puzzle five parts process diagram powerpoint template
Easy to download and save in the format you like. Replace the content with your business information. Access to use with the Google Slides. Pixel friendly images and graphics in the slide design. Open on a wide screen view without any fear of pixelating. Useful for the business managers, sales professionals and the business learners and geography students.
-
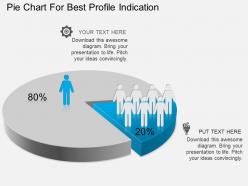 Fq pie chart for best profile indication powerpoint template
Pie chart for best profile indication PPT Slide. Completely editable slide in which colors, images and text can be changed easily. Modify and personalize the presentation by including the company name and logo. Pictures graphics do not pixelate when projected on wide screen. Compatible with multiple software options available both online and offline. Widely used by sales leaders, marketers, business professionals, analysts, strategists, etc. High resolution and fine quality PowerPoint slides.
-
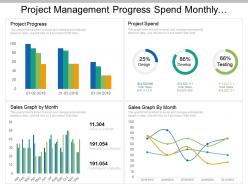 Project management progress spend monthly growth dashboard
Presentation design is easy download and can be changed into other software programs such as JPEG and PDF. Personalize the PowerPoint template with brand name, logo and image. Presentation slide is available with choice to download with different nodes and stages. Completely editable PPT slide can be edited as colors, icons, and text. Easy to present amongst large set of audience as accessible in widescreen view option. PowerPoint graphic can be merged with Google slides as fully compatible with them.
-
 Client loyalty strategies corporate process strategy growth strategy plan
SlideTeam presenting before you client loyalty strategies corporate process and growth strategy plan presentation. This presentation is completely modifiable from the first slide till the last. All the shapes used in the presentation can be he removed or edited according to your choice as and when you feel like doing so. A trained professional like you would be falling short of time so it’s better if you get a readymade presentation and make the desired changes as the slideshow is 100 percent editable.
-
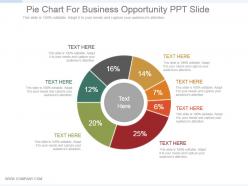 Pie chart for business opportunity ppt slide
Presenting pie chart for business opportunity ppt slide. This is a pie chart for business opportunity ppt slide. This is a seven stage process. The stages in this process are pie, chart, percentage, financials, process.
-
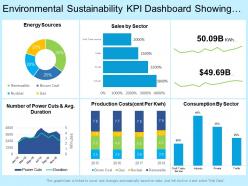 Environmental sustainability kpi dashboard showing total consumption sales energy sources
Presenting this set of slides with name - Environmental Sustainability Kpi Dashboard Showing Total Consumption Sales Energy Sources. This is a six stage process. The stages in this process are Environment Sustainability, Environment Continual, Environment Feasibility.
-
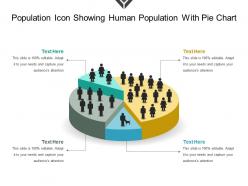 Population icon showing human population with pie chart
Presenting population icon showing human population with pie chart. This is a population icon showing human population with pie chart. This is a four stage process. The stages in this process are population icon, demographics icon, people growth icon.
-
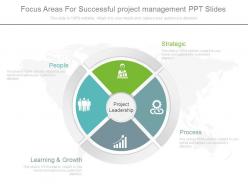 Apt focus areas for successful project management ppt slides
Presenting apt focus areas for successful project management ppt slides. This is a focus areas for successful project management ppt slides. This is four stage process. The stages in this proces are strategic, process, learning and growth, people.
-
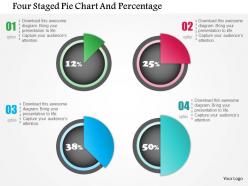 0115 four staged pie chart and percentage powerpoint template
We are proud to present our 0115 four staged pie chart and percentage powerpoint template. Four staged pie chart and percentage values has been used to design this power point template. This PPT contains the concept of financial result analysis. Use this PPT for business and marketing related presentations.
-
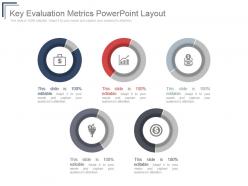 Key evaluation metrics powerpoint layout
Presenting key evaluation metrics powerpoint layout. This is a key evaluation metrics powerpoint layout. This is a five stage process. The stages in this process are icons, business, marketing, presentation, management.
-
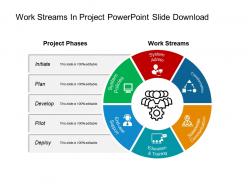 Work streams in project powerpoint slide download
Presenting work streams in project PowerPoint shape which is thoroughly editable and equipped with all that is needed by you to make an overall effective presentation. It has been designed professionally and can be edited according to the presenter’s needs and preferences. This PowerPoint shape is flexible with Google Slides, compatible with multiple softwares and format options. You can select from thousands of editable icons on each and every topic. Often used by sales managers, team head and / or business managers.
-
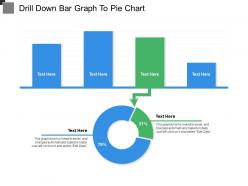 Drill down bar graph to pie chart
Presenting this set of slides with name - Drill Down Bar Graph To Pie Chart. This is a two stage process. The stages in this process are Drill Down, Hierarchy, Top Downwards.
-
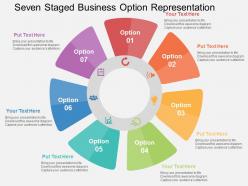 Seven staged business option representation flat powerpoint design
We are proud to present our seven staged business option representation flat powerpoint design. Seven staged business option diagram has been used to design this power point template diagram. This PPT diagram contains the concept of business option representation. Use this PPT diagram for business and finance related presentations.
-
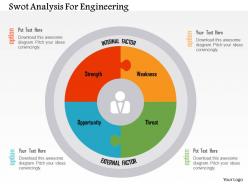 Swot analysis for engineering flat powerpoint design
Pixel friendly graphics and the diagrams. Instantly downloadable. Attuning with the Google slides. Go well with the Microsoft office software’s. Insert your brand name. Customize the icons and images. Edit the content information. Add on the hues or change as per requirement. Used by the engineers, business professionals, students and the teachers.
-
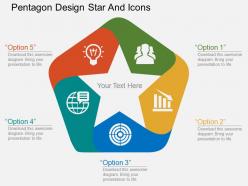 Co pentagon design star and icons flat powerpoint design
They are the high resolution PPT template inscribing the concept of business development. These Presentation designs, contents, themes, symbols can be personalized according to your requirement. These PPT graphics can be diversified into divergent layouts like PDF or JPG etc. These are quite handy for the business experts, managers, and management students.
-
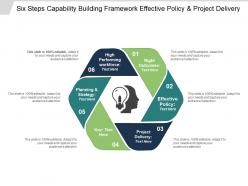 Six steps capability building framework effective policy and project delivery
Presenting this set of slides with name - Six Steps Capability Building Framework Effective Policy And Project Delivery. This is a six stage process. The stages in this process are Capability Building, Potential Building, Capability Development.
-
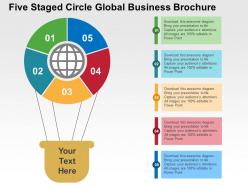 Five staged circle global business brochure flat powerpoint design
Completely editable five staged circle global business brochure PPT Slides including editable fonts, visuals, text, colors, etc. Compatible with number of software options. Excellence in picture quality. Beneficial for investors, shareholders, financiers, professors, students, marketers, sales people, etc. Presentation design can be displayed in standard and widescreen view. Personalize the presentation with individual company name and logo.
-
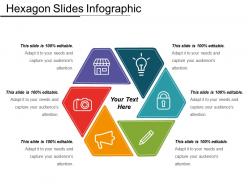 Hexagon slides infographic powerpoint deck template
Presenting Hexagon Slide Infographic PowerPoint Deck Template. This PPT includes 1 deck template which can be easily edited as per the preference. The infographic PowerPoint hexagon slide can be instantly downloaded just with a click. It can be used by any business organisation, management, HR or any other organisation. The image quality does not degrade in any size of the screen. Compatible with Google Slides. Available in two slide size designs- standard and widescreen.
-
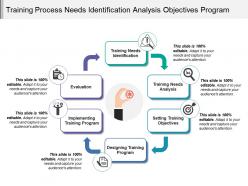 Training process needs identification analysis objectives program
Presenting this set of slides with name - Training Process Needs Identification Analysis Objectives Program. This is a six stage process. The stages in this process are Training Process, Training Procedure, Education Process.
-
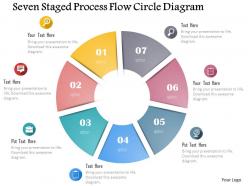 0115 seven staged process flow circle diagram powerpoint template
Wonderful quality images used in the Presentation illustration. High resolution PPT slide as can be projected on wide screen. Harmonious with maximum number of software i.e. JPG and PDF. Pleasant in usage with the available format options. Trouble free inclusion of company’s personalized content. Fully modifiable presentation vector, text, icons, graphics and image. Easy inclusion and exclusion of content as per industry requirement. PowerPoint graphic harmonized with Google slides. Beneficial for business professionals, analysts, strategists, students, teachers, etc.
-
 Employee experience process infographic ppt samples
Presenting our employee experience process infographic PPT samples. We have shown a high-quality design here which can be edited in terms of changing the colors and including your text or company logo. Resize the elements shown as needed. Mention the key points and edit the text section to explain your data. Use this design with Google Slides and project on a widescreen in business meetings for your best experience. Available in 4:3 standard, full-screen version 16:9 and can be converted into pdf or jpeg format by following a few simple steps. Easily edit the text shown here by following the guidelines and include your company data.
-
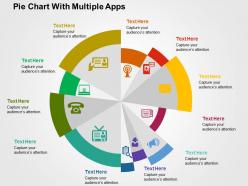 Pie chart with multiple apps flat powerpoint design
Extremely flexible and adaptable PPT presentation slides. Capable of impressing the viewers with their incredible performance. Maintains the speed and consistency of the system. Delivers true and accurate information to the viewers. Can be easily downloaded without any issues. Allows inserting the business logos, trademarks and other details if required.
-
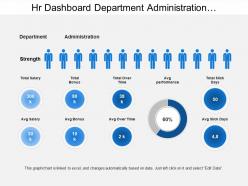 Hr dashboard department administration workforce strength
Presenting this set of slides with name - Hr Dashboard Department Administration Workforce Strength. This is a two stage process. The stages in this process are Hr Dashboard, Human Resource Dashboard, Hr Kpi.
-
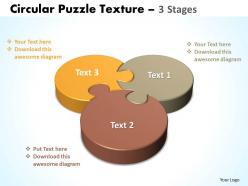 Circular puzzle texture 3 stages three diagram powerpoint templates 13
This template is skillfully designed and is completely editable to suit all the needs and requirements of the user. The color of the font, its size, style, and all other elements can be customized according to the user's desire The text in the PPT placeholder can be replaced with the desired information making this template highly flexible and adaptable as well. This template is also compatible with various Microsoft versions and formats like Google Slides, JPG, PDF, etc so the user will face no issue in saving it in the format of his choice.
-
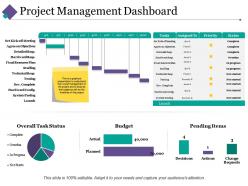 Project management dashboard snapshot ppt pictures infographic template
Displaying project management dashboard snapshot PPT picture infographic template. Alter the design with trade components like name and picture. Presentation slide is well-harmonized with Google slides. Colors and text can be replaced as the PowerPoint graphic comes with easy editing options. Rapid and easy download with saving options. PPT diagram can be viewed in both standard and widescreen display view. Flexible with other software options such as PDF or JPG formats.
-
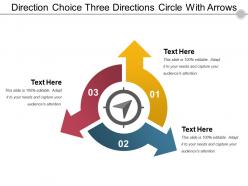 Direction choice three directions circle with arrows
Presenting direction choice three directions circle with arrows. This is a direction choice three directions circle with arrows. This is a three stage process. The stages in this process are direction choice, one to many, direction option.
-
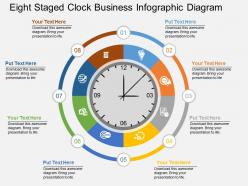 Fa eight staged clock business infographic diagram flat powerpoint design
Presenting fa eight staged clock business infographic diagram flat powerpoint design. Eight staged clock business info graphics diagram has been used to craft this power point template diagram. This PPT diagram contains the concept of time management. Use this PPT diagram for business and marketing related presentations.
-
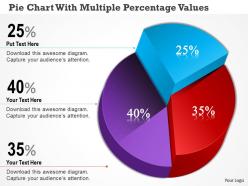 Bm pie chart with multiple percentage values powerpoint template
Straightforward download in quick and easy steps. Fully editable text as per your need and no limits on title or subtitle length. PPT infographics with absolutely modifiable size and orientation. Converts seamlessly into PDF or JPG format and runs with any software. Insert your company name, trademark, logo, tagline etc.
-
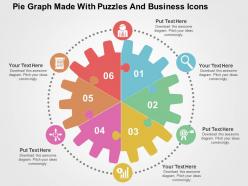 Pie graph made with puzzles and business icons flat powerpoint design
Superior resolution pictures and the slide symbols. Access to alter and redo according to your business prerequisite. Permit its clients to open on a wide screen show without trading off with the nature of the symbols. Procedure agreeable slide designs. Perfect to be utilized with the Google Slides. Simple to download and spare in the organization you like. It is valuable for the advertising experts, business directors and the business system fashioners.
-
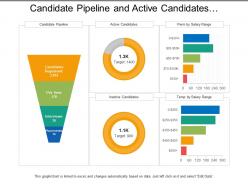 Candidate pipeline and active candidates recruitment dashboard
Presenting this set of slides with name - Candidate Pipeline And Active Candidates Recruitment Dashboard. This is a three stage process. The stages in this process are Staffing Plan, Recruitment, Staff Management.
-
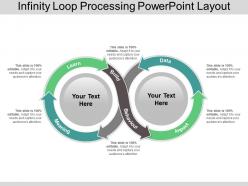 Infinity loop processing powerpoint layout
Presenting infinity loop processing PowerPoint layout PPT slide. You can download this infinite loop slide and then save into JPG & PDF format. User can also display infographic template in the standard or widescreen view. You can make changes in the slide like color, text, font type, font size and aspect ratio. The template is 100% compatible with Google Slides as well as editable in PowerPoint. A presenter can share the slide with large segment because of its amazing pixel quality. You can also insert the relevant content in text placeholder of the template.
-
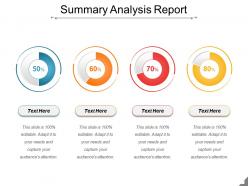 Summary analysis report presentation powerpoint example
Presenting Summary Analysis Report Presentation PowerPoint Example. It is fully editable in PowerPoint and the slide can be modified as per your requirements. Edit the fonts, colors and slide background. When you download the presentation, you get the PPT files in both widescreen (16:9) and standard screen (4:3) aspect ratio. Our presentation is compatible with Google Slides and can be saved in JPG or PDF format. Get this template with high resolution graphics and deliver presentations in no time.
-
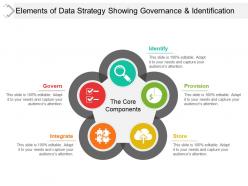 Elements of data strategy showing governance and identification
Presenting elements of data strategy showing governance and identification. This is a elements of data strategy showing governance and identification. This is a five stage process. The stages in this process are data strategy, data plan, data management.
-
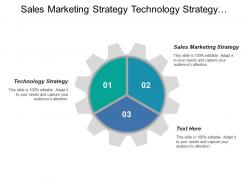 Sales marketing strategy technology strategy financial strategy brand associations
Presenting this set of slides with name - Sales Marketing Strategy Technology Strategy Financial Strategy Brand Associations. This is an editable three stages graphic that deals with topics like Sales Marketing Strategy, Technology Strategy, Financial Strategy, Brand Associations to help convey your message better graphically. This product is a premium product available for immediate download, and is 100 percent editable in Powerpoint. Download this now and use it in your presentations to impress your audience.
-
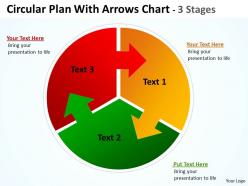 Circular plan three with arrows templates chart 3 stages 12
This template is skillfully designed and is completely editable to suit all the needs and requirements of the user. The color of the font, its size, style, and all other elements can be customized according to the user's desire The text in the PPT placeholder can be replaced with the desired information making this template highly flexible and adaptable as well. This template is also compatible with various Microsoft versions and formats like Google Slides, JPG, PDF, etc so the user will face no issue in saving it in the format of his choice.
-
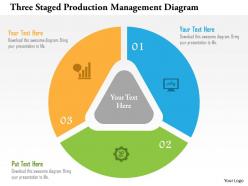 Three staged production management diagram flat powerpoint design
Runs extremely smooth and jitter-free on related software. PowerPoint images are of high resolution. Projection on widescreen doesn’t let PPT graphics to be pixelated. Fluent download of PPT slides. Further customize slide by inserting your company’s logo, trademark. Add titles and sub titles at will with no space constraints. Compatible with Google slides. Useful for startups, businesses and project management.
-
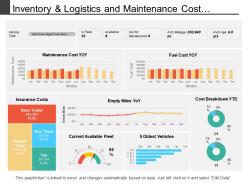 Inventory and logistics and maintenance cost dashboard
Presenting this set of slides with name - Inventory And Logistics And Maintenance Cost Dashboard. This is a three stage process. The stages in this process are Inventory And Logistics, Inventory Management, Warehousing And Inventory Management.
-
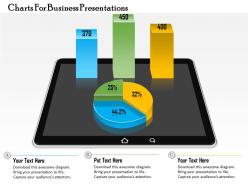 0714 business consulting charts for business presentations powerpoint slide template
We are proud to present our 0714 business consulting charts for business presentations powerpoint slide template. Emphatically define your message with our above diagram. Clarity of thought has been the key to your growth. Use this diagram to provide multiple options for taking in and making sense of information. Deliver amazing presentations to mesmerize your audience.
-
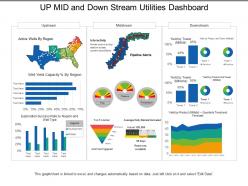 Up mid and down stream utilities dashboard
Presenting this set of slides with name - Up Mid And Down Stream Utilities Dashboard. This is a three stage process. The stages in this process are Utilities, Use, Advantage.
-
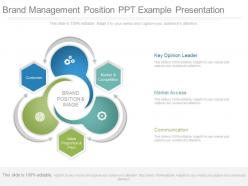 View brand management position ppt example presentation
PPT slide works well with Google slide. High resolution. PPT visual is useful to businessmen, research, development and market oriented approach. Presentation graphic helps to insert links of stored files and can be used to create animated GIF if required. PPT slide show can be optimized and viewed in tablets, phone, widescreen monitors and projector screens. The stages in this process are key opinion leader, market access, communication, value proportion and price, customer, market and competition.
-
 3d round chart 8 stages templates 4
Pixel friendly images and icons. Allow instant downloading and saving of the PPT slide icon. Easy to edit and customize. Edit the style,, background and orientation of the slide template. Beneficial for the business professionals, managers and the employees if an organization.
-
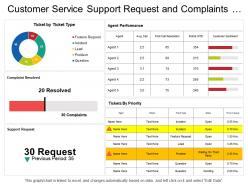 Customer service support request and complaints resolved dashboard
Presenting this set of slides with name - Customer Service Support Request And Complaints Resolved Dashboard. This is a three stage process. The stages in this process are Customer Base, Recurring Customers, Customer Services.
-
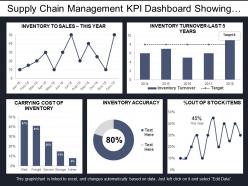 Supply chain management kpi dashboard showing inventory accuracy and turnover
Presenting this set of slides with name - Supply Chain Management Kpi Dashboard Showing Inventory Accuracy And Turnover. This is a five stage process. The stages in this process are Demand Forecasting, Predicting Future Demand, Supply Chain Management.
-
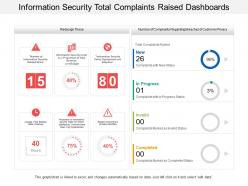 Information security total complaints raised dashboards
Presenting this set of slides with name - Information Security Total Complaints Raised Dashboards. This is a three stage process. The stages in this process are Information Security Strategy, Information Security Plan, Information Protection Strategy.
-
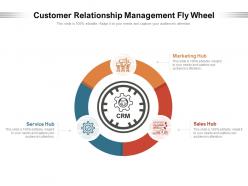 Customer relationship management fly wheel
Presenting this set of slides with name Customer Relationship Management Fly Wheel. This is a three stage process. The stages in this process are Marketing Hub, Sales Hub, Service Hub. This is a completely editable PowerPoint presentation and is available for immediate download. Download now and impress your audience.
-
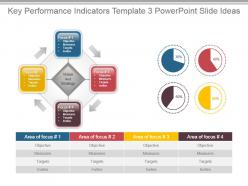 Key performance indicators template 3 powerpoint slide ideas
Presenting key performance indicators template 3 powerpoint slide ideas. Presenting key performance indicators template 3 powerpoint slide ideas. Presenting key performance indicators template 3 powerpoint slide ideas. This is a key performance indicators template 3 powerpoint slide ideas. This is four stage process. The stages in this process are objective, measures, targets, invites, area of focus, vision and strategy.


