- Sub Categories
-
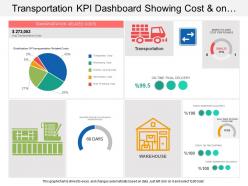 Transportation kpi dashboard showing cost and on time final delivery
Presenting transportation KPI dashboard showing cost and on time final delivery PPT slide. This deck offers you plenty of space to put in titles and sub titles. This template is Excel linked just right click to input your information. High resolution based layout, does not change the image even after resizing. This presentation icon is fully compatible with Google slides. Quick downloading speed and simple editing options in color text and fonts.PPT icons can easily be changed into JPEG and PDF applications.
-
 1214 pie graph with business result representation powerpoint template
We are proud to present our 1214 pie graph with business result representation powerpoint template. Pie graph has been used to design this power point template. This PPT contains the concept of business result analysis. Use this PPT for your business presentations and get good comments from your viewers.
-
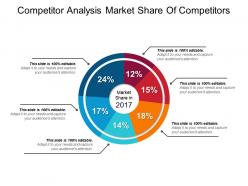 Competitor analysis market share of competitors ppt inspiration
Presenting competitor analysis market share of competitors PPT inspiration PPT slide. This presentation slide is widely applicable by a team of managers and business analyst who foresee the business in light of prosperity, by students and others. PPT has impressive picture quality with high resolution. 100 percent editable slide design. There is freedom to execute the changes in color, font, text and more as per one’s personal choice. Ease of personalization with your company name and logo. PPT is compatible with a wide variety of format options. PPT is harmonious with a set of software options, available both online and offline.
-
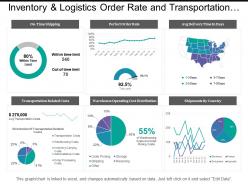 Inventory and logistics order rate and transportation costs dashboards
Presenting this set of slides with name - Inventory And Logistics Order Rate And Transportation Costs Dashboards. This is a three stage process. The stages in this process are Inventory And Logistics, Inventory Management, Warehousing And Inventory Management.
-
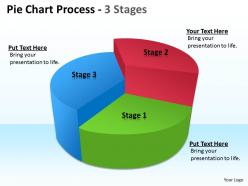 Pie chart process 3 stages
This template is skillfully designed and is completely editable to suit all the needs and requirements of the user. The color of the font, its size, style, and all other elements can be customized according to the user's desire The text in the PPT placeholder can be replaced with the desired information making this template highly flexible and adaptable as well. This template is also compatible with various Microsoft versions and formats like Google Slides, JPG, PDF, etc so the user will face no issue in saving it in the format of his choice.
-
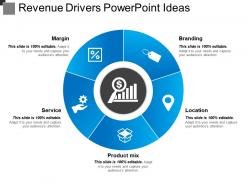 Revenue drivers powerpoint ideas
Presenting revenue drivers PowerPoint ideas PPT template. You can download the template and save into JPG & PDF format and can also display in the standard & widescreen view. You may alter the slide such as color, text, font type, font size and aspect ratio. The template gets synced with Google Slides and editable in PowerPoint. You may share this slide with large segment because it has tremendous pixel quality. You can insert the relevant content in text placeholder of this template.
-
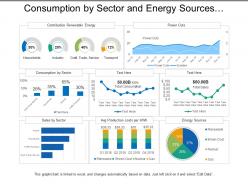 Consumption by sector and energy sources utilities dashboard
Presenting this set of slides with name - Consumption By Sector And Energy Sources Utilities Dashboard. This is a three stage process. The stages in this process are Utilities, Use, Advantage.
-
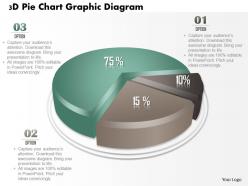 0714 business consulting 3d pie chart graphic diagram powerpoint slide template
We are proud to present our 0714 business consulting 3d pie chart graphic diagram powerpoint slide template. A 3d pie chart graphic is used to design this diagram. Display result analysis by using this 3d pie chart graphic diagram in your business presentation.
-
 0115 pie chart and magnifier for performance indication powerpoint template
Ideal for marketing professionals, business managers, entrepreneurs and big organizations. This presentation theme is totally attuned with Google slide. Easy conversion to other software’s like JPG and PDF formats. Image quality remain the unchanged even when resize the image. Change PowerPoint design’s font, text, color and design as per your manner. Easy to put in company logo, brand or name.
-
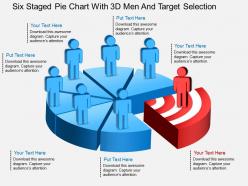 Fz six staged pie chart with 3d men and target selection powerpoint template
PowerPoint templates run smoothly with each software capable of displaying slides. Convert to JPG and PDF. Compatible with Google slides. Convenient widescreen viewing without PPT graphics pixilation. High resolution PPT graphics let you see more clearly. Highly customizable layout including font, text, color and design. This example of PPT presentation slide can be applied for businesses, educational institutes, data analytics.
-
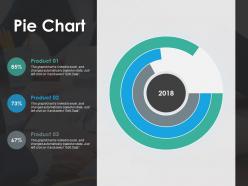 Pie chart ppt show infographic template
Presenting this set of slides with name - Pie Chart Ppt Show Infographic Template. This is a three stage process. The stages in this process are Percentage, Product, Management, Marketing, Business.
-
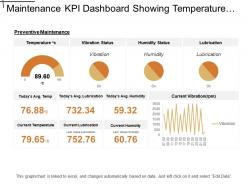 Maintenance kpi dashboard showing temperature and vibration status
Presenting this set of slides with name - Maintenance Kpi Dashboard Showing Temperature And Vibration Status. This is a five stage process. The stages in this process are Maintenance, Preservation, Conservation.
-
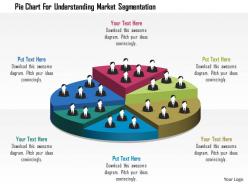 0115 pie chart for understanding market segmentation powerpoint template
Access to resize the shape and size of the slide icons. Flexible to be used with the Google Slides. Access to open on a widescreen view. Provided instructions to modify the slide designs. Replace the image icons with your own images. Useful for the Marketing and Sales professionals or business managers.
-
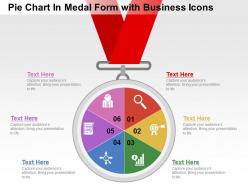 Pie chart in medal formwith business icons flat powerpoint design
We are proud to present our pie chart in medal formwith business icons flat powerpoint design. This power point template diagram has been crafted with graphic of pie chart and medal. This PPT diagram can be used to represent business result analysis. Use this PPT diagram for business and marketing related presentations.
-
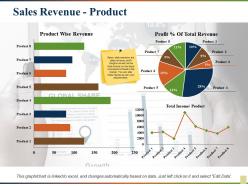 Sales revenue product revenue new customers gross profit
Presenting this set of slides with name - Sales Revenue Product Revenue New Customers Gross Profit. This is a eight stage process. The stages in this process are Product Wise Revenue, Profit Percentage Of Total Revenue, Total Income, Product.
-
 Key statistics powerpoint slide templates
Presenting this set of slides with name - Key Statistics Powerpoint Slide Templates. This is a four stage process. The stages in this process are Pie Chart, Marketing, Analysis, Strategy, Business.
-
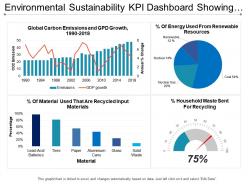 Environmental sustainability kpi dashboard showing global carbon emission and gdp growth
Presenting this set of slides with name - Environmental Sustainability Kpi Dashboard Showing Global Carbon Emission And Gdp Growth. This is a four stage process. The stages in this process are Environment Sustainability, Environment Continual, Environment Feasibility.
-
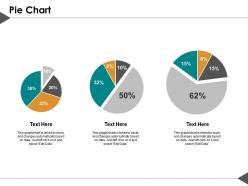 Pie chart ppt summary graphics tutorials
Presenting this set of slides with name - Pie Chart Ppt Summary Graphics Tutorials. This is a three stage process. The stages in this process are Percentage, Product, Business, Management, Marketing.
-
 Pie chart 3 stages 2
This template is skillfully designed and is completely editable to suit all the needs and requirements of the user. The color of the font, its size, style, and all other elements can be customized according to the user's desire The text in the PPT placeholder can be replaced with the desired information making this template highly flexible and adaptable as well. This template is also compatible with various Microsoft versions and formats like Google Slides, JPG, PDF, etc so the user will face no issue in saving it in the format of his choice.
-
 Funnel design chart with icons powerpoint slides
Presenting funnel design chart with icons powerpoint slides. This Power Point template slide has been crafted with graphic of funnel design chart and icons. This PPT slide contains the concept of result analysis. Use this PPT slide for business and finance related presentations.
-
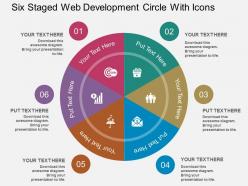 Cr six staged web development circle with icons flat powerpoint design
Presenting cr six staged web development circle with icons flat powerpoint design. Six staged web development circle with icons has been used to craft this power point template diagram. This PPT diagram contains the concept of web development techniques. Use this PPT diagram for business and technology related presentations.
-
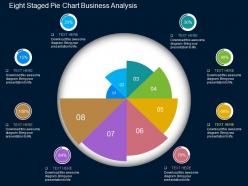 Eight staged pie chart business analysis flat powerpoint design
We are proud to present our eight staged pie chart business analysis flat powerpoint design. Eight staged pie chart has been used to craft this power point template diagram. This PPT diagram contains the concept of business analysis. Use this PPT diagram for business and marketing related presentations.
-
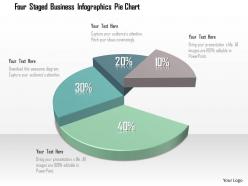 0115 four staged business infographics pie chart powerpoint template
We are proud to present our 0115 four staged business infographics pie chart powerpoint template. This power point template has been designed with graphic of pie chart and four staged info graphics. This PPT contains the concept of data analysis and data representation. Use this PPT for your data and result analysis related presentation.
-
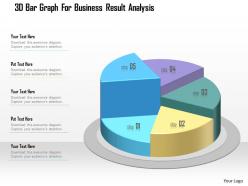 1214 3d bar graph for business result analysis powerpoint template
We are proud to present our 1214 3d bar graph for business result analysis powerpoint template. This Power Point template has been designed with graphic of 3d bar graph. This PPT contains the concept of business result analysis. Use this PPT for your business and marketing related presentations.
-
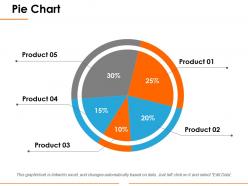 Pie chart ppt introduction
Presenting the flat pie chart PPT template. This presentation template is designed under the supervision of professionals and is 100% modifiable in PowerPoint. The user can bring changes to the objects like font color and font size in this slide and save it in JPG or PDF file format hassle-free. This slide is 100% compatible with Google Slide. Click on the download tab below to download this template in no time.
-
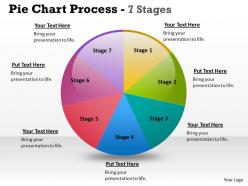 Pie chart process 7 stages 8
Organised and pre designed professional PPT templates. Customization of any PowerPoint icon and graphic according to need. High resolution and fit in widescreen. Personalization by insertion of company trade name logo possible. Hassle free conversion into desired format. Great use for entrepreneurs, sales and marketing individuals.
-
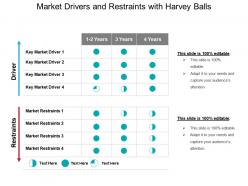 Market drivers and restraints with harvey balls powerpoint slide designs
Presenting market drivers and restraints with harvey balls PPT Slide which is 100% editable. This slideshow is data driven chart and the shapes of the graphics adjust automatically according to your data. Easy to customize and personalize this PowerPoint template and its high resolution visuals are easy to modify as per your need. This PowerPoint theme is compatible with Google Slides , multiple software and format options. This PPT is used by business analysts and professionals belongs to sales and marketing.
-
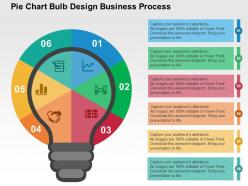 Pie chart bulb design business process flat powerpoint design
We are proud to present our pie chart bulb design business process flat powerpoint design. This power point template diagram has been crafted with graphic of pie chart and bulb design. This PPT diagram contains the concept of business process and idea representation. Use this PPT diagram for business and marketing related presentations.
-
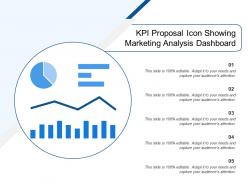 Kpi proposal icon showing marketing analysis dashboard
Presenting this set of slides with name - Kpi Proposal Icon Showing Marketing Analysis Dashboard. This is a five stage process. The stages in this process are Kpi Proposal, Kpi Plan, Kpi Scheme.
-
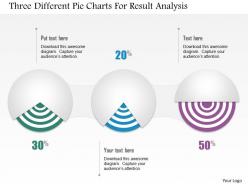 1214 three different pie charts for result analysis powerpoint template
We are proud to present our 1214 three different pie charts for result analysis powerpoint template. Three different pie charts are used to designed this power point template slide. This PPT slide contains the concept of result analysis. Use this PPT slide for your data and process related presentations.
-
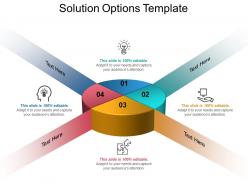 Solution options template ppt samples download
Presenting solution options template ppt samples download. This is a solution options template ppt samples download. This is a four stage process. The stages in this process are solution options, solution architecture, enterprise architecture.
-
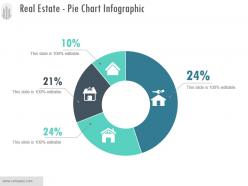 Real estate pie chart infographic sample of ppt presentation
Presenting real estate pie chart infographic sample of ppt presentation. This is a real estate pie chart infographic sample of ppt presentation. This is a four stage process. The stages in this process are icons, strategy, percentage, finance, business.
-
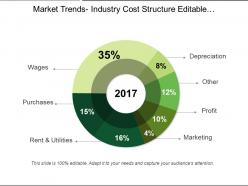 Market trends industry cost structure editable doughnut chart ppt icon
Presenting market trends industry cost structure editable doughnut chart ppt icon. This is a market trends industry cost structure editable doughnut chart ppt icon. This is a seven stage process. The stages in this process are wages, purchases, rent and utilities, marketing, profit, other, depreciation.
-
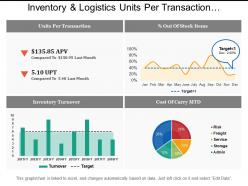 Inventory and logistics units per transaction dashboards
Spectacular inventory and logistics units per transaction dashboards PPT template. Top quality and creative PowerPoint slide design. Adjustable presentation graphic as compatible with Google slides. Perfect for sales executives, marketers, business professionals, analysts, strategists, students, teachers, etc. Information on making the changes has been provided for your provision. Download is rapid and can be displayed in widescreen view mode also. 100% editable PPT designs as completely modifiable such as icons, text, colors, etc. Effortlessly convertible into JPEG and PDF file formats.
-
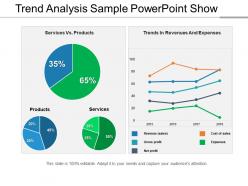 Trend analysis sample powerpoint show
Presenting a PowerPoint slide named Trend Analysis Sample PowerPoint Show. Create a compelling presentation with this PPT diagram, which is both professional and editable. Customize colors, choose font styles, and size. You can choose from a wide variety of icons. Resize and scale the images to fit any content. The PPT slide is compatible with Google Slides and can be fetched at once. You can save it as both PDF and JPG format. This PPT slide is data-driven and linked to the Excel sheet.
-
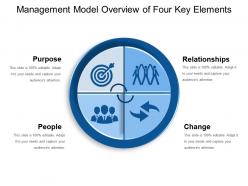 Management model overview of four key elements
Presenting this set of slides with name - Management Model Overview Of Four Key Elements. This is a four stage process. The stages in this process are Management Model, Management Framework, Management Structure.
-
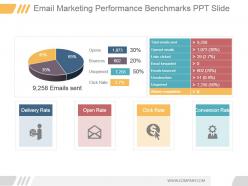 Email marketing performance benchmarks ppt slide
Presenting email marketing performance benchmarks ppt slide. This is a email marketing performance benchmarks ppt slide. This is a two stage process. The stages in this process are opens, bounces, unopened, click rate, emails sent, total emails sent, opened emails, links clicked, email forwarded, emails bounced, unsubscribes, unopened, abuse complaints, delivery rate, open rate, click rate, conversion rate.
-
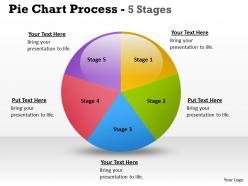 Pie chart process 5 stages 7
This template is skillfully designed and is completely editable to suit all the needs and requirements of the user. The color of the font, its size, style, and all other elements can be customized according to the user's desire The text in the PPT placeholder can be replaced with the desired information making this template highly flexible and adaptable as well. This template is also compatible with various Microsoft versions and formats like Google Slides, JPG, PDF, etc so the user will face no issue in saving it in the format of his choice.
-
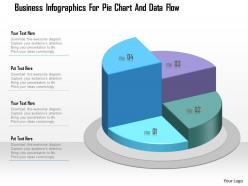 1214 business infographics for pie chart and data flow powerpoint template
We are proud to present our 1214 business infographics for pie chart and data flow powerpoint template. Graphic of business info graphics and pie chart has been used to craft this power point template. This PPT contains the concept of data flow. Use this PPT for your business and marketing related presentations.
-
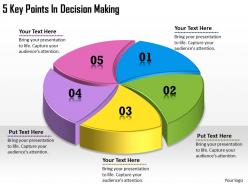 1113 business ppt diagram 5 key points in decision making powerpoint template
We are proud to present our 1113 business ppt diagram 5 key points in decision making powerpoint template. Our Marketing Powerpoint Templates are the layers of your gourmet cake. Provide the icing of your ideas and produce a masterpiece. Use our Finance Powerpoint Templates and and feel the difference. Right off they generate a surge of interest.
-
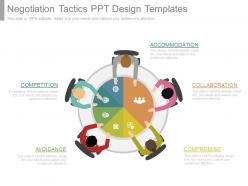 Use negotiation tactics ppt design templates
Presenting use negotiation tactics ppt design templates. This is a negotiation tactics ppt design templates. This is a five stage process. The stages in this process are accommodation, collaboration, compromise, avoidance, competition.
-
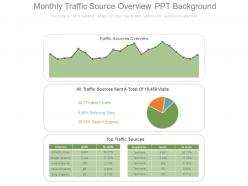 Monthly traffic source overview ppt background
Presenting monthly traffic source overview ppt background. This is a monthly traffic source overview ppt background. This is a four stage process. The stages in this process are traffic sources overview, direct traffic, referring sites, search engines.
-
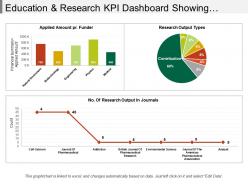 Education and research kpi dashboard Snapshot showing research outputs and amount
Presenting education and research KPI dashboard snapshot showing research outputs and amount PPT slide. The research data metric presentation slide designed by professional team of SlideTeam. The education and research report PPT slide is 100% customizable in PowerPoint. The research amount KPI dashboard slide is also compatible with Google Slide so a user can share this slide with others. A user can make changes in the font size, font type, color as well as dimensions of the research key measure PPT template as per the requirement. You may edit the value in the research key measure PPT template as the slide gets linked with the Excel sheet.
-
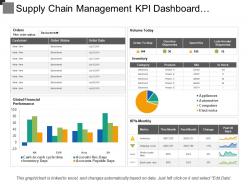 Supply chain management kpi dashboard showing order status volume and inventory
Presenting this set of slides with name - Supply Chain Management Kpi Dashboard Showing Order Status Volume And Inventory. This is a two stage process. The stages in this process are Demand Forecasting, Predicting Future Demand, Supply Chain Management.
-
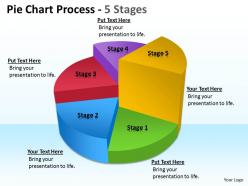 Pie chart process 5 stages
This template is skillfully designed and is completely editable to suit all the needs and requirements of the user. The color of the font, its size, style, and all other elements can be customized according to the user's desire The text in the PPT placeholder can be replaced with the desired information making this template highly flexible and adaptable as well. This template is also compatible with various Microsoft versions and formats like Google Slides, JPG, PDF, etc so the user will face no issue in saving it in the format of his choice.
-
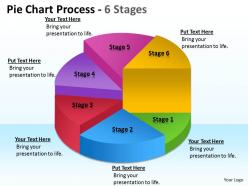 Pie chart process 6 stages
This template is skillfully designed and is completely editable to suit all the needs and requirements of the user. The color of the font, its size, style, and all other elements can be customized according to the user's desire The text in the PPT placeholder can be replaced with the desired information making this template highly flexible and adaptable as well. This template is also compatible with various Microsoft versions and formats like Google Slides, JPG, PDF, etc so the user will face no issue in saving it in the format of his choice.
-
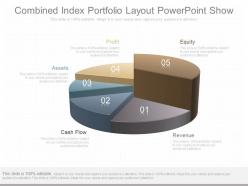 A combined index portfolio layout powerpoint show
Presenting a combined index portfolio layout powerpoint show. This is a combined index portfolio layout powerpoint show. This is a five stage process. The stages in this process are profit, equity, revenue, cash flow, assets.
-
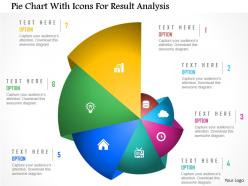 Cb pie chart with icons for result analysis powerpoint template
We are proud to present our cb pie chart with icons for result analysis powerpoint template. This power point template diagram has been crafted with graphic of pie chart and icons. This PPT diagram contains the concept of result analysis. Use this PPT for business and sales analysis related presentations.
-
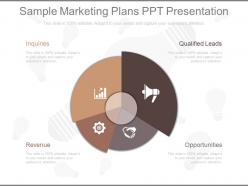 Sample marketing plans ppt presentation
Perfect for creating marketing plans for your new product or service. Completely compatible with Google slides. Matching Presentation designs available with different nodes and stages. Icon, Image and logo can be added or replaced as per industry requirement. Editable PowerPoint templates to provide you customize options. Simple to download and insert in the ongoing presentation. The stages in this process are inquiries, revenue, qualified leads, opportunities.
-
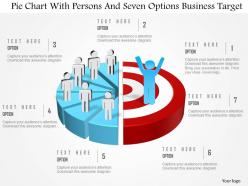 0115 pie chart with persons and seven options business target powerpoint template
Capable of providing great quality presentations to impress the viewers. Makes the concepts clear in the mind of the viewers. Eye catchy PPT presentation patterns and images. Imposes a long-lasting influence on the audience. Can be viewed on Big screens for more clarity and vision without pixelating the images. Entirely editable diagrams.
-
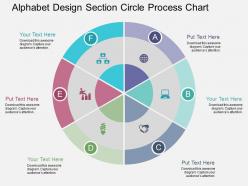 Ab alphabet design section circle process chart flat powerpoint design
Presenting ab alphabet design section circle process chart flat powerpoint design. This Power Point template diagram has been crafted with graphic of alphabet design circle process chart .This PPT diagram contains the concept of educational process flow. Use this PPT diagram for business and marketing related presentations.
-
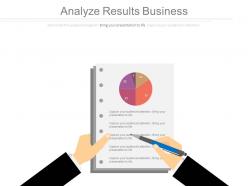 Analyze results business ppt slides
Presenting analyze results business ppt slides. This is a analyze results business ppt slides. This is a one stage process. The stages in this process are business, strategy, management, marketing.
-
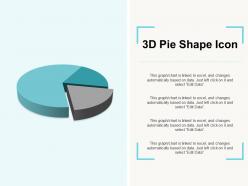 3d pie shape icon
Presenting this set of slides with name - 3d Pie Shape Icon. This is a four stage process. The stages in this process are Pie Charts, Marketing, Business.
-
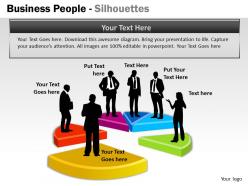 Business people silhouettes ppt 9
This template is skillfully designed and is completely editable to suit all the needs and requirements of the user. The color of the font, its size, style, and all other elements can be customized according to the user's desire The text in the PPT placeholder can be replaced with the desired information making this template highly flexible and adaptable as well. This template is also compatible with various Microsoft versions and formats like Google Slides, JPG, PDF, etc so the user will face no issue in saving it in the format of his choice.
-
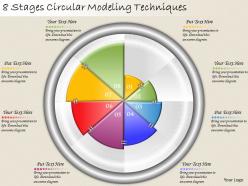 1213 business ppt diagram 8 stages circular modelling techniques powerpoint template
We are proud to present our 1213 business ppt diagram 8 stages circular modelling techniques powerpoint template. You have a driving passion to excel in your field. Our 1213 Business Ppt diagram 8 Stages Circular Modelling Techniques Powerpoint Template will prove ideal vehicles for your ideas. You are well armed with penetrative ideas.
-
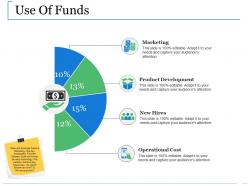 Use of funds ppt slides gallery
Presenting this set of slides with name - Use Of Funds Ppt Slides Gallery. This is a four stage process. The stages in this process are Business, Operational Cost, New Hires, Product Development, Marketing.
-
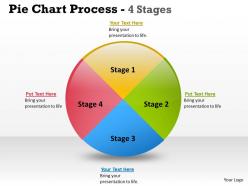 Pie chart process 4 stages 7
This template is skillfully designed and is completely editable to suit all the needs and requirements of the user. The color of the font, its size, style, and all other elements can be customized according to the user's desire The text in the PPT placeholder can be replaced with the desired information making this template highly flexible and adaptable as well. This template is also compatible with various Microsoft versions and formats like Google Slides, JPG, PDF, etc so the user will face no issue in saving it in the format of his choice.
-
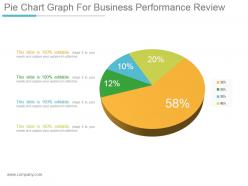 Pie chart graph for business performance review ppt design templates
Presenting pie chart graph for business performance review ppt design templates. This is a pie chart graph for business performance review ppt design templates. This is a four stage process. The stages in this process are pie, percentage, business, finance, marketing.
-
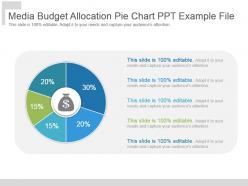 Media budget allocation pie chart ppt example file
Presenting media budget allocation pie chart ppt example file. This is a media budget allocation pie chart ppt example file. This is a five stage process. The stages in this process are business, marketing, strategy, management, success.
-
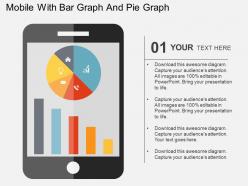 Mobile with bar graph and pie graph flat powerpoint design
We are proud to present our mobile with bar graph and pie graph flat powerpoint design. This power point template diagram has been crafted with graphic of mobile and bar graph This PPT diagram contains the concept of data analysis. Use this PPT diagram for business and marketing related presentations.


