- Sub Categories
-
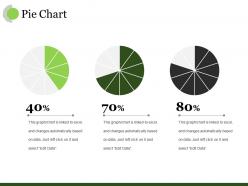 Pie chart ppt sample
Presenting this set of slides with name - Pie Chart Ppt Sample. This is a three stage process. The stages in this process are Business, Marketing, Finance, Planning, Strategy.
-
 Insurance total claims per year and month dashboard
• Bright colors and clarity in graphics • Thoroughly editable slides • Ease of editing the slides with the help of instructions provided. • Easy to download • Comfortably customizable • Of much help to financial analysts, insurance company employees, students and teachers. • High resolution of slide visuals do not let the image pixelate when projected on wide screen • Compatible with latest software options and multiple format types.
-
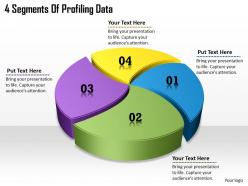 1113 business ppt diagram 4 segments of profiling data powerpoint template
We are proud to present our 1113 business ppt diagram 4 segments of profiling data powerpoint template. Clear and concise is the credo of our Strategy Powerpoint Templates. Use them and dispel any doubts your team may have. Effective communication is what our Marketing Powerpoint Templates ensure. They help you put across your views with precision and clarity.
-
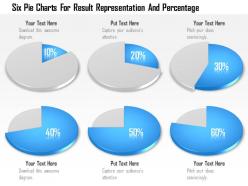 1114 six pie charts for result representation and percentage powerpoint template
We are proud to present our 1114 six pie charts for result representation and percentage powerpoint template. This Power Point template slide has been designed with graphic of seven staged vertical timeline diagram. This PPT slide contains the concept of business timeline formation. Use this PPT slide and make exclusive presentations.
-
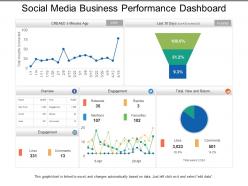 Social media business performance dashboard
Presenting, agile development showing product owner with iteration plan and planning meeting PPT template. This PPT slide can be used for agile development and sprint planning related presentations by experts, students or strategists. All the icons practiced here are 100% editable in PowerPoint software. You can change the color, size, and format of any icon to your liking. Insert your business logo in the PPT slide, which is also compatible with google slides.
-
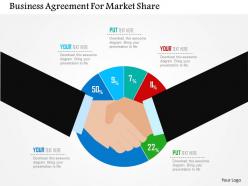 Business agreement for market share flat powerpoint design
We are proud to present our business agreement for market share flat powerpoint design. Concept of business agreement for market research and share has been displayed in this PPT diagram. This PPT diagram contains the graphic of handshake and pie graph. Use this PPT diagram for business and marketing related presentations.
-
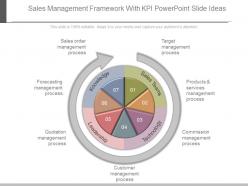 Sales management framework with kpi powerpoint slide ideas
Presenting sales management framework with kpi powerpoint slide ideas. This is a sales management framework with kpi powerpoint slide ideas. This is a seven stage process. The stages in this process are sales order management process, forecasting management process, quotation management process, customer management process, commission management process, products and services management process, target management process, knowledge, sales teams, technology, leadership.
-
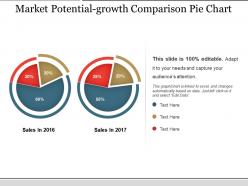 Market potential growth comparison pie chart ppt infographics
Presenting Market Potential Growth Comparison pie chart PPT infographics slide. This presentation diagram is 100% editable in PowerPoint and has been designed by professionals using high-quality graphics. You can customize the font type, font size, colors of the diagram, and background color as per your requirement. Incorporating your company name and logo in this slide is very easy. You can replace the dummy content in text placeholders with your presentation content without any hassle. This slide is fully compatible with Google Slides and can be saved in JPG or PDF format. High quality graphics and icons ensure that there is no deteriorating in quality on enlarging their size.
-
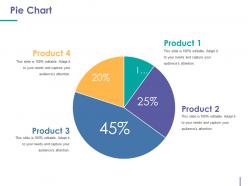 Pie chart powerpoint templates download
Presenting Pie Chart PowerPoint Templates Download. This PPT theme is available in both 4:3 and 16:9 aspect ratios. This PowerPoint template is customizable so you can modify the font size, font type, color and shapes as per your requirements. This PPT presentation is Google Slides compatible hence it is easily accessible. You can download and save this PowerPoint layout in different formats like PDF, PNG, and JPG.
-
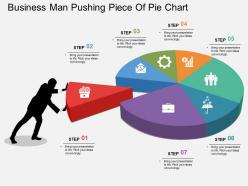 Al business man pushing piece of pie chart flat powerpoint design
Presenting al business man pushing piece of pie chart flat powerpoint design. This Power Point template diagram has been crafted with graphic of business man and pie chart diagram. This PPT diagram contains the concept of business result analysis representation. Use this PPT diagram for business and marketing related presentations.
-
 New team conflict management sample ppt files
Presenting new team conflict management sample ppt files. This is a team conflict management sample ppt files. This is a three stage process. The stages in this process are competition over resources, communication breakdowns, trust differing goals.
-
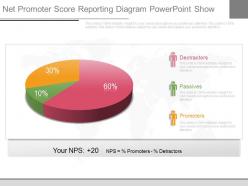 Innovative net promoter score reporting diagram powerpoint show
Presenting innovative net promoter score reporting diagram powerpoint show. This is a net promoter score reporting diagram powerpoint show. This is a three stage process. The stages in this process are dectractors, passives, promoters, your nps, nps, promoters.
-
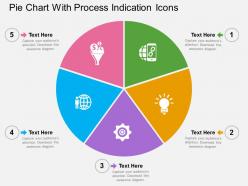 Pie chart with process indication icons flat powerpoint design
We are proud to present our pie chart with process indication icons flat powerpoint design. Graphic of pie chart and icons has been used to design this power point template diagram. This PPT diagram contains the concept of result analysis and process flow. Use this PPT diagram for business and marketing related presentations.
-
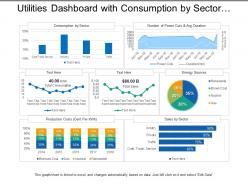 Utilities dashboard with consumption by sector and energy sources
Presenting this set of slides with name - Utilities Dashboard With Consumption By Sector And Energy Sources. This is a three stage process. The stages in this process are Utilities, Use, Advantage.
-
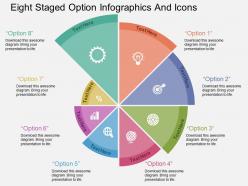 Gi eight staged option infographics and icons flat powerpoint design
Presenting gi eight staged option infographics and icons flat powerpoint design. Eight staged option info graphics and icons has been used to design this power point template diagram. This PPT diagram contains concept business information representations . Use this PPT diagram for business and management related presentations.
-
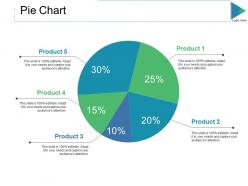 Pie chart ppt slides outfit
Presenting this set of slides with name - Pie Chart Ppt Slides Outfit. This is a five stage process. The stages in this process are Business, Marketing, Strategy, Percentage, Process.
-
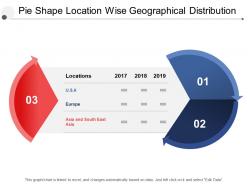 Pie shape location wise geographical distribution
Presenting this set of slides with name - Pie Shape Location Wise Geographical Distribution. This is a three stage process. The stages in this process are Pie Charts, Marketing, Business.
-
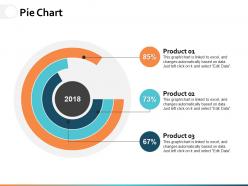 Pie chart ppt powerpoint presentation gallery infographic template
Presenting this set of slides with name - Pie Chart Ppt Powerpoint Presentation Gallery Infographic Template. This is a three stage process. The stages in this process are Percentage, Product, Business, Management, Marketing.
-
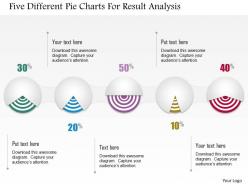 1214 five different pie charts for result analysis powerpoint template
We are proud to present our 1214 five different pie charts for result analysis powerpoint template. This power point template has been designed with graphic of five staged pie chart. This power point template contains concept of result analysis. Use this PPT for your business and marketing related presentations.
-
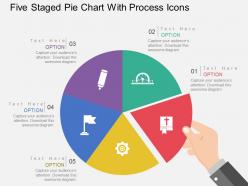 Five staged pie chart with process icons flat powerpoint design
We are proud to present our five staged pie chart with process icons flat powerpoint design. Five staged pie chart with process icons has been used to design this power point template diagram. This PPT diagram contains the concept of result analysis. Use this PPT diagram for business and marketing related presentations.
-
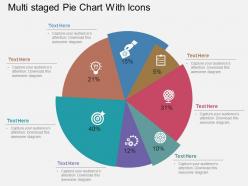 Multi staged pie chart with icons flat powerpoint design
We are proud to present our multi staged pie chart with icons flat powerpoint design. This power point template diagram has been crafted with graphic of multistage pie chart with icons. This PPT diagram contains the concept of result analysis. Use this PPT diagram and build a quality presentation for related topics.
-
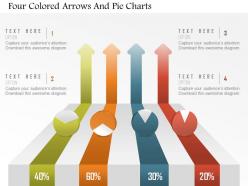 Am four colored arrows and pie charts powerpoint template
We are proud to present our am four colored arrows and pie charts powerpoint template. Graphic of four colored arrows and pie chart has been used to craft this PPT diagram. This PPT diagram contains the concept of financial analysis. Use this PPT and build an exclusive presentation for finance and marketing related topics.
-
 Service portfolio alignment services strategic ppt presentation
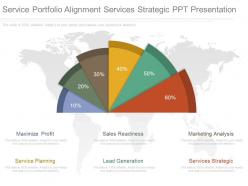
Presenting service portfolio alignment services strategic ppt presentation. This is a service portfolio alignment services strategic ppt presentation. This is a six stage process. The stages in this process are maximize profit, sales readiness, marketing analysis, service planning, lead generation, services strategic.
-
 Digital transformation map sample of ppt
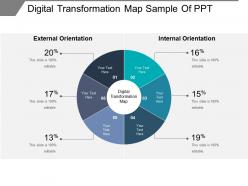
Presenting digital transformation map PPT slide design. This is contemporarily styled PowerPoint visual of tremendous quality and graphics. Easily exportable to PDF or JPG file compositions. Abundant space option to insert company emblem or trademark with the Presentation diagram. 100% rebuild able visuals, symbols, texts, pictures etc. Easily projected on large screen with immense quality Presentation graphic. Option to insert title and subtitle. Versant with all Google Slides. Quite beneficial for the management professionals.
-
 Df two staged vector infographics with icons flat powerpoint design
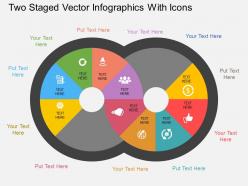
Presenting df two staged vector infographics with icons flat powerpoint design. Two staged vector info graphics and icons has been used to design this power point template diagram. This PPT diagram contains the concept of business data representation. Use this PPT diagram for business and marketing related presentations.
-
 Ec 3d men on pie chart with target part powerpoint template
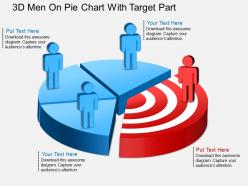
Presenting ec 3d men on pie chart with target part powerpoint template. This Power Point template diagram has been crafted with graphic of 3d man on pie chart. This PPT diagram contains the concept of target achievement. Use this PPT diagram for business and marketing related presentations.
-
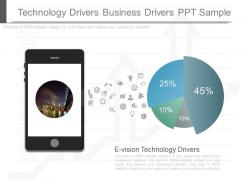 See technology drivers business drivers ppt sample
They will have an eye-opening impact on the audience by their astounding looks. They can be converted into different formats. They are result and technology oriented. They can be customised by changing the size and shape of icons and also by adding logos and images. They are compatible with google. The stages in this process are e vision, technology drivers, finance, marketing.
-
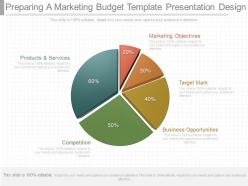 One preparing a marketing budget template presentation design
Presenting one preparing a marketing budget template presentation design. This is a preparing a marketing budget template presentation design. This is a five stage process. The stages in this process are marketing objectives, target mark, business opportunities, competition, products and services.
-
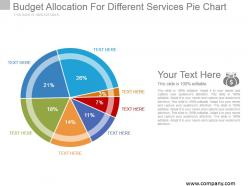 Budget allocation for different services pie chart example of ppt
Presenting budget allocation for different services pie chart example of ppt. This is a budget allocation for different services pie chart example of ppt. This is a seven stage process. The stages in this process are pie chart, finance, marketing, strategy, business, success, percentage.
-
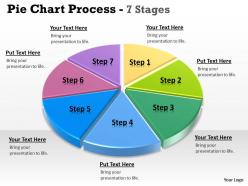 Pie chart 7 stages 6
This template is skillfully designed and is completely editable to suit all the needs and requirements of the user. The color of the font, its size, style, and all other elements can be customized according to the user's desire The text in the PPT placeholder can be replaced with the desired information making this template highly flexible and adaptable as well. This template is also compatible with various Microsoft versions and formats like Google Slides, JPG, PDF, etc so the user will face no issue in saving it in the format of his choice.
-
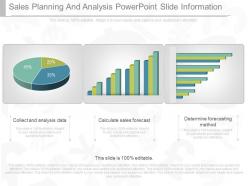 Custom sales planning and analysis powerpoint slide information
Presenting custom sales planning and analysis powerpoint slide information. This is a sales planning and analysis powerpoint slide information. This is a three stage process. The stages in this process are collect and analysis data, calculate sales forecast, determine forecasting method.
-
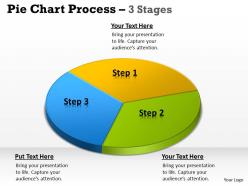 Pie chart process 3 stages 4
This template is skillfully designed and is completely editable to suit all the needs and requirements of the user. The color of the font, its size, style, and all other elements can be customized according to the user's desire The text in the PPT placeholder can be replaced with the desired information making this template highly flexible and adaptable as well. This template is also compatible with various Microsoft versions and formats like Google Slides, JPG, PDF, etc so the user will face no issue in saving it in the format of his choice.
-
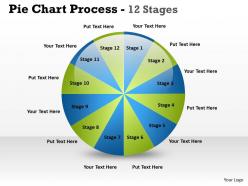 Pie chart process 12 stages 3
This template is skillfully designed and is completely editable to suit all the needs and requirements of the user. The color of the font, its size, style, and all other elements can be customized according to the user's desire The text in the PPT placeholder can be replaced with the desired information making this template highly flexible and adaptable as well. This template is also compatible with various Microsoft versions and formats like Google Slides, JPG, PDF, etc so the user will face no issue in saving it in the format of his choice.
-
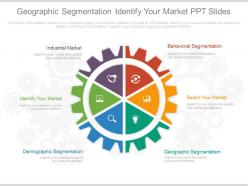 Geographic segmentation identify your market ppt slide
Presenting geographic segmentation identify your market ppt slide. This is a geographic segmentation identify your market ppt slide. This is a six stage process. The stages in this process are industrial market, identify your market, demographic segmentation, geographic segmentation, select your market, behavioral segmentation.
-
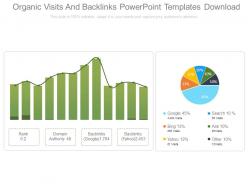 Organic visits and backlinks powerpoint templates download
Presenting organic visits and backlinks powerpoint templates download. This is a organic visits and backlinks powerpoint templates download. This is a six stage process. The stages in this process are rank, domain authority, backlinks, backlinks, yahoo, google, bing, yahoo, search, ask, other.
-
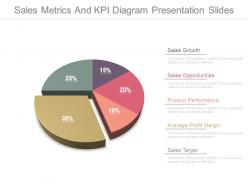 Sales metrics and kpi diagram presentation slides
Presenting sales metrics and kpi diagram presentation slides. This is a sales metrics and kpi diagram presentation slides. This is a five stage process. The stages in this process are sales growth, sales opportunities, product performance, average profit margin, sales target.
-
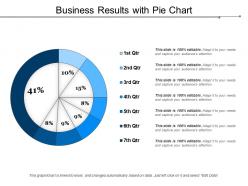 Business results with pie chart
Presenting this set of slides with name - Business Results With Pie Chart. This is a seven stage process. The stages in this process are Business Results, Business Outcomes, Business Output.
-
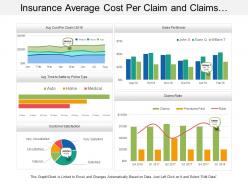 Insurance average cost per claim and claims ratio dashboard
Presenting this set of slides with name - Insurance Average Cost Per Claim And Claims Ratio Dashboard. This is a five stage process. The stages in this process are Assurance, Surety, Insurance.
-
 Lm pie chart with person flat powerpoint design
Presenting lm pie chart with person flat powerpoint design. This Power Point template diagram has been crafted with graphic of pie chart and person diagram. This PPT diagram contains the concept of business result analysis and team work representation. Use this PPT diagram for business and marketing related presentations.
-
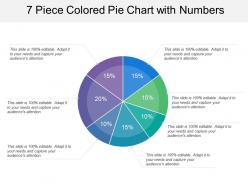 7 piece colored pie chart with numbers
Presenting this set of slides with name - 7 Piece Colored Pie Chart With Numbers. This is a seven stage process. The stages in this process are 6 Piece Pie Chart, 6 Parts Pie Chart, 6 Segment Pie Chart.
-
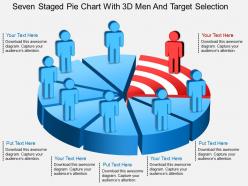 Fu seven staged pie chart with 3d men and target selection powerpoint template
Presenting fu seven staged pie chart with 3d men and target selection powerpoint template. Seven staged pie chart and 3d men has been used to craft this power point template diagram. This PPT diagram contains the concept of target selection. Use this PPT diagram for business and marketing related presentations.
-
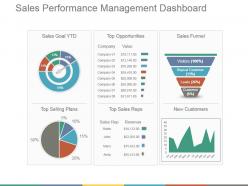 Sales performance management dashboard snapshot ppt background images
Presenting sales performance management dashboard ppt background images. This is a sales performance management dashboard snapshot ppt background images. This is a four stage process. The stages in this process are sales goal ytd, top opportunities, sales funnel, top selling plans, top sales reps, new customers.
-
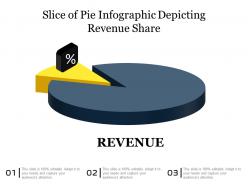 Slice of pie infographic depicting revenue share
Presenting this set of slides with name Slice Of Pie Infographic Depicting Revenue Share. This is a three stage process. The stages in this process are Slice Of Pie Infographic Depicting Revenue Share. This is a completely editable PowerPoint presentation and is available for immediate download. Download now and impress your audience.
-
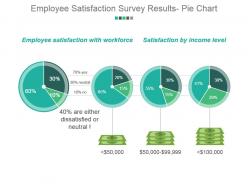 Employee satisfaction survey results pie chart powerpoint presentation examples
Presenting employee satisfaction survey results pie chart powerpoint presentation examples. This is a employee satisfaction survey results pie chart powerpoint presentation examples. This is a four stage process. The stages in this process are employee satisfaction with workforce, satisfaction by income level.
-
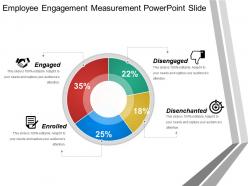 Employee engagement measurement powerpoint slide
Presenting employee engagement measurement PowerPoint slide. This layout is fully compatible with Google slides and data driven. User can edit the data in linked excel sheet and graphs and charts gets customized accordingly. Easy to put in company logo, trademark or name; accommodate words to support the key points. Images do no distort out even when they are projected on large screen. Adjust colors, text and fonts as per your business requirements.
-
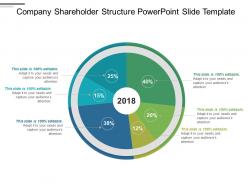 Company shareholder structure powerpoint slide template
Presenting company shareholder structure PowerPoint slide template. This layout is fully compatible with Google slides and data driven. User can edit the data in linked excel sheet and graphs and charts gets customized accordingly. Easy to put in company logo, trademark or name; accommodate words to support the key points. Images do no distort out even when they are projected on large screen. Adjust colors, text and fonts as per your business requirements. Fast downloading speed and formats can be easily changed to JPEG and PDF applications.
-
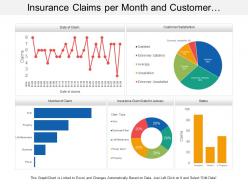 Insurance claims per month and customer satisfaction dashboard
Presenting this set of slides with name - Insurance Claims Per Month And Customer Satisfaction Dashboard. This is a five stage process. The stages in this process are Assurance, Surety, Insurance.
-
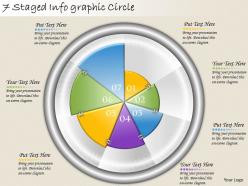 1213 business ppt diagram 7 staged infographic circle powerpoint template
We are proud to present our 1213 business ppt diagram 7 staged infographic circle powerpoint template. Raise the bar with our 1213 Business Ppt diagram 7 Staged Infographic Circle Powerpoint Template. They are programmed to take you to the next level.
-
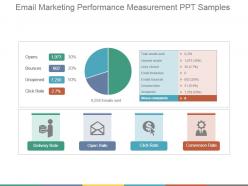 Email marketing performance measurement ppt samples
Presenting email marketing performance measurement ppt samples. This is a email marketing performance measurement ppt samples. This is a three stage process. The stages in this process are opens, bounces, unopened, click rate, delivery rate, open rate, click rate, conversion rate.
-
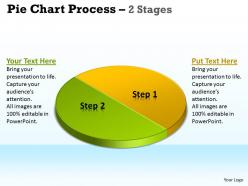 Pie chart process 2 stages 1
This template is skillfully designed and is completely editable to suit all the needs and requirements of the user. The color of the font, its size, style, and all other elements can be customized according to the user's desire The text in the PPT placeholder can be replaced with the desired information making this template highly flexible and adaptable as well. This template is also compatible with various Microsoft versions and formats like Google Slides, JPG, PDF, etc so the user will face no issue in saving it in the format of his choice.
-
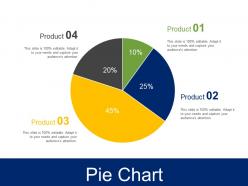 Pie chart ppt infographic template
Presenting pie chart ppt infographic template. This is a pie chart ppt infographic template. This is a four stage process. The stages in this process are chart, percentage, business, marketing, strategy.
-
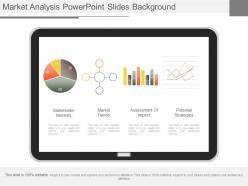 Use market analysis powerpoint slides background
Presenting use market analysis powerpoint slides background. This is a market analysis powerpoint slides background. This is a four stage process. The stages in this process are stakeholder interests, market trends, assessment of impact, potential strategies.
-
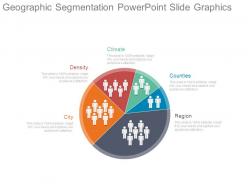 Geographic segmentation powerpoint slide graphics
Presenting geographic segmentation powerpoint slide graphics. This is a geographic segmentation powerpoint slide graphics. This is a five stage process. The stages in this process are city, density, climate, counties, region.
-
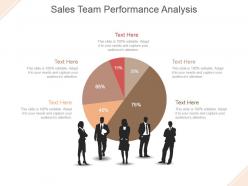 Sales team performance analysis powerpoint slide template
Presenting sales team performance analysis powerpoint slide template. This is a sales team performance analysis powerpoint slide template. This is a five stage process. The stages in this process are pie, finance, people, communication, percentage.
-
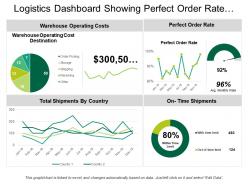 Logistics dashboard showing perfect order rate and on time shipments
Presenting Logistics Dashboard Showing Perfect Order Rate And On Time Shipments PPT slide. The on-time shipments dashboard PowerPoint template designed professionally by the team of SlideTeam to present the record of on time delivery to clients and investors. The different icons such as pie chart, ring, line chart and many other which include text in the perfect order rate dashboard slide are customizable in PowerPoint. A user can illustrate the desired values as the graphical dashboard template get linked with Excel Sheet and it is also compatible with Google Slide. A user can do alteration in the font size, font type, color and dimensions of the line and pie chart to present the desired delivery time.
-
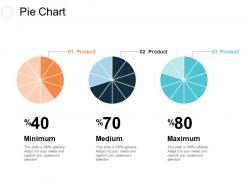 Pie chart ppt slides guidelines
Presenting this set of slides with name - Pie Chart Ppt Slides Guidelines. This is a three stage process. The stages in this process are Business, Management, Strategy, Analysis, Marketing.
-
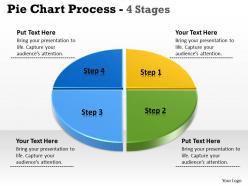 Pie chart 4 stages 5
This template is skillfully designed and is completely editable to suit all the needs and requirements of the user. The color of the font, its size, style, and all other elements can be customized according to the user's desire The text in the PPT placeholder can be replaced with the desired information making this template highly flexible and adaptable as well. This template is also compatible with various Microsoft versions and formats like Google Slides, JPG, PDF, etc so the user will face no issue in saving it in the format of his choice.
-
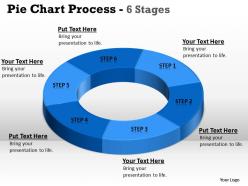 Pie chart process 6 stages 6
This template is skillfully designed and is completely editable to suit all the needs and requirements of the user. The color of the font, its size, style, and all other elements can be customized according to the user's desire The text in the PPT placeholder can be replaced with the desired information making this template highly flexible and adaptable as well. This template is also compatible with various Microsoft versions and formats like Google Slides, JPG, PDF, etc so the user will face no issue in saving it in the format of his choice.
-
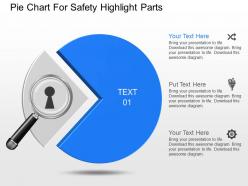 Apt pie chart for safety highlight parts powerpoint template
Presenting apt pie chart for safety highlight parts powerpoint template. This Power Point template diagram has been crafted with graphic of pie chart and icons. This PPT diagram contains the concept of safety highlight parts representation. Use this PPT diagram for business and marketing related presentations.
-
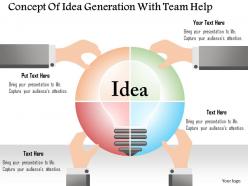 0115 concept of idea generation with team help powerpoint template
Innovative slide design with the concept of idea generation with team help useful for business analysts, market researchers, sales and marketing people, etc. Completely editable content including fonts, text, colors, etc. Compatible with number of software options. Personalize the presentation with individual company name and logo. Excellence in picture quality even on wide screen output. Easy and quick downloading process. Compatible with Google slides. Adaptable PPT designs as can be converted into JPEG and PDF.


