- Sub Categories
-
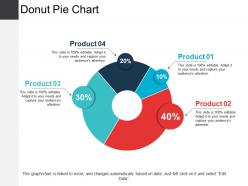 Donut pie chart ppt presentation examples
Presenting Donut Pie Chart PPT Presentation Examples. You can alter the font size, font type, font color, and shape used according to your needs as this PPT layout is 100% customizable. This PowerPoint template is Google Slides compatible and is easily accessible. This easy to download PPT theme can be easily opened and saved in various formats like JPG, PDF, and PNG.
-
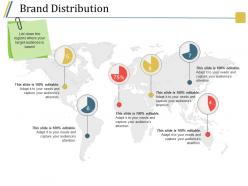 Brand distribution powerpoint show
Presenting brand distribution powerpoint show. This is a brand distribution powerpoint show. This is a six stage process. The stages in this process are pie, location, percentage, map, geographical.
-
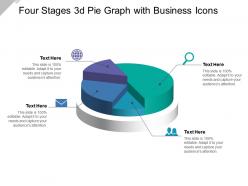 Four stages 3d pie graph with business icons
Presenting this set of slides with name - Four Stages 3d Pie Graph With Business Icons. This is a four stage process. The stages in this process are Paint Brush, Art, Coloring.
-
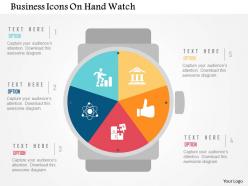 Business icons on hand watch flat powerpoint design
We are proud to present our business icons on hand watch flat powerpoint design. Graphic of business icons and hand watch has been used to design this power point template. This PPT diagram contains the concept of teamwork. Use this PPT diagram for business and marketing related presentations.
-
 Ig data driven pie chart with percentage powerpoint template
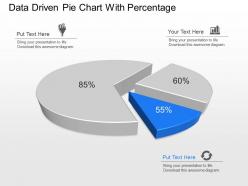
Presenting ig data driven pie chart with percentage powerpoint template. This Power Point template diagram has been crafted with graphic of pie chart and percentage. This PPT diagram contains the concept of data driven result analysis. Use this PPT diagram for business and data related presentations.
-
 Negotiation tactics ppt presentation
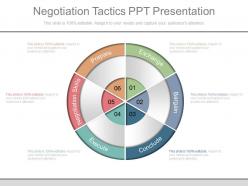
Presenting negotiation tactics ppt presentation. This is a negotiation tactics ppt presentation. This is a six stage process. The stages in this process are exchange, bargain, conclude, execute, negotiation skills, prepare.
-
 Ppt corporate strategy business illustration ppt samples
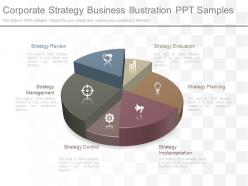
This PPT Template can be used by any organization’s executives for representing corporate strategies related presentations. All these images are 100% edited in terms of color, size and orientation of the elements mentioned in the slides. These PPT slides are compatible with Google slides and can be edited in any PowerPoint software. The stages in this proces are strategy evaluation, strategy planning, strategy implementation, strategy control, strategy management, strategy review.
-
 Marketing ethnography blue ocean strategy weaknesses strengths ratings opinions cpb
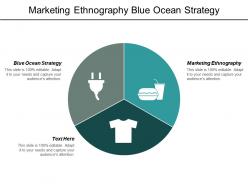
Presenting this set of slides with name - Marketing Ethnography Blue Ocean Strategy Weaknesses Strengths Ratings Opinions Cpb. This is an editable three stages graphic that deals with topics like Marketing Ethnography, Blue Ocean Strategy, Weaknesses Strengths, Ratings Opinions to help convey your message better graphically. This product is a premium product available for immediate download, and is 100 percent editable in Powerpoint. Download this now and use it in your presentations to impress your audience.
-
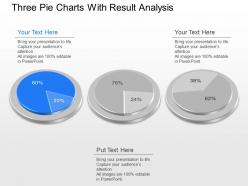 Jo three pie charts with result analysis powerpoint template
Presenting jo three pie charts with result analysis powerpoint template. Graphic of three pie charts has been used to design this power point template diagram. This PPT diagram has been contains the concept of business result analysis. Use this PPT diagram for business and marketing related presentations.
-
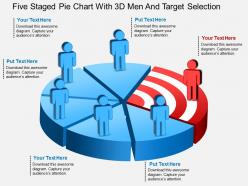 Ex five staged pie chart with 3d men and target selection powerpoint template
Presenting ex five staged pie chart with 3d men and target selection powerpoint template. Five staged pie chart and 3d men diagram has been used to craft this power point template diagram. This PPT diagram contains the concept of business target selection representation. Use this PPT diagram for business and marketing related presentations.
-
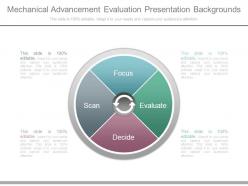 Mechanical advancement evaluation presentation backgrounds
Presenting mechanical advancement evaluation presentation backgrounds. This is a mechanical advancement evaluation presentation backgrounds. This is a four stage process. The stages in this process are focus, evaluate, decide, scan.
-
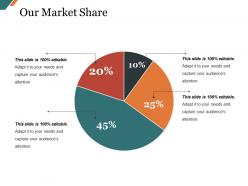 Our market share presentation pictures
Presenting this set of slides with name - Our Market Share Presentation Pictures. This is a four stage process. The stages in this process are Pie, Percentage, Finance, Chart, Planning.
-
 Segmentation pie chart with people icon
Presenting this set of slides with name - Segmentation Pie Chart With People Icon. This is a two stage process. The stages in this process are Segmentation Icon, Division Icon, Partitioning Icon.
-
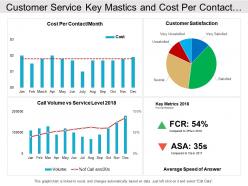 Customer service key mastics and cost per contact dashboard
Introducing customer service key mastics and cost per contact dashboard PowerPoint design. This template design is fully compatible with Google Slide. You can modify the color, text style, font size of the template as per requirement. The slide is simple to download and can be saved in PDF, and JPEG formats. Additional instructional slides are provided for guidance. Best quality graphics are employed. The graphics of the slide does not distort when projected on a large screen. Content can be added with other valuable data. You can personalize the template by adding your organization name, and copyright.
-
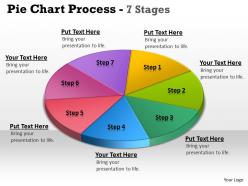 Pie chart process 7 stages 7
This template is skillfully designed and is completely editable to suit all the needs and requirements of the user. The color of the font, its size, style, and all other elements can be customized according to the user's desire The text in the PPT placeholder can be replaced with the desired information making this template highly flexible and adaptable as well. This template is also compatible with various Microsoft versions and formats like Google Slides, JPG, PDF, etc so the user will face no issue in saving it in the format of his choice.
-
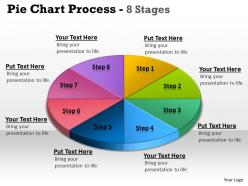 Pie chart process 8 stages 5
This template is skillfully designed and is completely editable to suit all the needs and requirements of the user. The color of the font, its size, style, and all other elements can be customized according to the user's desire The text in the PPT placeholder can be replaced with the desired information making this template highly flexible and adaptable as well. This template is also compatible with various Microsoft versions and formats like Google Slides, JPG, PDF, etc so the user will face no issue in saving it in the format of his choice.
-
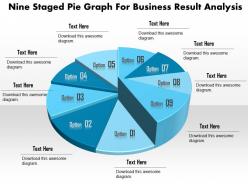 1114 nine staged pie graph for business result analysis powerpoint template
We are proud to present our 1114 nine staged pie graph for business result analysis powerpoint template. Nine staged pie graph has been used to decorate this power point template slide. This PPT slide has been specially designed for data and result analysis. Use this PPT slide for your business and finance presentations.
-
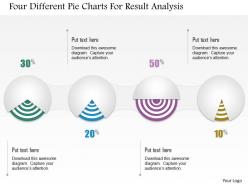 1214 four different pie charts for result analysis powerpoint template
We are proud to present our 1214 four different pie charts for result analysis powerpoint template. This power point template slide has been designed with graphic of four different pie charts. This pie charts are designed to show data representation and result analysis. Display your business data with this PPT slide any presentations.
-
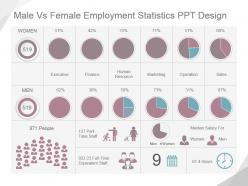 Male vs female employment statistics ppt design
Presenting male vs female employment statistics ppt design. This is a male vs female employment statistics ppt design. This is a two stage process. The stages in this process are women, men, executive, finance, human resource, marketing, operation, sales, people, part time staff, full time equivalent staff, median salary for, hours.
-
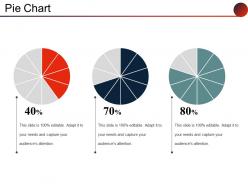 Pie chart powerpoint slide backgrounds
Presenting this Pie Chart PowerPoint Slide Backgrounds PowerPoint presentation. The PPT can be downloaded and saved in common images or document formats like JPEG and PDF. The PPT supports both the standard(4:3) and widescreen(16:9) sizes. It is compatible with Google Slides and other related software. Alter the style, size, and the background of the slides. High-quality graphics ensure that distortion does not occur.
-
 Growth showing pie chart in circle icon
Presenting growth showing pie chart in circle icon. This is a growth showing pie chart in circle icon. This is a three stage process. The stages in this process are growth icons, improvement icons, enhancement icons.
-
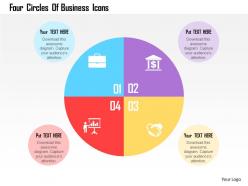 Four circles of business icons flat powerpoint design
We are proud to present our four circles of business icons flat powerpoint design. Four sectioned circle has been used to design this power point diagram. This PPT diagram contains the different business icons. Use this PPT for business and marketing related presentations.
-
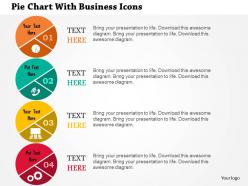 Pie chart with business icons flat powerpoint design
We are proud to present our pie chart with business icons flat powerpoint design. This power point template diagram has been crafted with graphic of pie chart and business icons. This PPT diagram contains the concept of representing business information. Use this PPT diagram for business presentations.
-
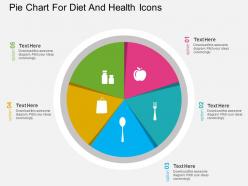 Ln pie chart for diet and health icons flat powerpoint design
Presenting ln pie chart for diet and health icons flat powerpoint design. This Power Point template diagram has been crafted with graphic of pie chart and icons diagram. This PPT diagram contains the concept of business result analysis. Use this PPT diagram for business and marketing related presentations.
-
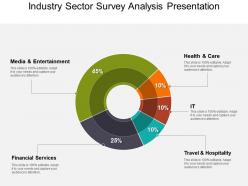 Industry sector survey analysis presentation powerpoint templates
Presenting industry sector survey analysis presentation PowerPoint template PPT slide. The template has a high-definition editable slide. It contains colorful flat design infographics, clipart, and shapes. Moreover, the shapes, charts, and icons are also changeable. The industry analysis graphic is ideal for MBA students who require pre-designed thoroughly editable PPT slide for their numerous presentations. Also, the business consultants and analysts can make use of it to present their research and findings to the executive class audience for making smart decisions. Also, the slide is compatible with multiple software and format options too.
-
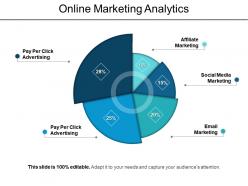 Online marketing analytics ppt design templates
Presenting a slide named Online Marketing Analytics PPT Design Templates. Customize the font color, font style, and font size. You can resize and reshape the icon as per your requirement. Change the color of the background. Export this slide anywhere as it is compatibility with Google Slides. Convert and save this template as PDF or JPG formats. Download it in standard and widescreen size. This slide is data-driven and can be linked to Excel sheet.
-
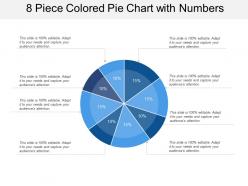 8 piece colored pie chart with numbers
Presenting this set of slides with name - 8 Piece Colored Pie Chart With Numbers. This is a eight stage process. The stages in this process are 6 Piece Pie Chart, 6 Parts Pie Chart, 6 Segment Pie Chart.
-
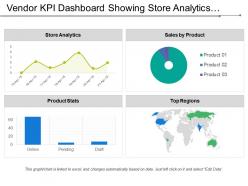 Vendor kpi dashboard showing store analytics sales by product and product stats
Presenting this set of slides with name - Vendor Kpi Dashboard Showing Store Analytics Sales By Product And Product Stats. This is a four stage process. The stages in this process are Vendor, Supplier, Retailer.
-
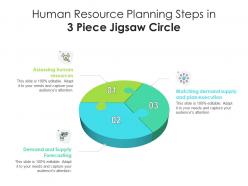 Human resource planning steps in 3 piece jigsaw circle
Presenting our set of slides with name Human Resource Planning Steps In 3 Piece Jigsaw Circle. This exhibits information on three stages of the process. This is an easy-to-edit and innovatively designed PowerPoint template. So download immediately and highlight information on Resource, Planning, Circle.
-
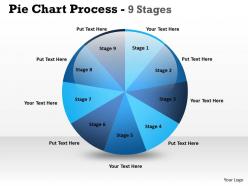 Pie chart process 9 stages 5
This template is skillfully designed and is completely editable to suit all the needs and requirements of the user. The color of the font, its size, style, and all other elements can be customized according to the user's desire The text in the PPT placeholder can be replaced with the desired information making this template highly flexible and adaptable as well. This template is also compatible with various Microsoft versions and formats like Google Slides, JPG, PDF, etc so the user will face no issue in saving it in the format of his choice.
-
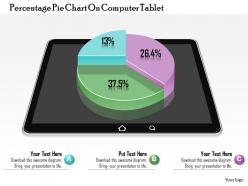 0814 business consulting diagram percentage pie chart on computer tablet powerpoint slide template
We are proud to present our 0814 business consulting diagram percentage pie chart on computer tablet powerpoint slide template. This image slide displays business consulting diagram of percentage pie chart on computer tablet. This image has been made with 3d colorful graphic of pie chart on black tablet. Use this PowerPoint template, in your presentations to express various views like growth, achievements, success in business. This image slide will make your presentations outshine.
-
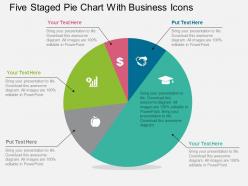 Five staged pie chart with business icons flat powerpoint design
We are proud to present our five staged pie chart with business icons flat powerpoint design. Graphic of five staged pie chart and icons has been used to design this power point template diagram. This PPT diagram contains the concept of business data representation and result analysis. Use this PPT diagram for business and marketing related presentations.
-
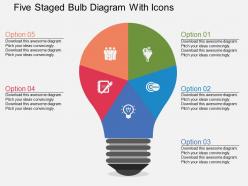 Five staged bulb diagram with icons flat powerpoint desgin
We are proud to present our five staged bulb diagram with icons flat powerpoint desgin. Five staged bulb diagram with icons has been used to design this power point template diagram. This PPT diagram contains the concept of idea generation. This PPT diagram is suitable for business and finance related presentations.
-
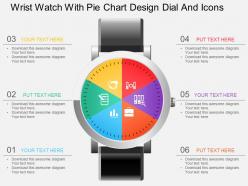 Hp wrist watch with pie chart design dial and icons powerpoint template
We are proud to present our hp wrist watch with pie chart design dial and icons powerpoint template. Graphic of wrist watch and pie chart design dial with icons has been used to design this power point template diagram. This PPT diagram contains the concept of service and repair with time management .Use this PPT diagram for business and technology related presentations.
-
 Zo three parts 3d pie chart with business icons powerpoint template
We are proud to present our zo three parts 3d pie chart with business icons powerpoint template. Graphic of three parts and 3d pie charts with business icons has been used to craft this power point template diagram. This PPT diagram contains the concept of result analysis. Use this PPT diagram and build quality presentation for viewers.
-
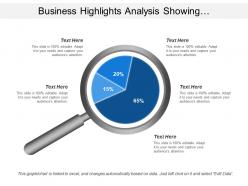 Business highlights analysis showing magnifying glass with options
Presenting this set of slides with name - Business Highlights Analysis Showing Magnifying Glass With Options. This is a five stage process. The stages in this process are Highlights, High Point, High Spot.
-
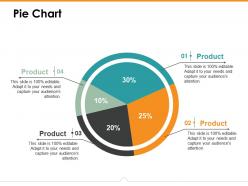 Pie chart ppt icon example introduction
This is a four stage process. The stage in this process are Business, Management, Marketing, Sales, Strategy.
-
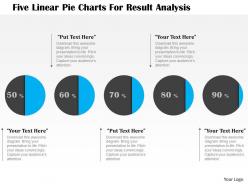 1214 five linear pie charts for result analysis powerpoint template
We are proud to present our 1214 five linear pie charts for result analysis powerpoint template. This Power Point template has been designed with graphic of five linear pie charts. These charts are used to show the result analysis. Use this PPT for your business and marketing related presentations.
-
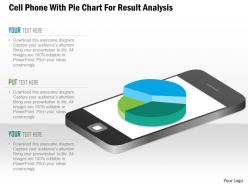 1114 cell phone with pie chart for result analysis presentation template
We are proud to present our 1114 cell phone with pie chart for result analysis presentation template. This Power Point template has been crafted with graphic of cell phones and pie chart. This PPT is specially designed with concept of result analysis. Use this PPT for your business and finance result based topics and display complete analysis in your presentation.
-
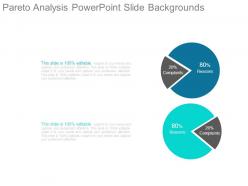 Pareto analysis powerpoint slide backgrounds
Presenting pareto analysis powerpoint slide backgrounds. This is a pareto analysis powerpoint slide backgrounds. This is a two stage process. The stages in this process are complaints, reasons.
-
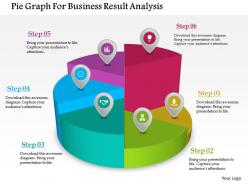 Pie graph for business result analysis powerpoint template
We are proud to present our pie graph for business result analysis powerpoint template. Concept of result analysis has been represented in this power point template diagram. This PPT diagram contains the graphic of pie graph. Use this PPT diagram for business and marketing related presentations.
-
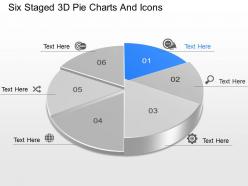 Pi six staged 3d pie charts and icons powerpoint template
Presenting pi six staged 3d pie charts and icons powerpoint template. Six staged3d pie charts diagram and icons has been used to craft this power point template diagram. This PPT diagram contains the concept of result analysis representation. Use this PPT diagram for business and marketing related presentations.
-
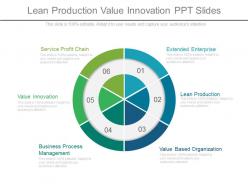 Lean production value innovation ppt slides
Presenting lean production value innovation ppt slides. This is a lean production value innovation ppt slides. This is a six stage process. The stages in this process are business, finance, strategy.
-
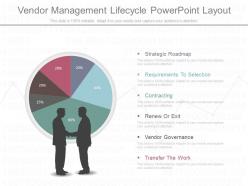 Present vendor management lifecycle powerpoint layout
Presenting present vendor management lifecycle powerpoint layout. This is a vendor management lifecycle powerpoint layout. This is a six stage process. The stages in this process are strategic roadmap, requirements to selection, contracting, renew or exit, vendor governance, transfer the work.
-
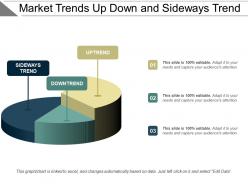 Market trends up down and sideways trend
Presenting Market Trends Up Down And Sideways Trend template. The slide is compatible with Google Slides which makes it accessible at once. The slide is completely editable. It can be saved in various document formats such as JPEG, PNG, or PDF. Moreover, both standard screen(4:3) and widescreen(16:9) aspect ratios are supported. High-quality graphics ensure that distortion does not occur.
-
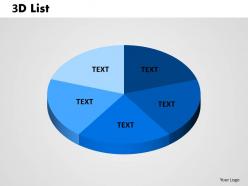 3d list pie 2
This template is skillfully designed and is completely editable to suit all the needs and requirements of the user. The color of the font, its size, style, and all other elements can be customized according to the user's desire The text in the PPT placeholder can be replaced with the desired information making this template highly flexible and adaptable as well. This template is also compatible with various Microsoft versions and formats like Google Slides, JPG, PDF, etc so the user will face no issue in saving it in the format of his choice.
-
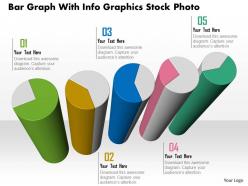 1114 bar graph with infographics presentation template
We are proud to present our 1114 bar graph with infographics presentation template. Graphic of bar graph with info graphics has been used to decorate this power point template. This power point template contains the concept of business data representation. Use this PPT for your business and finance data related presentations.
-
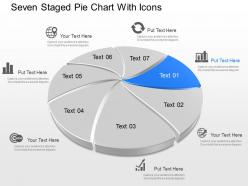 Ze seven staged pie chart with icons powerpoint template
We are proud to present our ze seven staged pie chart with icons powerpoint template. Seven staged pie chart diagram with icons has been used to design this power point template diagram. This PPT diagram contains the concept of business result analysis representation. This PPT diagram is suitable for business and marketing related presentations.
-
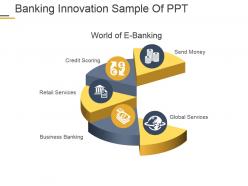 Banking innovation sample of ppt
Presenting banking innovation sample of ppt. This is a banking innovation sample of ppt. This is a five stage process. The stages in this process are world of e banking, credit scoring, retail services, business banking, global services, send money.
-
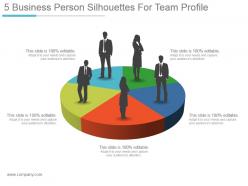 5 business person silhouettes for team profile sample ppt presentation
Presenting 5 business person silhouettes for team profile sample ppt presentation. This is a 5 business person silhouettes for team profile sample ppt presentation. This is a five stage process. The stages in this process are silhouettes, management, communication, business, marketing.
-
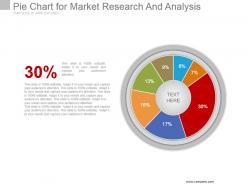 Pie chart for market research and analysis powerpoint ideas
Presenting pie chart for market research and analysis powerpoint ideas. This is a pie chart for market research and analysis powerpoint ideas. This is a seven stage process. The stages in this process are pie chart, percentage, analysis, marketing, strategy, business, success.
-
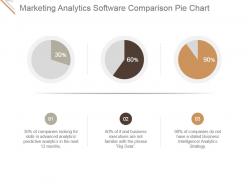 Marketing analytics software comparison pie chart powerpoint images
Presenting marketing analytics software comparison pie chart powerpoint images. This is a marketing analytics software comparison pie chart powerpoint images. This is a three stage process. The stages in this process are marketing, analysis, measure, pie chart, comparison.
-
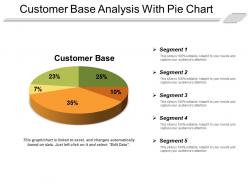 Customer base analysis with pie chart
Presenting customer base analysis with pie chart. This is a customer base analysis with pie chart. This is a five stage process. The stages in this process are customer base, recurring customers, customer services.
-
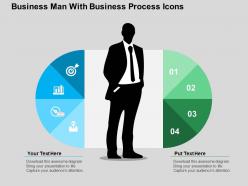 Business man with business process icons flat powerpoint design
We are proud to present our business man with business process icons flat powerpoint design. This power point template diagram has been crafted with graphic of business man and business process icons. This PPT diagram contains the concept of business process flow. Use this PPT diagram for business and finance related presentations.
-
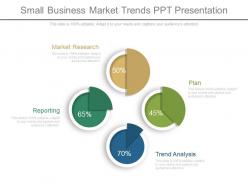 Small business market trends ppt presentation
Presenting small business market trends ppt presentation. This is a small business market trends ppt presentation. This is a four stage process. The stages in this process are market research, plan, trend analysis, reporting.
-
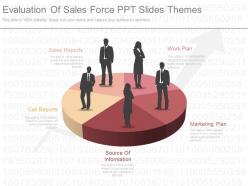 Evaluation of sales force ppt slides themes
Presenting evaluation of sales force ppt slides themes. This is a evaluation of sales force ppt slides themes. This is a five stage process. The stages in this process are sales reports, work plan, marketing plan, source of information, call reports.
-
 A communication objectives sales objectives ppt images
Presenting a communication objectives sales objectives ppt images. This is a communication objectives sales objectives ppt images. This is a six stage process. The stages in this process are communication objectives, objectives setting, percentage of sales, budget decisions, sales objectives, major decision in advertising.
-
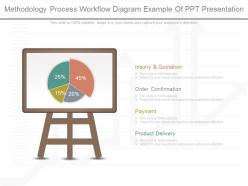 Pptx methodology process workflow diagram example of ppt presentation
Presenting pptx methodology process workflow diagram example of ppt presentation. This is a methodology process workflow diagram example of ppt presentation. This is a four stage process. The stages in this process are inquiry and quotation, order confirmation, payment, product delivery.
-
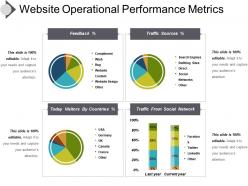 Website operational performance metrics presentation powerpoint
Presenting, website operational performance metrics presentation PowerPoint. This PowerPoint presentation is fully customizable; allowing you to edit the color patterns, text, and icons shown here. This PPT slide is free of space constraints to mention titles and subtitles. Include your company logo here in the PPT to personalize further. The colors of the elements shown in the diagram can be changed according to your liking. This PPT layout is available in both standard 4:3 and widescreen format 16:9 after downloading. This PPT slide is compatible with Google slides and can be edited in any PowerPoint software. Download this PowerPoint deck in a snap and explore full features.
-
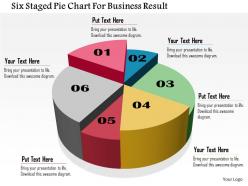 Bo six staged pie chart for business result powerpoint templets
We are proud to present our bo six staged pie chart for business result powerpoint templets. Six staged vertical timeline diagram has been used to craft this power point template. This PPT contains the concept of business result analysis and milestone achievement representation. Use this PPT for business and marketing related presentations.


