Ebitda And Margin Software Company Financial Summary Report Ppt Infographics
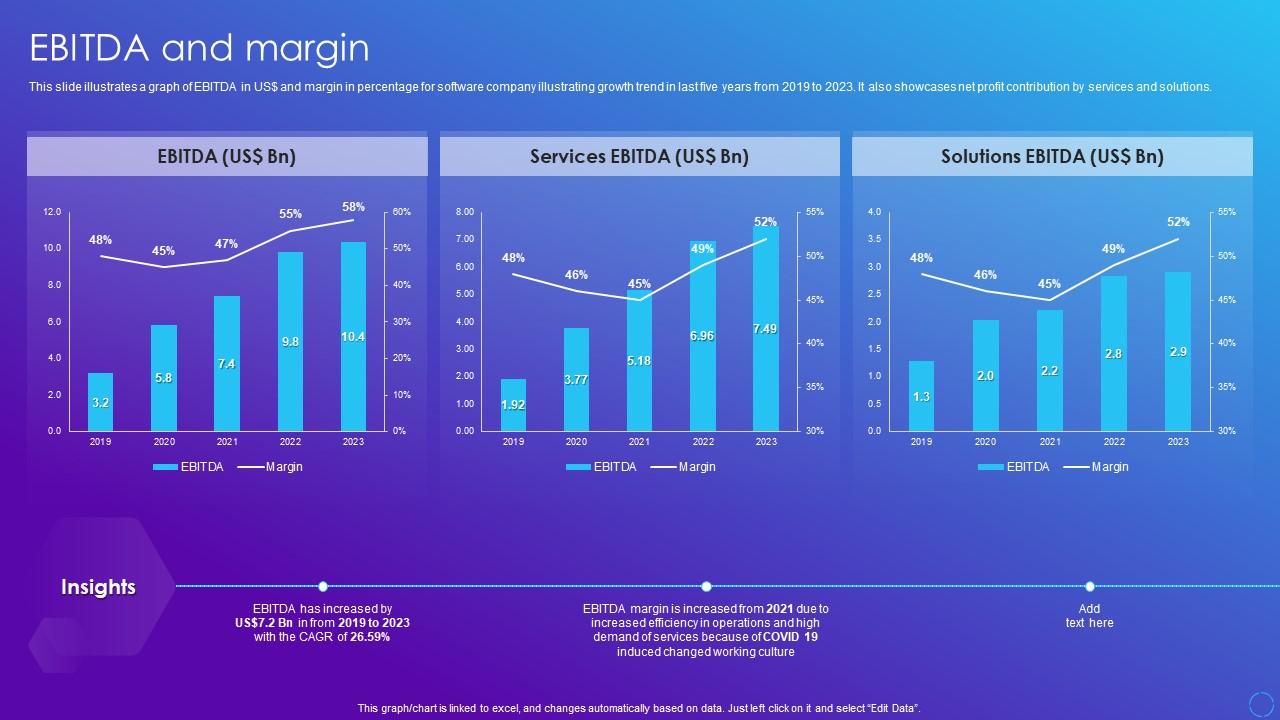
This slide illustrates a graph of EBITDA in US doller and margin in percentage for software company illustrating growth trend in last five years from 2019 to 2023. It also showcases net profit contribution by services and solutions.
This slide illustrates a graph of EBITDA in US doller and margin in percentage for software company illustrating growth tre..
- Google Slides is a new FREE Presentation software from Google.
- All our content is 100% compatible with Google Slides.
- Just download our designs, and upload them to Google Slides and they will work automatically.
- Amaze your audience with SlideTeam and Google Slides.
-
Want Changes to This PPT Slide? Check out our Presentation Design Services
- WideScreen Aspect ratio is becoming a very popular format. When you download this product, the downloaded ZIP will contain this product in both standard and widescreen format.
-

- Some older products that we have may only be in standard format, but they can easily be converted to widescreen.
- To do this, please open the SlideTeam product in Powerpoint, and go to
- Design ( On the top bar) -> Page Setup -> and select "On-screen Show (16:9)” in the drop down for "Slides Sized for".
- The slide or theme will change to widescreen, and all graphics will adjust automatically. You can similarly convert our content to any other desired screen aspect ratio.
Compatible With Google Slides

Get This In WideScreen
You must be logged in to download this presentation.
PowerPoint presentation slides
This slide illustrates a graph of EBITDA in US doller and margin in percentage for software company illustrating growth trend in last five years from 2019 to 2023. It also showcases net profit contribution by services and solutions. Present the topic in a bit more detail with this Ebitda And Margin Software Company Financial Summary Report Ppt Infographics. Use it as a tool for discussion and navigation on Services Ebitda, Solutions Ebitda, Margin. This template is free to edit as deemed fit for your organization. Therefore download it now.
People who downloaded this PowerPoint presentation also viewed the following :
Ebitda And Margin Software Company Financial Summary Report Ppt Infographics with all 7 slides:
Use our Ebitda And Margin Software Company Financial Summary Report Ppt Infographics to effectively help you save your valuable time. They are readymade to fit into any presentation structure.
-
It makes easy work of my work presentations. I’ve never had to be nervous about my presentations for meetings.
-
The ease of modifying templates is just superb! Also, the vast collection offers plenty of options to choose from.


