Employee satisfaction by income level doughnut chart ppt slide
Give a glowing account with our Employee Satisfaction By Income Level Doughnut Chart Ppt Slide. Your thoughts will acquire a lot of gloss.
Give a glowing account with our Employee Satisfaction By Income Level Doughnut Chart Ppt Slide. Your thoughts will acquire ..
- Google Slides is a new FREE Presentation software from Google.
- All our content is 100% compatible with Google Slides.
- Just download our designs, and upload them to Google Slides and they will work automatically.
- Amaze your audience with SlideTeam and Google Slides.
-
Want Changes to This PPT Slide? Check out our Presentation Design Services
- WideScreen Aspect ratio is becoming a very popular format. When you download this product, the downloaded ZIP will contain this product in both standard and widescreen format.
-

- Some older products that we have may only be in standard format, but they can easily be converted to widescreen.
- To do this, please open the SlideTeam product in Powerpoint, and go to
- Design ( On the top bar) -> Page Setup -> and select "On-screen Show (16:9)” in the drop down for "Slides Sized for".
- The slide or theme will change to widescreen, and all graphics will adjust automatically. You can similarly convert our content to any other desired screen aspect ratio.
Compatible With Google Slides

Get This In WideScreen
You must be logged in to download this presentation.
PowerPoint presentation slides
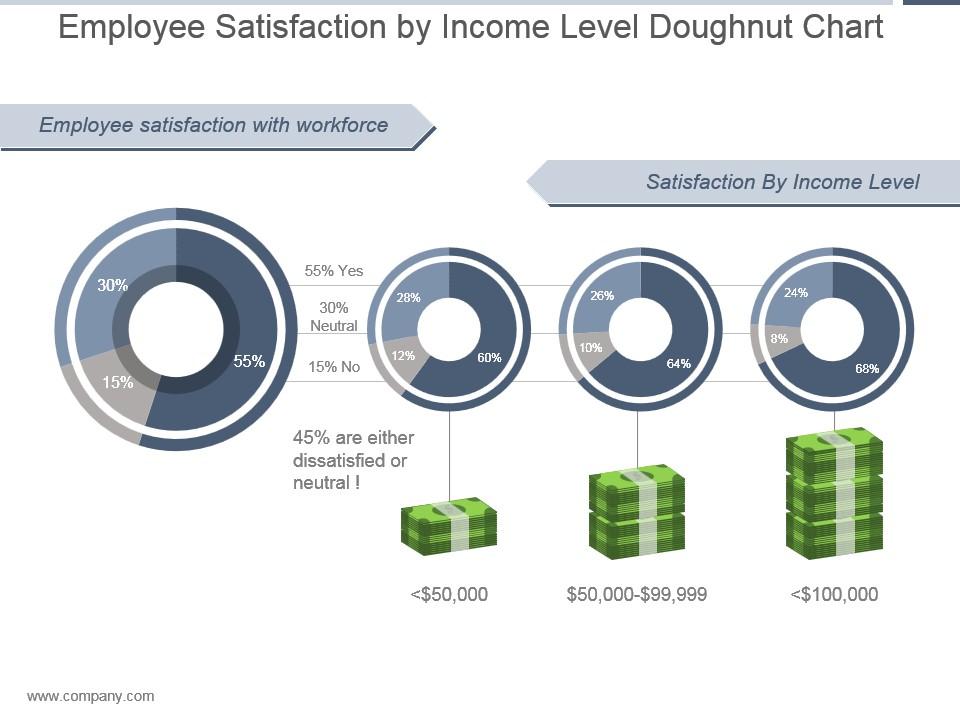
Presenting employee satisfaction by income level doughnut chart ppt slide. This is a employee satisfaction by income level doughnut chart ppt slide. This is a four stage process. The stages in this process are employee satisfaction with workforce, satisfaction by income level, 55 percent yes, neutral, 15 percent no, 45 percent are either dissatisfied or neutral.
People who downloaded this PowerPoint presentation also viewed the following :
Employee satisfaction by income level doughnut chart ppt slide with all 5 slides:
Pamper your urges with our Employee Satisfaction By Income Level Doughnut Chart Ppt Slide. Let your creative juices start to flow.
-
Great product with effective design. Helped a lot in our corporate presentations. Easy to edit and stunning visuals.
-
Innovative and attractive designs.


