Executive summary outsourcing proposal powerpoint presentation slides
Building the right executive summary for outsourcing PowerPoint presentation now will be very easy. The only thing that you must do here is to click and download our professionally Executive summary ppt. With help of our outsourcing executive summary PPT slide show, you can show mission and vision of the company along with the agenda of the meeting to your work force for developing better understanding about the company. You can develop a sense of continuous improvement attitude among your sales team by showcasing the problems and bottlenecks using this 79 slides readymade presentation as this PPT deck has slides like executive dashboard, sales dashboard, financial dashboard, target market, target market share, key potential customers, customer growth matrix, area of focus Going further, this management summary PPT sample presentation file also supports to encourage work force to develop strategic sales plan to augment sales and develop strong networks as this deck has unique selling proposition, expansion of value proposition, feedbacks, potential price and profit margins slides too. To thoroughly cover each aspect a great proposal, we have included creative executive summary business plan PowerPoint presentation slides like product sales volume, critical areas, problems and bottlenecks, action plan, desired outcome, potential solutions and various charts like clustered column, bar, bubble chart, stacked line, filled radar etc. In short, you have got the best outsourcing sample PPT model. Now is the time to click and download this professional management Summary Outsourcing plan presentation deck. Cast a line with our Executive Summary Outsourcing Proposal Powerpoint Presentation Slides. Your team will start nibbling at your brains.
Building the right executive summary for outsourcing PowerPoint presentation now will be very easy. The only thing that you..
- Google Slides is a new FREE Presentation software from Google.
- All our content is 100% compatible with Google Slides.
- Just download our designs, and upload them to Google Slides and they will work automatically.
- Amaze your audience with SlideTeam and Google Slides.
-
Want Changes to This PPT Slide? Check out our Presentation Design Services
- WideScreen Aspect ratio is becoming a very popular format. When you download this product, the downloaded ZIP will contain this product in both standard and widescreen format.
-

- Some older products that we have may only be in standard format, but they can easily be converted to widescreen.
- To do this, please open the SlideTeam product in Powerpoint, and go to
- Design ( On the top bar) -> Page Setup -> and select "On-screen Show (16:9)” in the drop down for "Slides Sized for".
- The slide or theme will change to widescreen, and all graphics will adjust automatically. You can similarly convert our content to any other desired screen aspect ratio.
Compatible With Google Slides

Get This In WideScreen
You must be logged in to download this presentation.
PowerPoint presentation slides
Presenting Executive Summary Outsourcing Proposal PPT with a set of 79 slides to show your mastery of the subject. Use this ready-made PowerPoint presentation to present before your internal teams or the audience. All presentation designs in this deck have been crafted by our team of expert PowerPoint designers using the best of PPT templates, images, data-driven graphs and vector icons. The content has been well-researched by our team of business researchers. The biggest advantage of downloading this deck is that it is fully editable in PowerPoint. You can change the colors, font and text without any hassle to suit your business needs.
People who downloaded this PowerPoint presentation also viewed the following :
Content of this Powerpoint Presentation
Slide 1: This slide introduces Executive Summary Outsourcing Proposal with your company name.
Slide 2: This is a company Agenda slide. State it here.
Slide 3: This slide states company Mission. The contents of the slide can be changed/ altered as per need.
Slide 4: This slide states Vision Of The Company with text boxes to be filled as required.
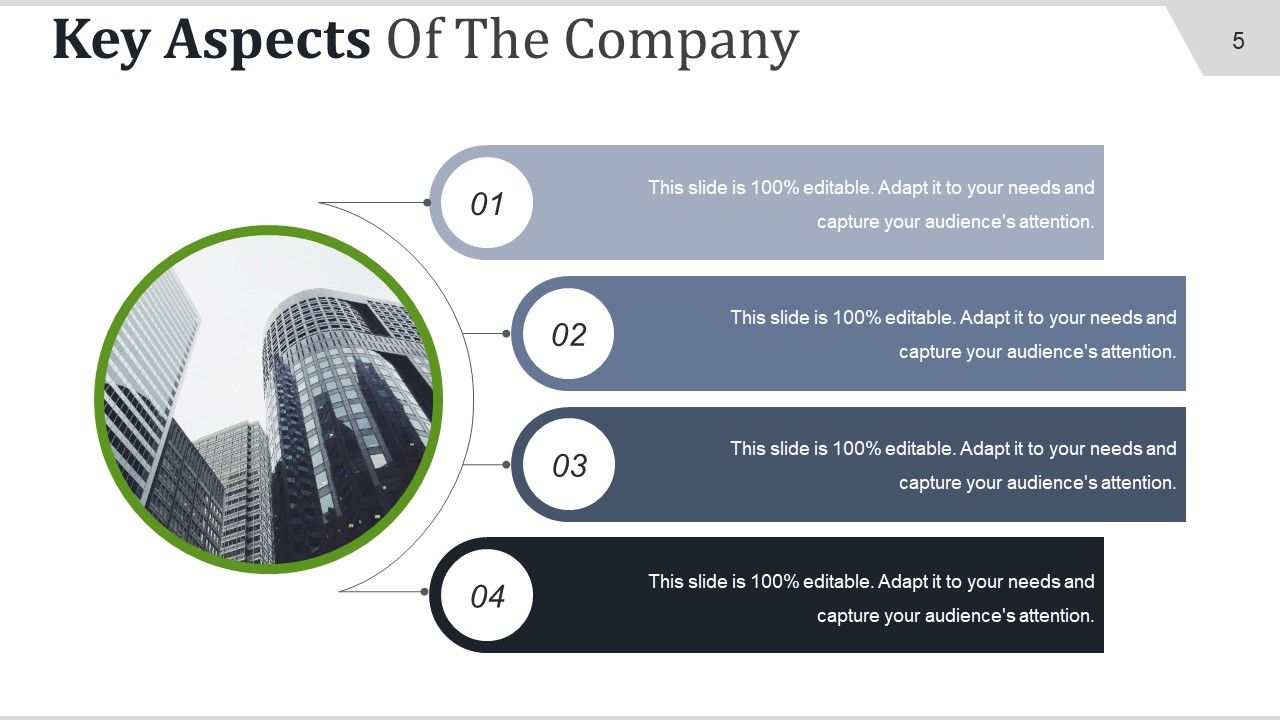
Slide 5: This slide states Key Aspects Of The Company with image and text boxes.
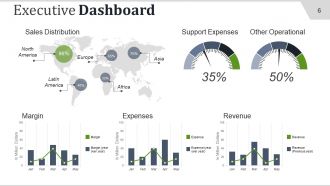
Slide 6: This slide showcases Executive Dashboard on a world map image and bar graph.
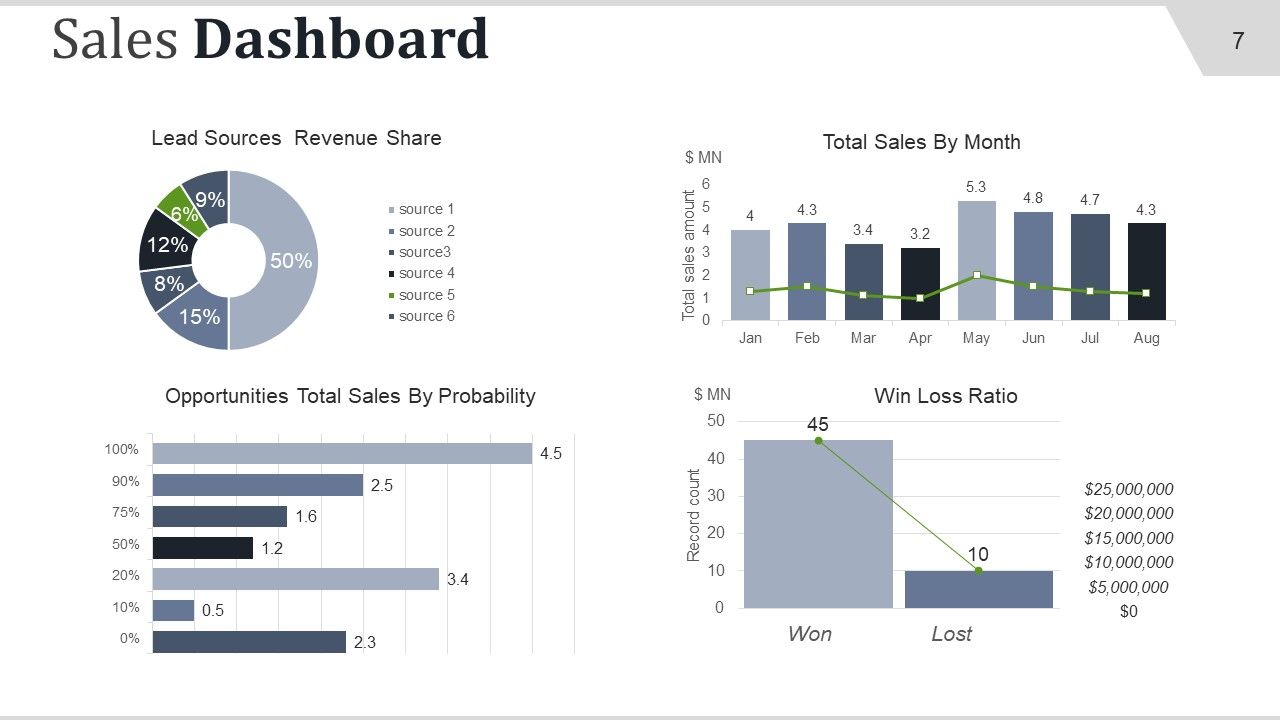
Slide 7: This is another Sales Dashboard slide.
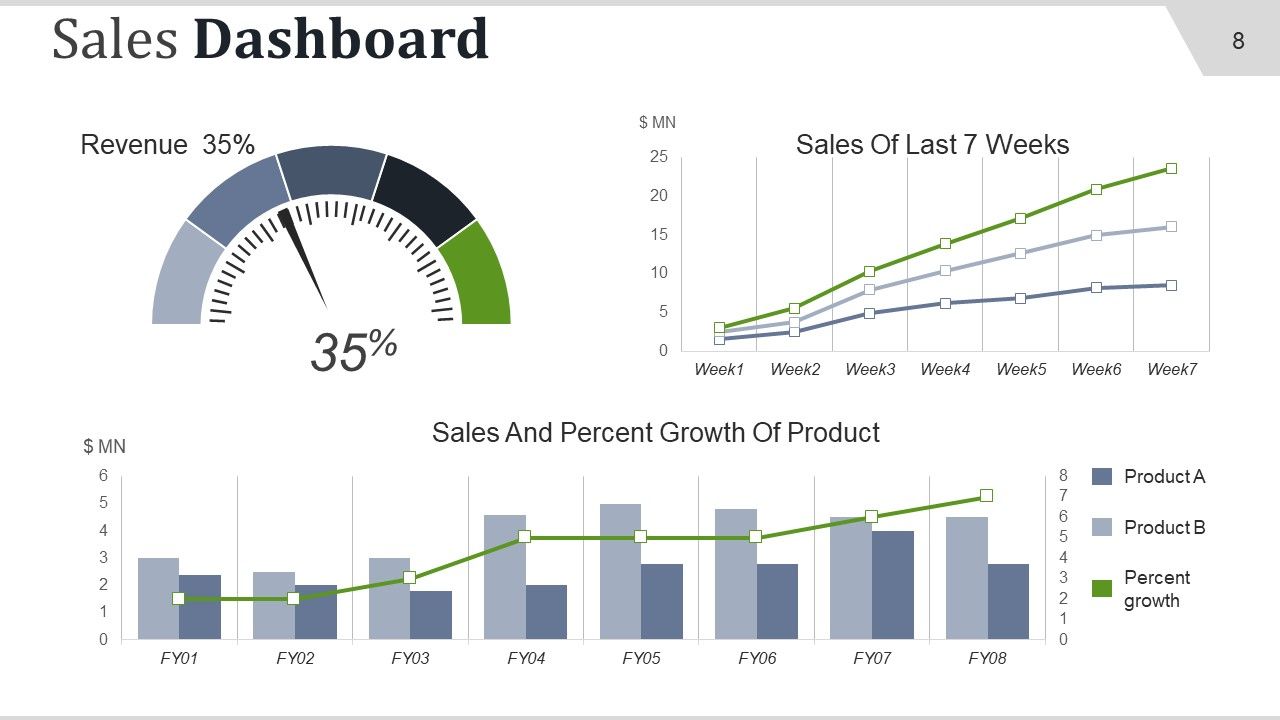
Slide 8: This too is a Sales Dashboard slide.
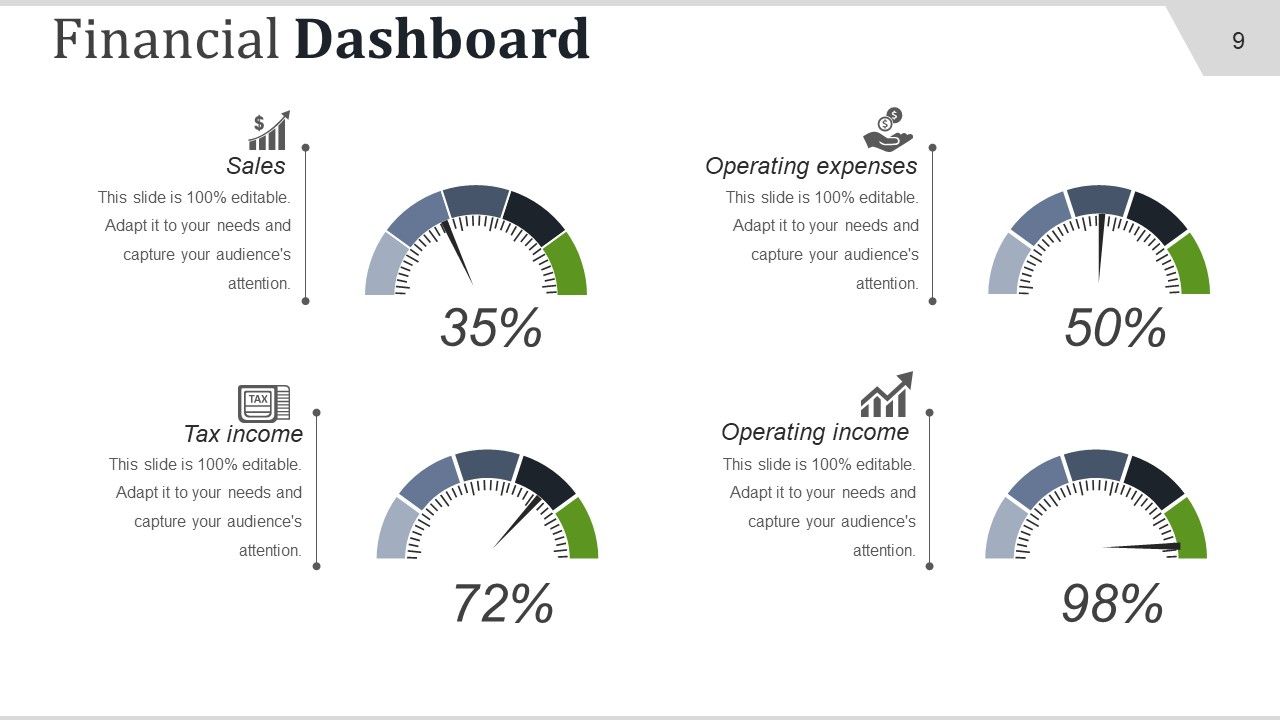
Slide 9: This is a Financial Dashboard slide showcasing- Operating expenses, Operating income, Tax income, Sales.
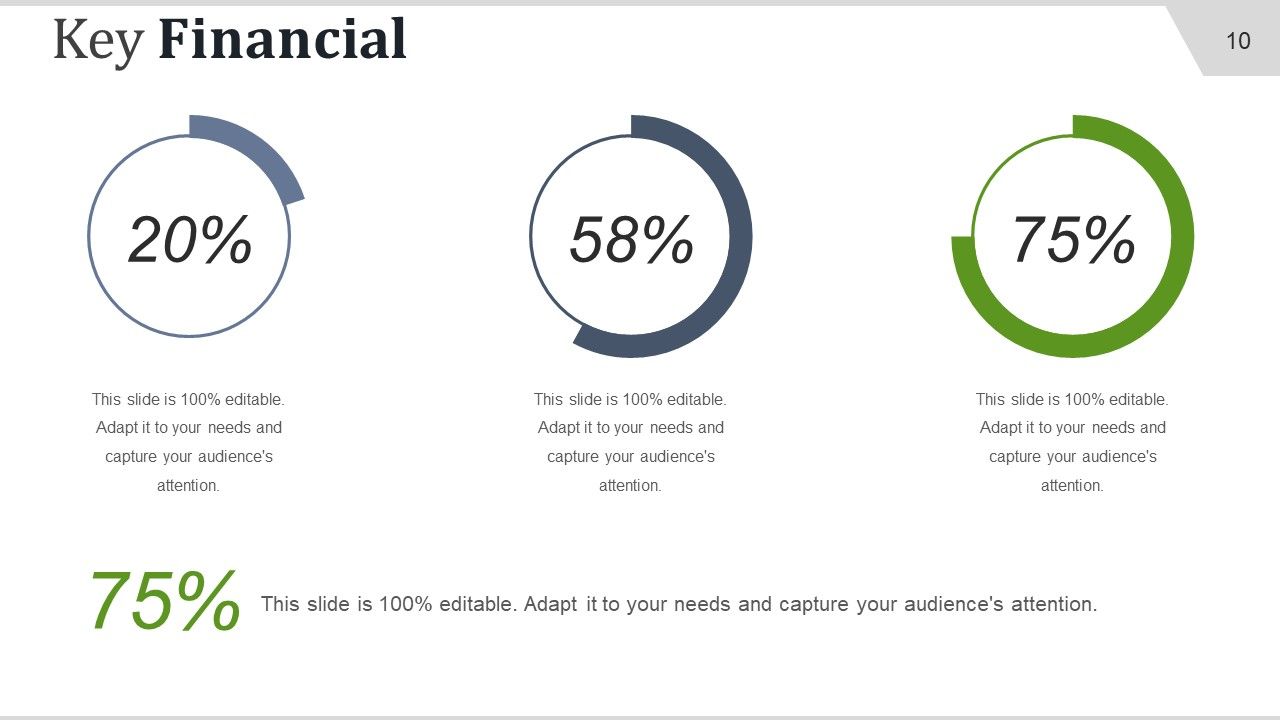
Slide 10: This is Key Financial slide showcasing finacial scores, aspects etc.
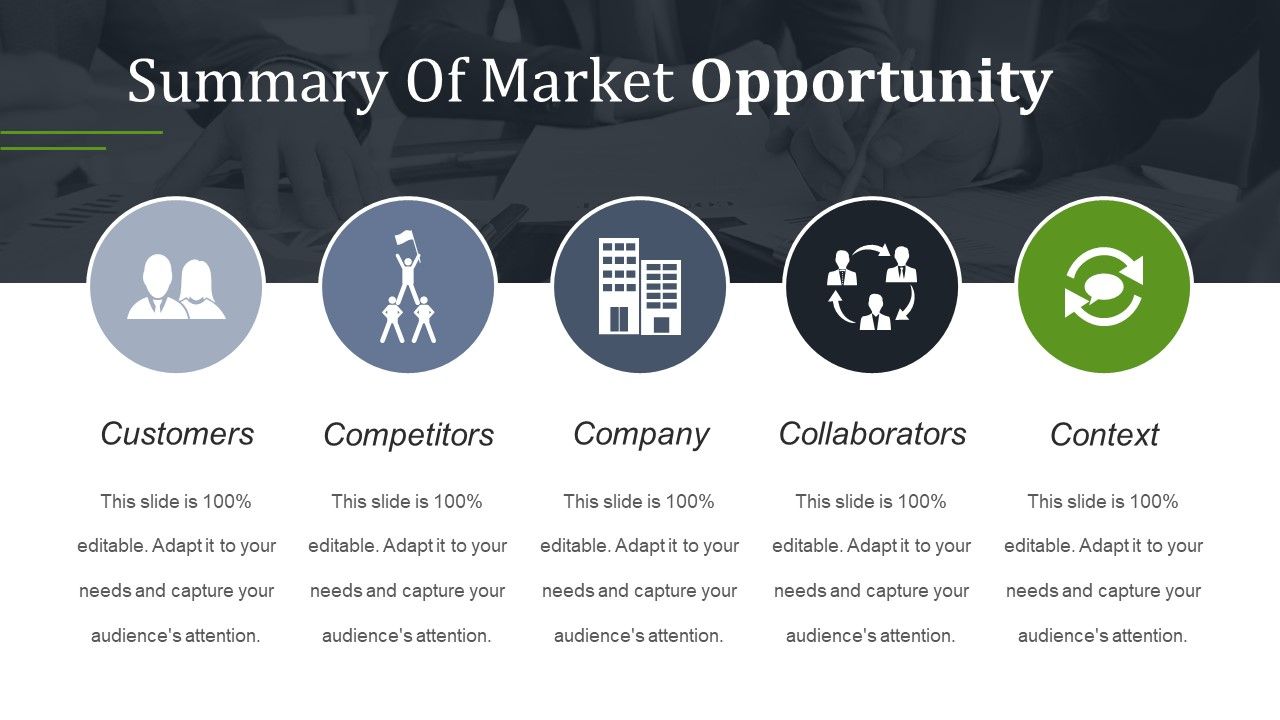
Slide 11: This slide states the Summary Of Market Opportunity with the following sub headings- Customers, Competitors, Company, Collaborators, Context.
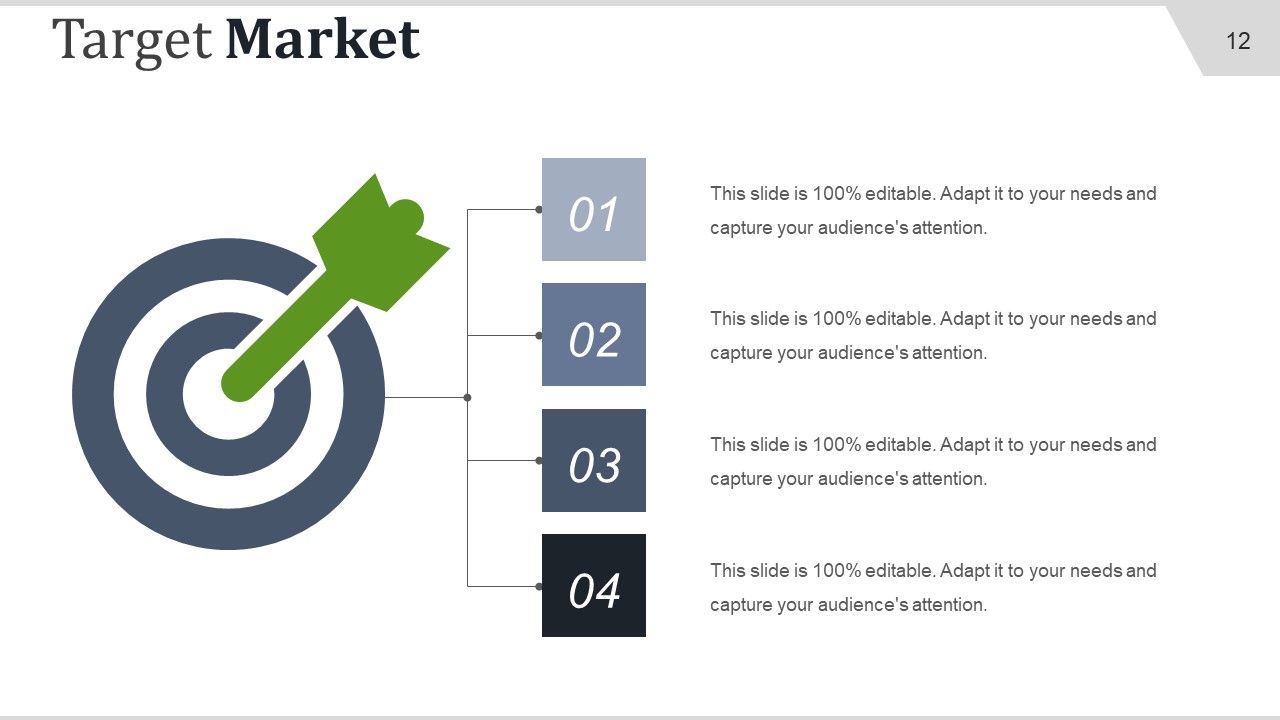
Slide 12: This slide showcases the Target Market with target imagery and text boxes.
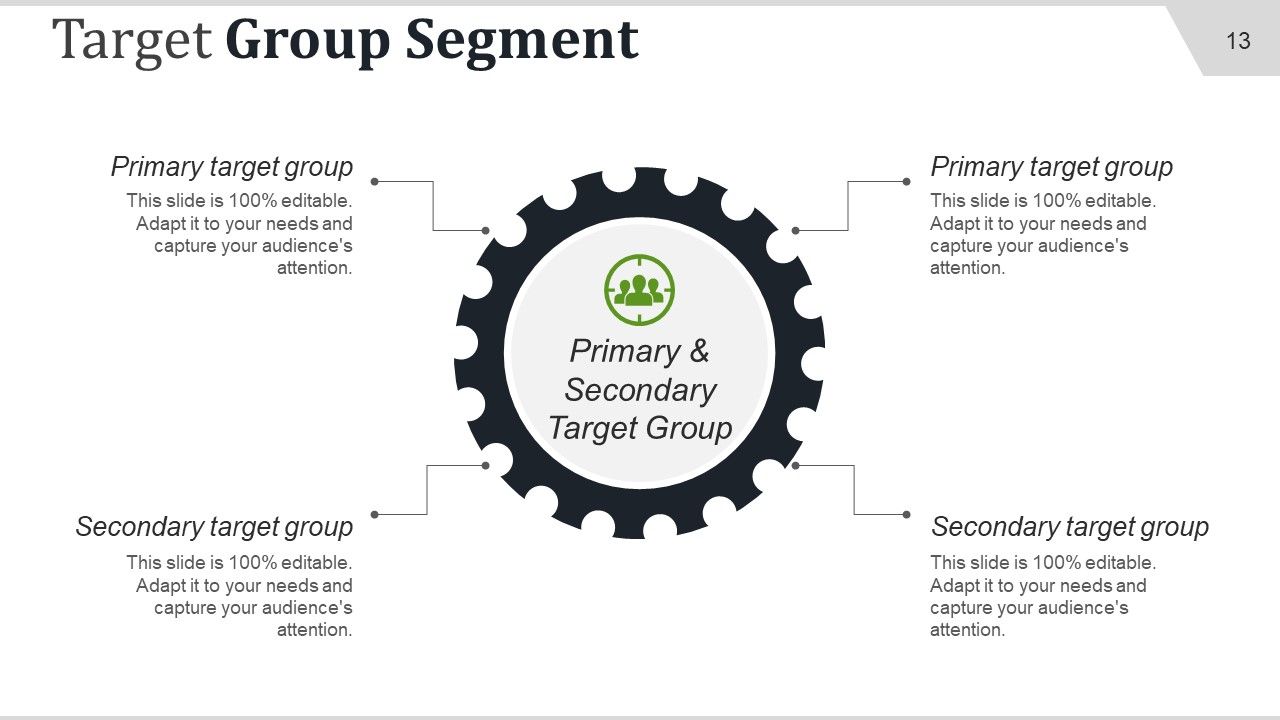
Slide 13: This slide showcases Target Group Segment with creative imagery divided into Primary & Secondary Target Group.
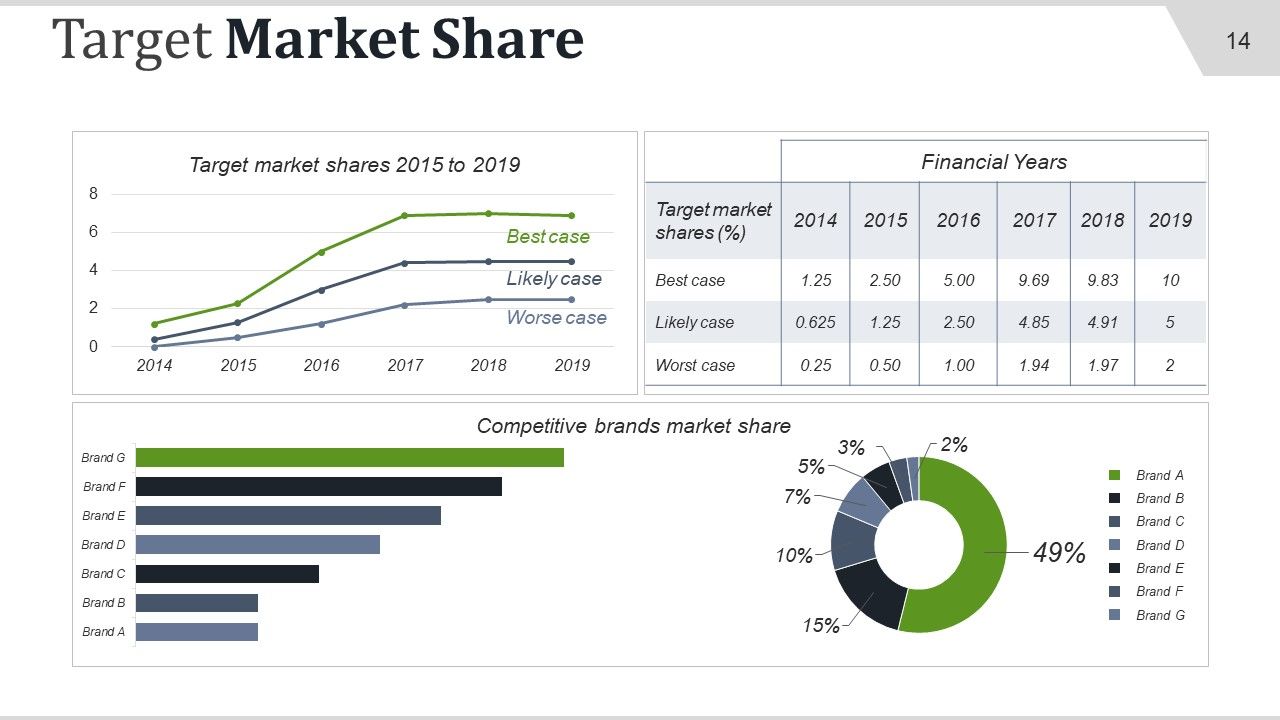
Slide 14: This slide presents Target Market Share in years and percentages.
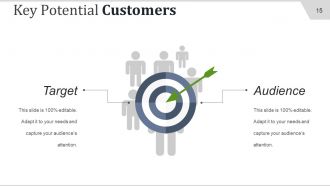
Slide 15: This slide showcases Key Potential Customers with target and human imagery.
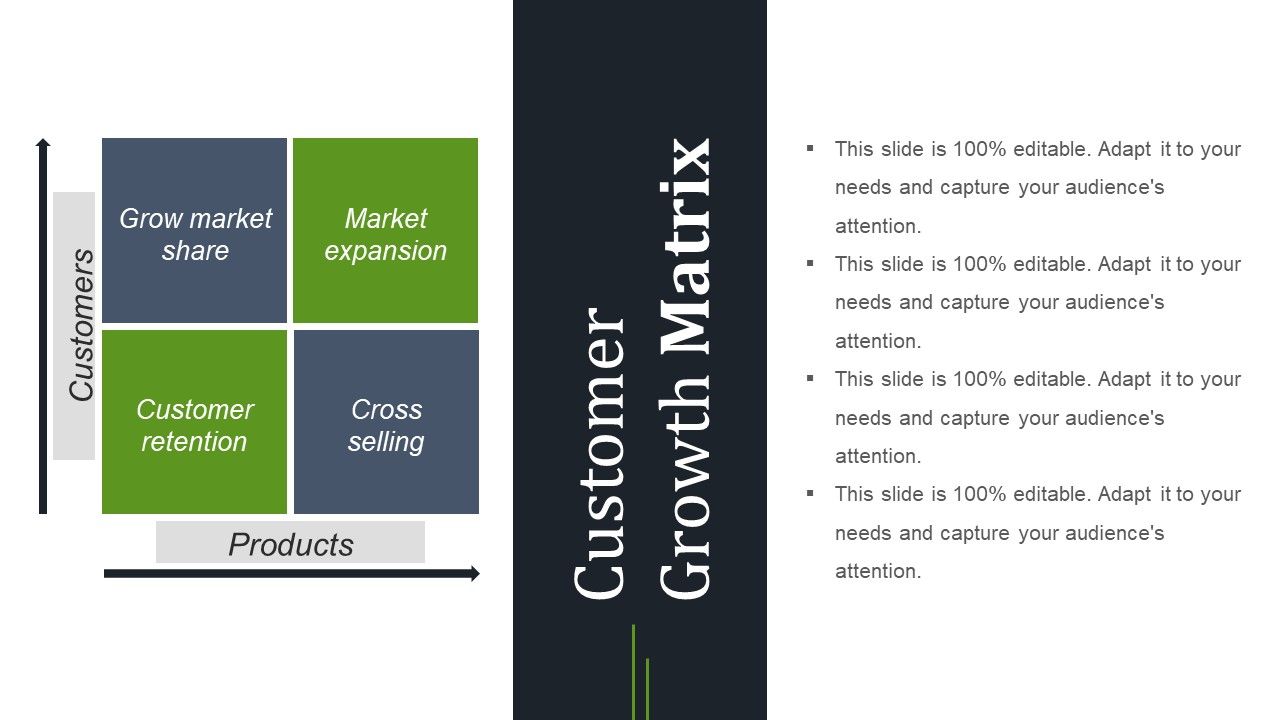
Slide 16: This slide presents Customer Growth Matrix with Customers and Product being its two parameters.
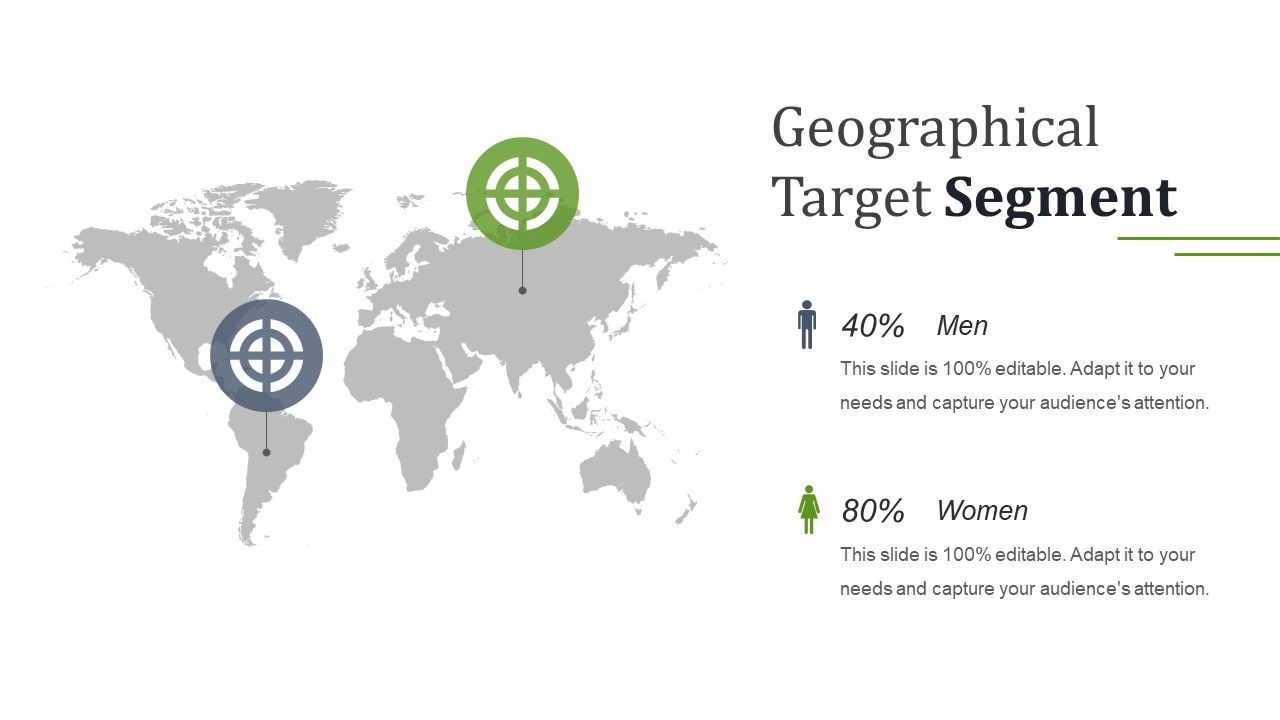
Slide 17: This slide showcases Geographical Target Segment on a world map image.
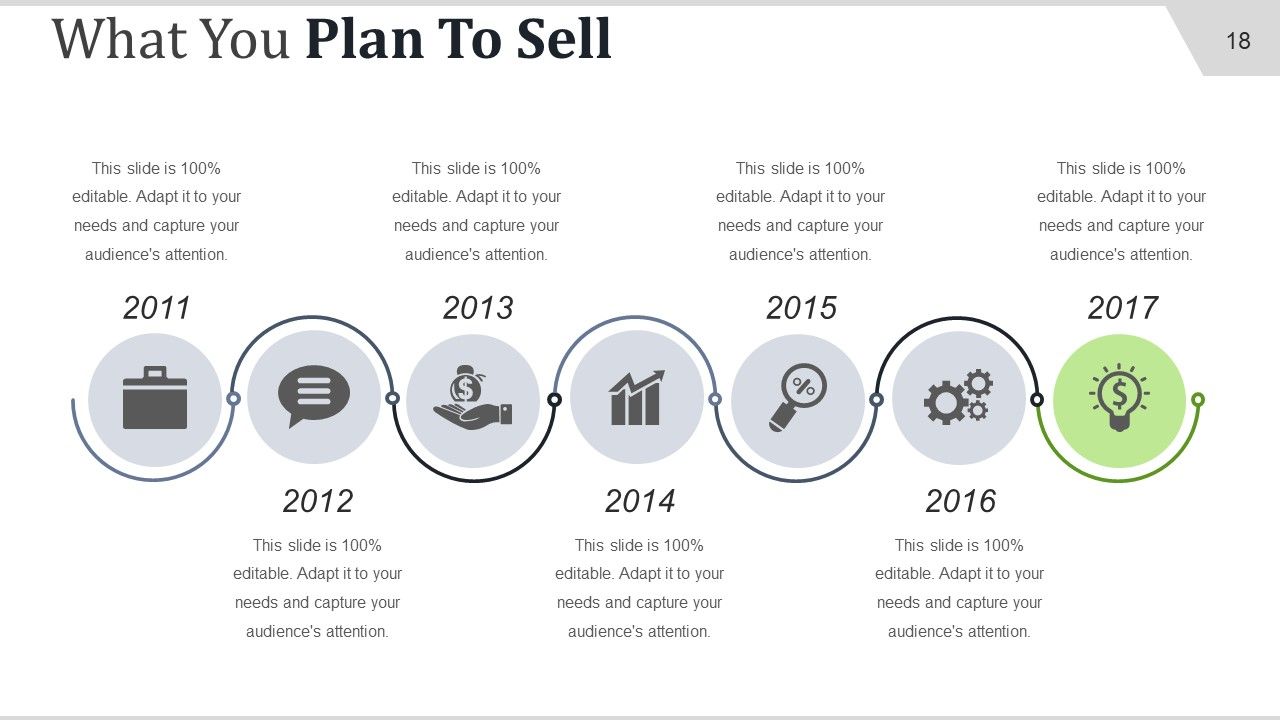
Slide 18: This is What You Plan To Sell slide showcasing years and icon imagery.
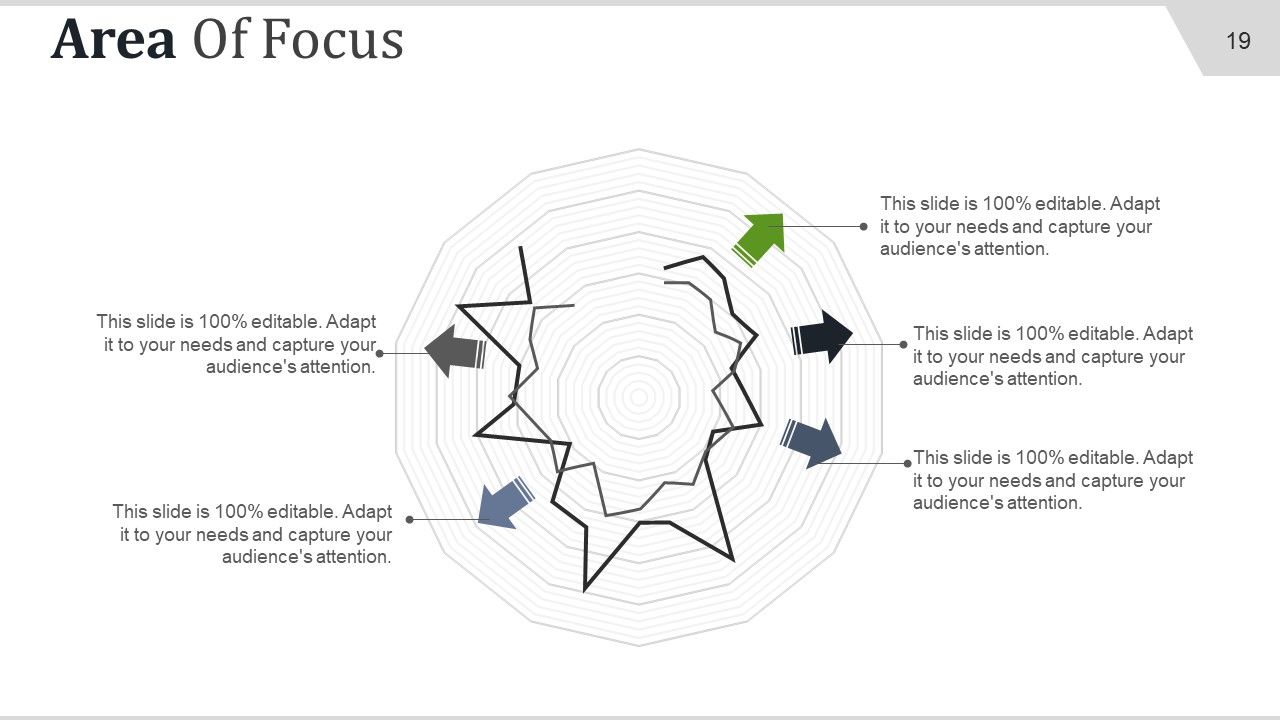
Slide 19: This slide showcases Area Of Focus through a spider chart.
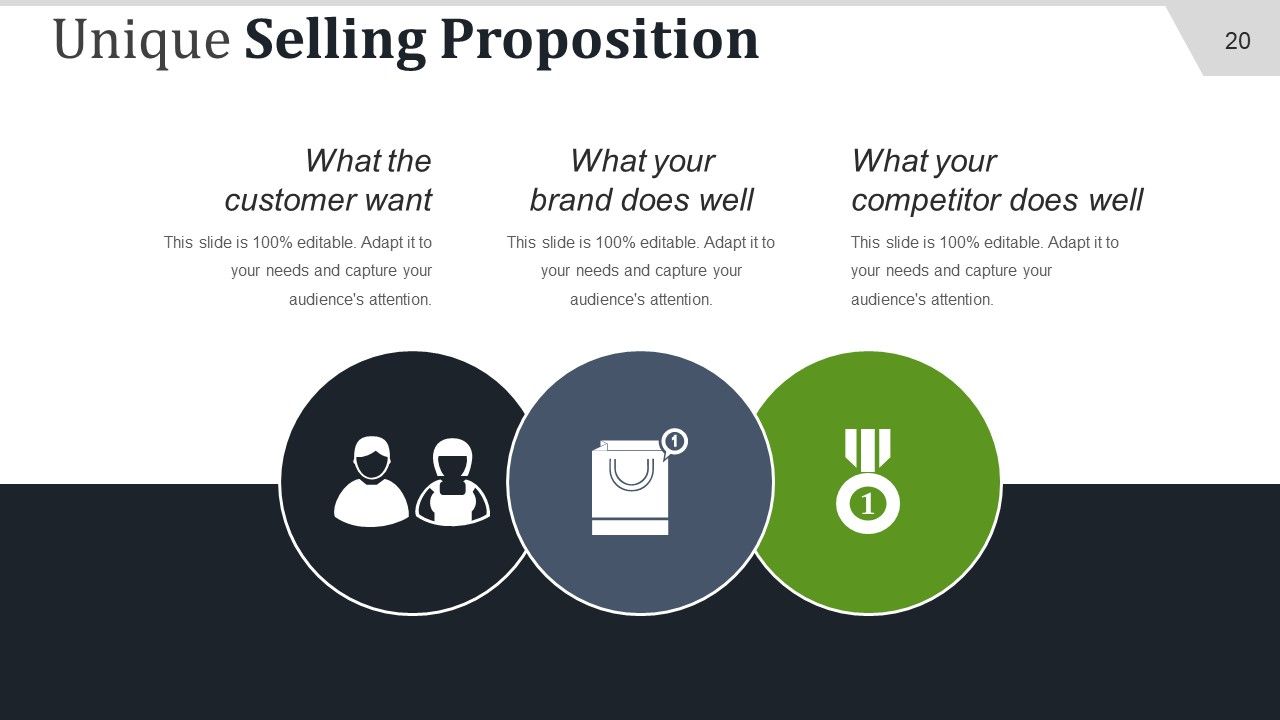
Slide 20: This slide presents Unique Selling Proposition along with its 3 main concerns. These include- What the customer want? What your brand does well? What your competitor does well?
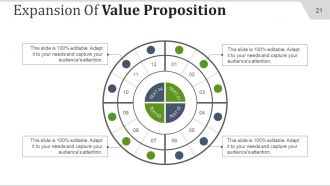
Slide 21: This slide presents Expansion Of Value Proposition with text boxes.
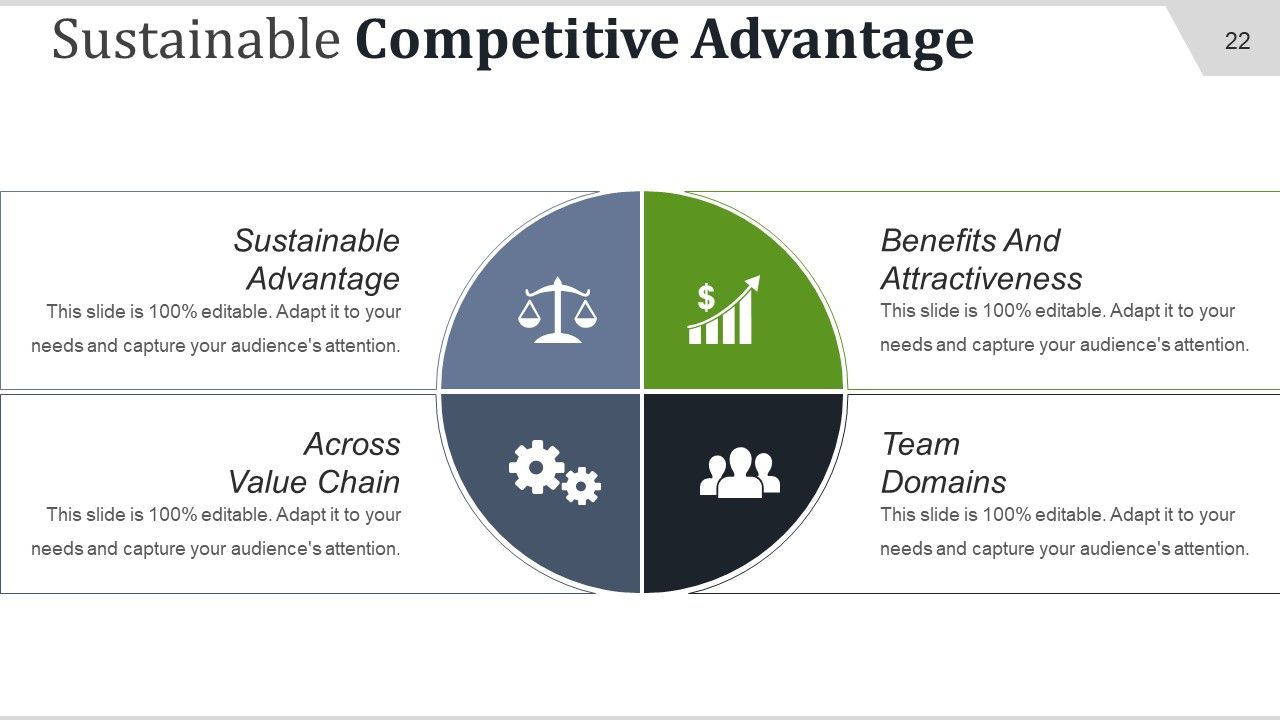
Slide 22: This is a Sustainable Competitive Advantage slide showcasing- Benefits And Attractiveness, Team Domains, Sustainable Advantage, Across Value Chain.
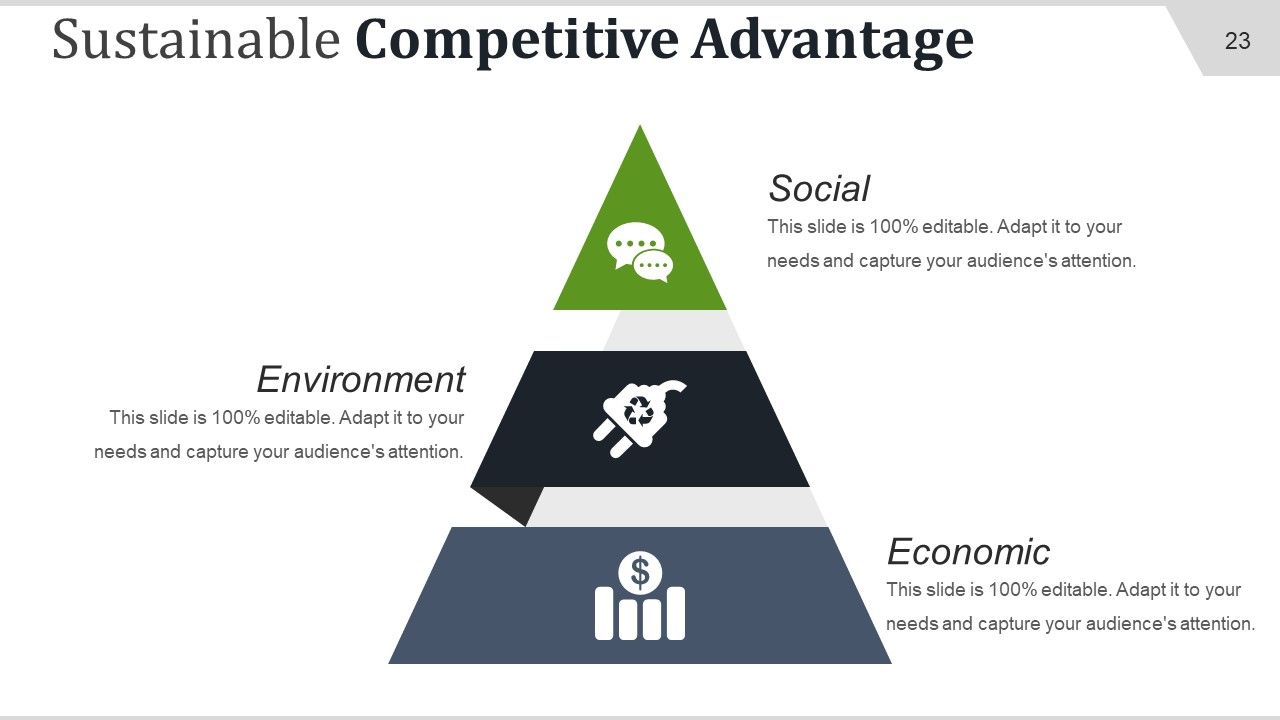
Slide 23: This is another Sustainable Competitive Advantage slide consisting of the following- Social, Environment, Economic.
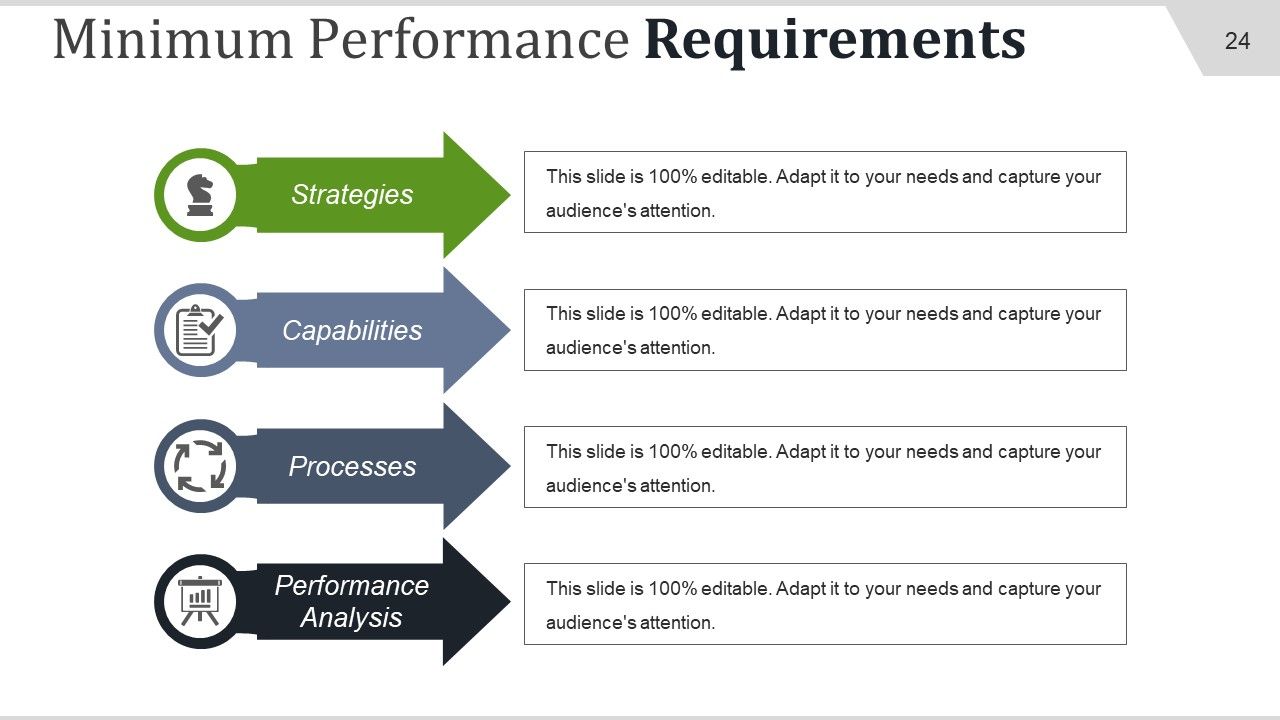
Slide 24: This is Minimum Performance Requirements slide with arrow imagery showcasing- Strategies, Capabilities, Processes, Performance Analysis.
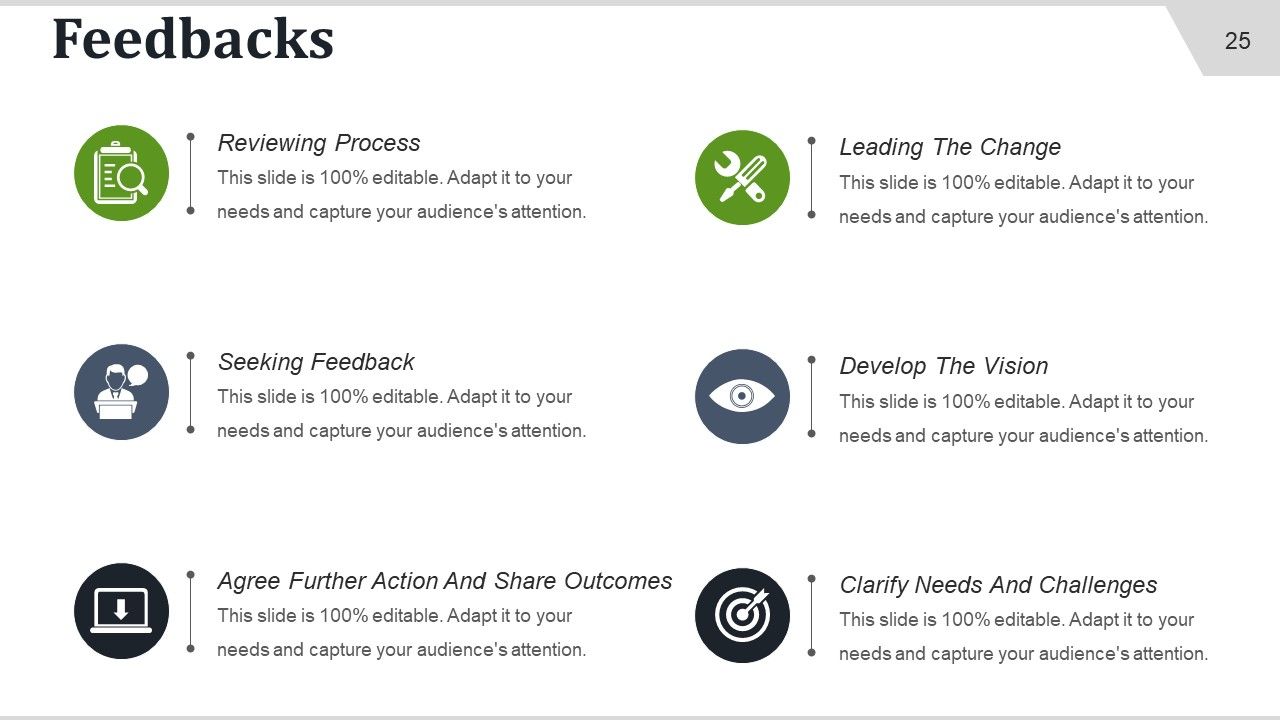
Slide 25: This slide showcases Feedbacks consisting of the following points- Leading The Change, Seeking Feedback, Develop The Vision, Clarify Needs And Challenges, Agree Further Action And Share Outcomes Reviewing Process.
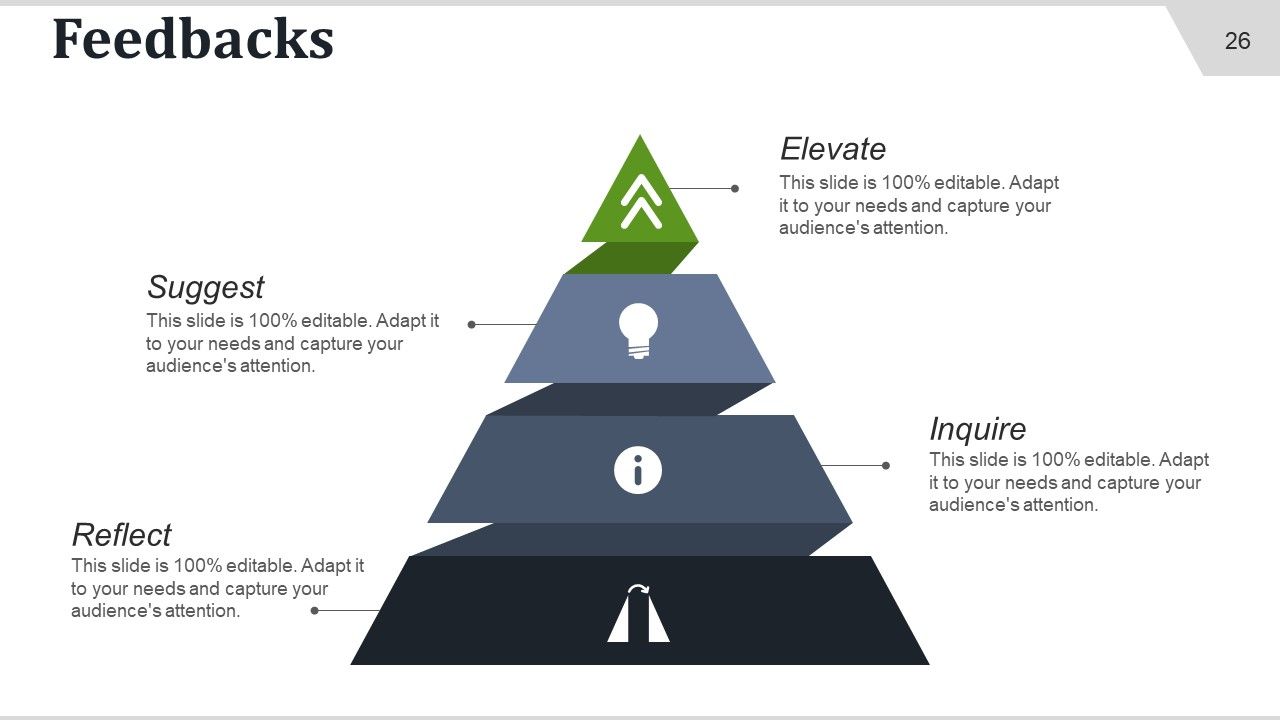
Slide 26: This is another Feedbacks slide shown with a pyramid image to- Elevate, Suggest, Inquire, Reflect.
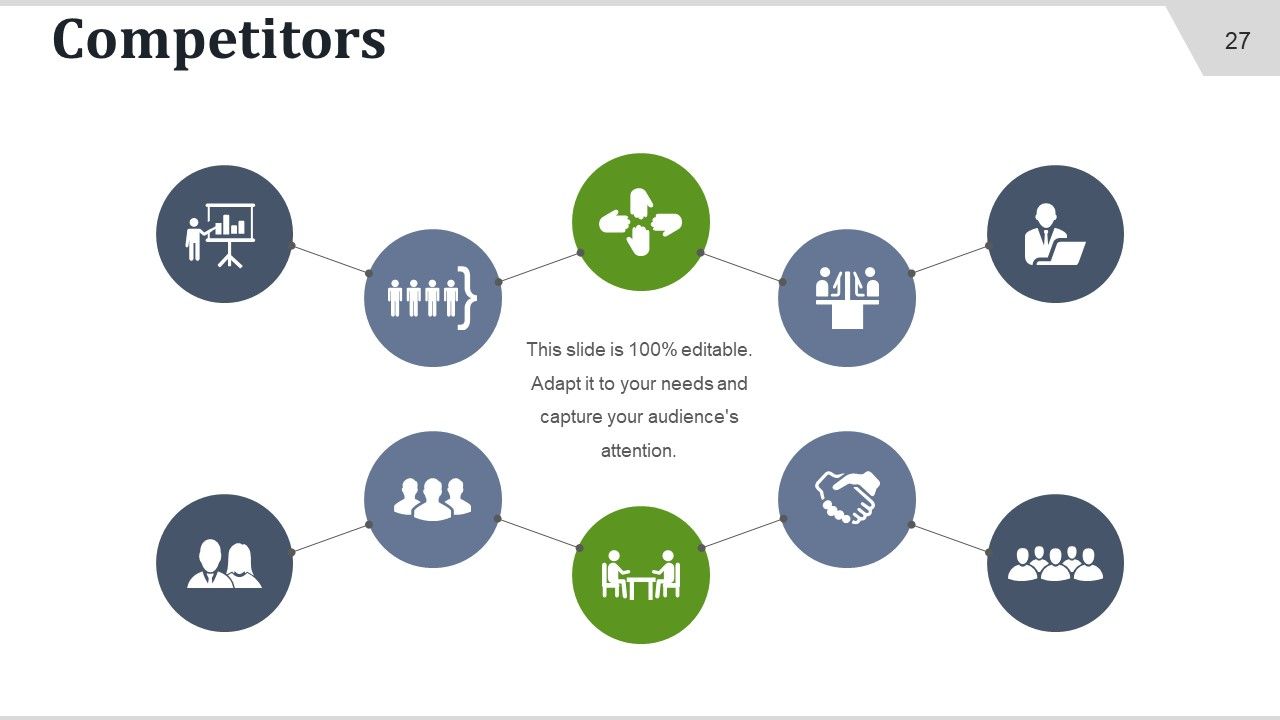
Slide 27: This slide showcases various Competitors with their respective icons.
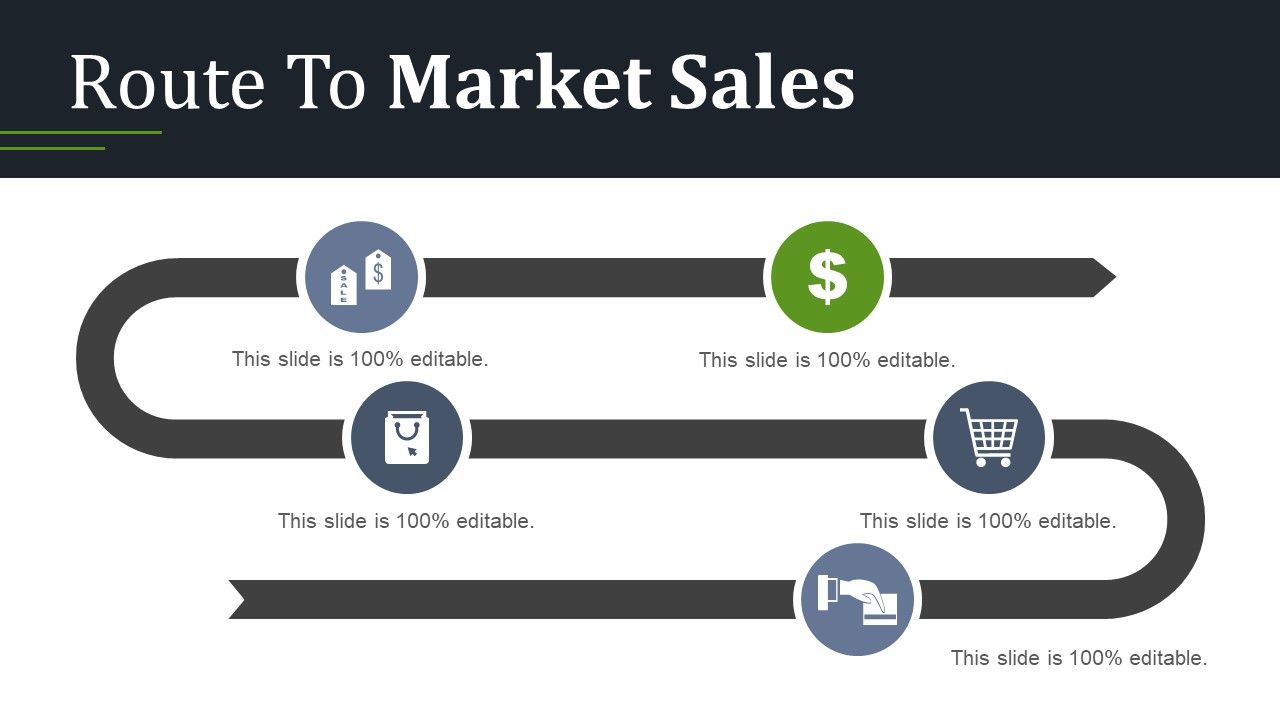
Slide 28: This slide presents Route To Market Sales with a roadmap which can be altered/ modified as per requirement.
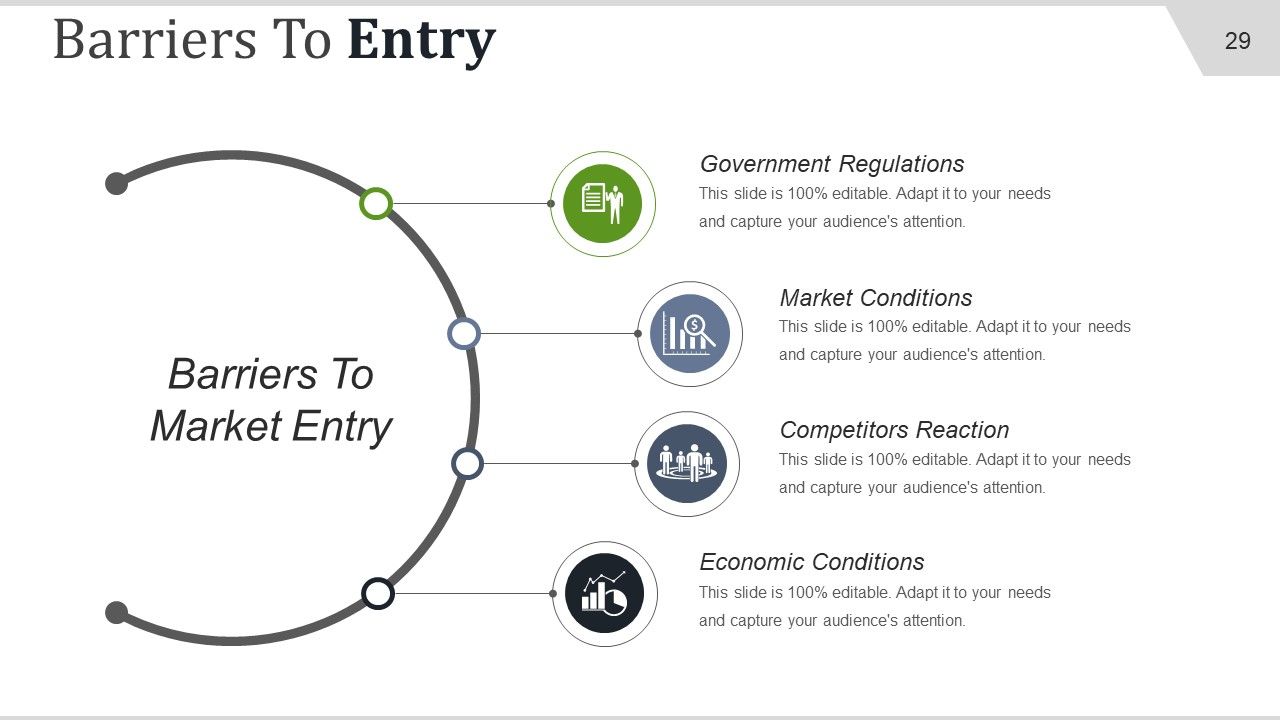
Slide 29: This slide presents Barriers To Entry showcasing mainly Barriers To Market Entry which involves- Market Conditions, Government Regulations, Competitors Reaction, Economic Conditions, Barriers To Market Entry.
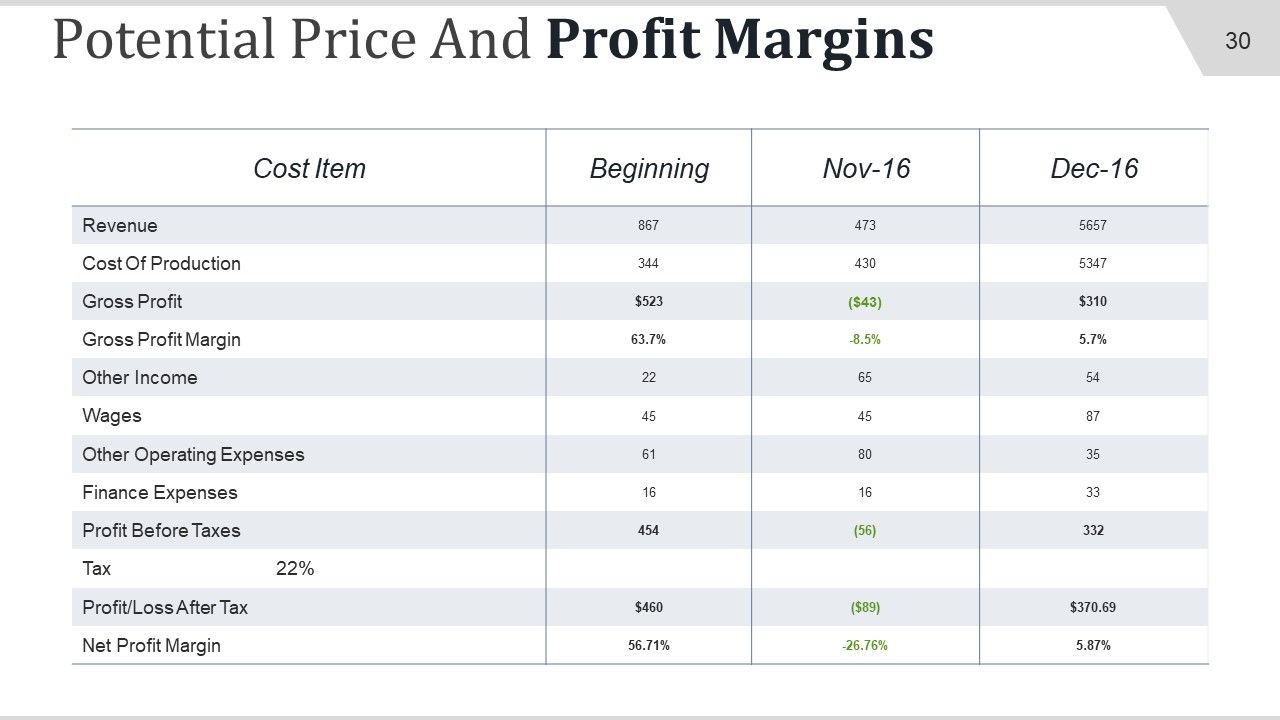
Slide 30: This slide presents Potential Price And Profit Margins in a tabular form.
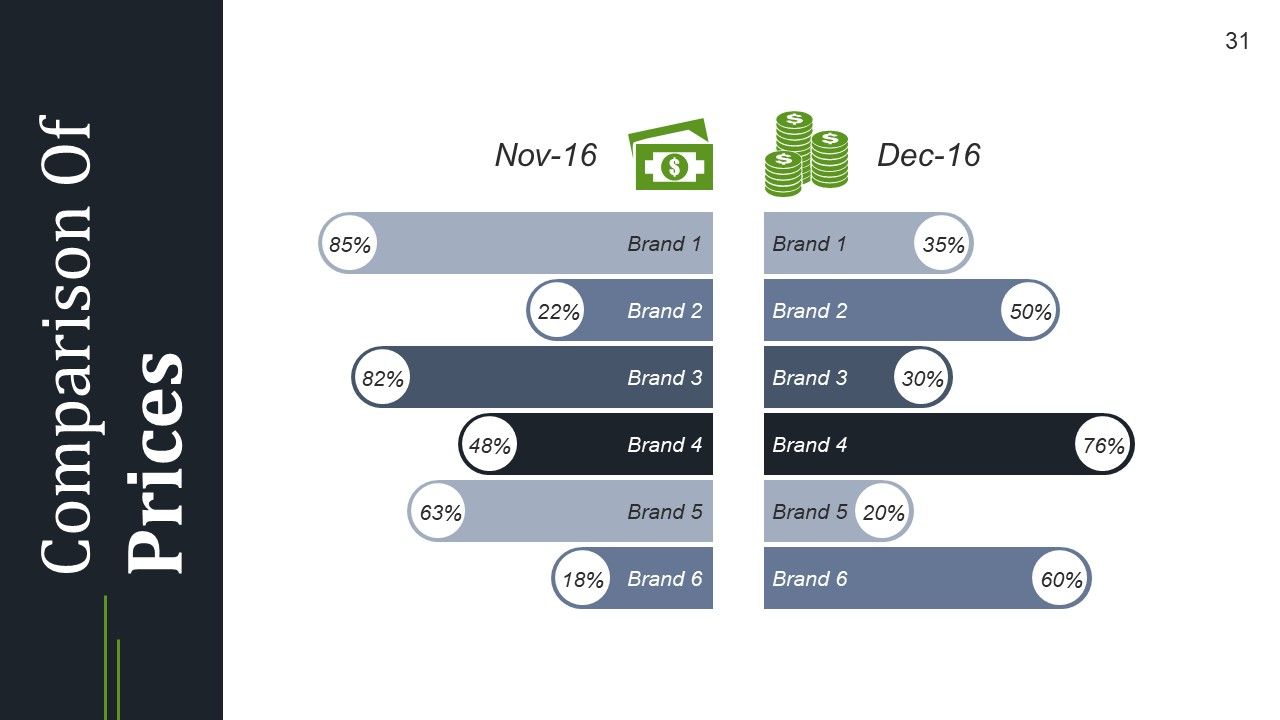
Slide 31: This slide showcases Comparison Of Prices with respect to various brands.
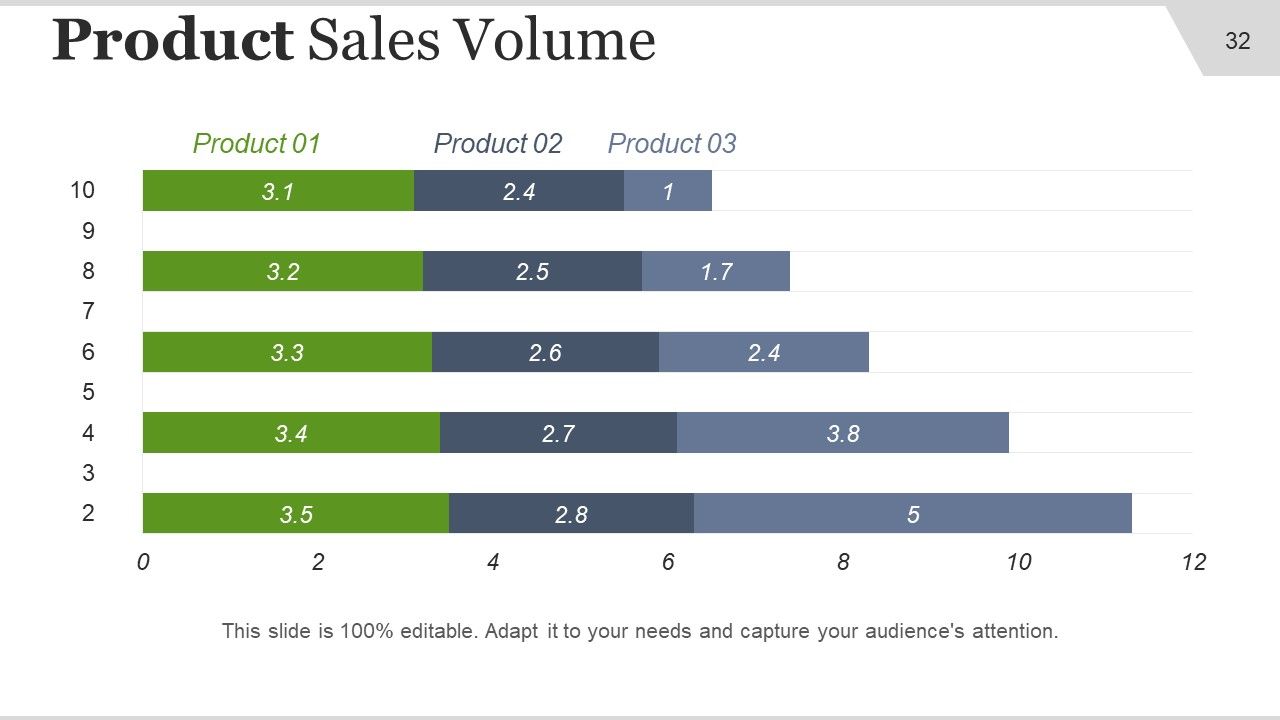
Slide 32: This slide showcases Product Sales Volume of Product 01, Product 02 and Product 03 with a bar graph.
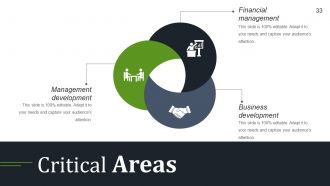
Slide 33: This slide showcases Critical Areas with a venn diagram which are to be assessed beforehand. These include- Financial management, Business development, Management development.
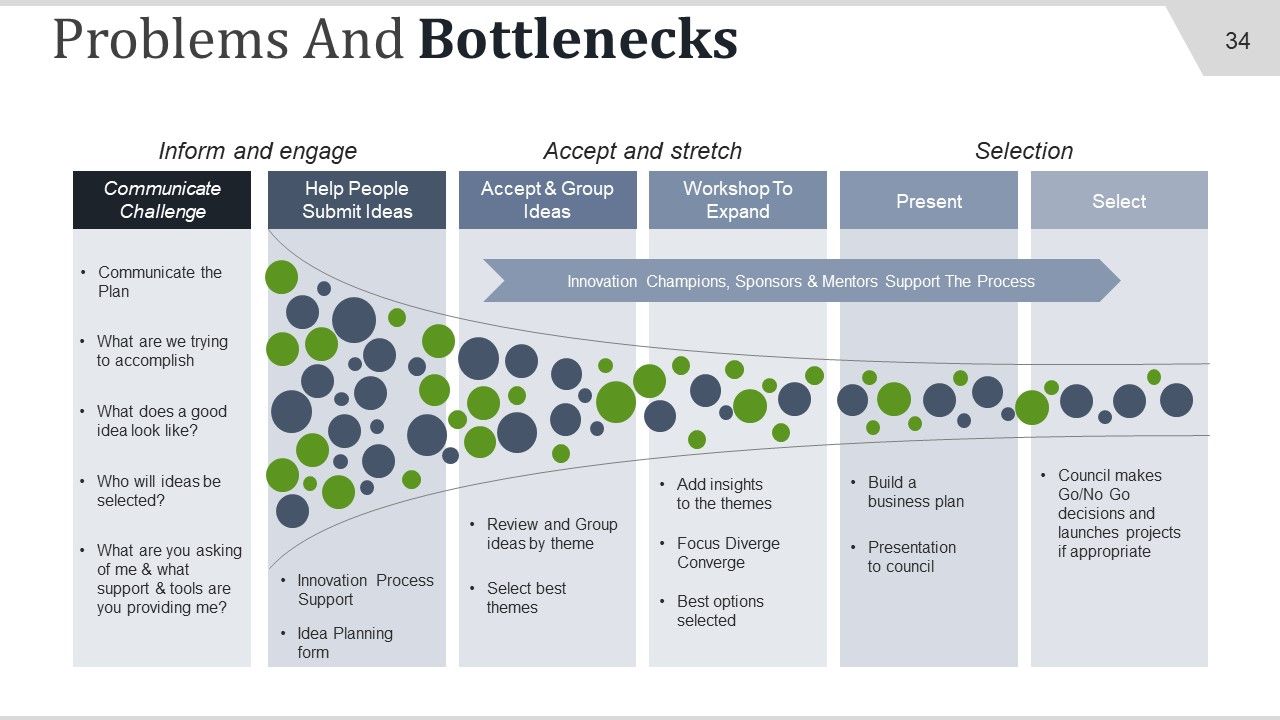
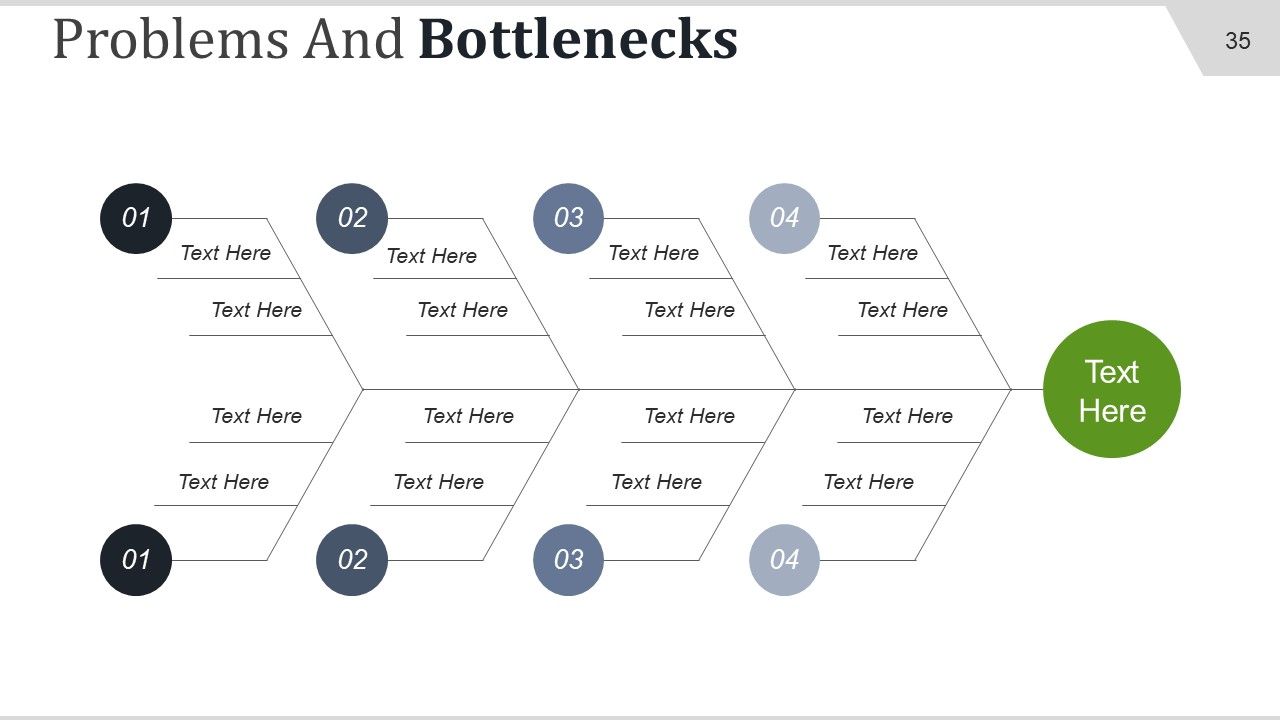
Slide 34: This slide showcases a framework of Problems And Bottlenecks. Modify them and alter/ change as per need.
Slide 35: This is yet another Problems And Bottlenecks slide which is highly adaptable.
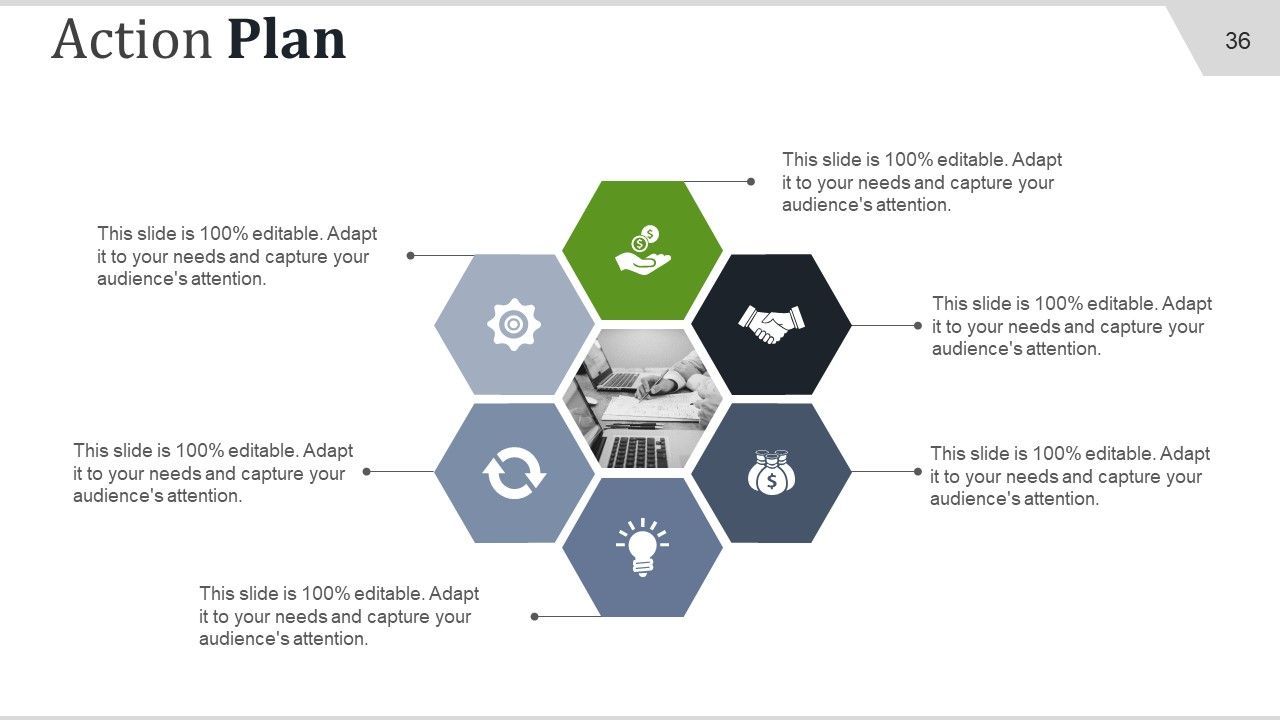
Slide 36: This slide presents the Action Plan which has to be executed. You can modify/ change the contents basis your requirement.
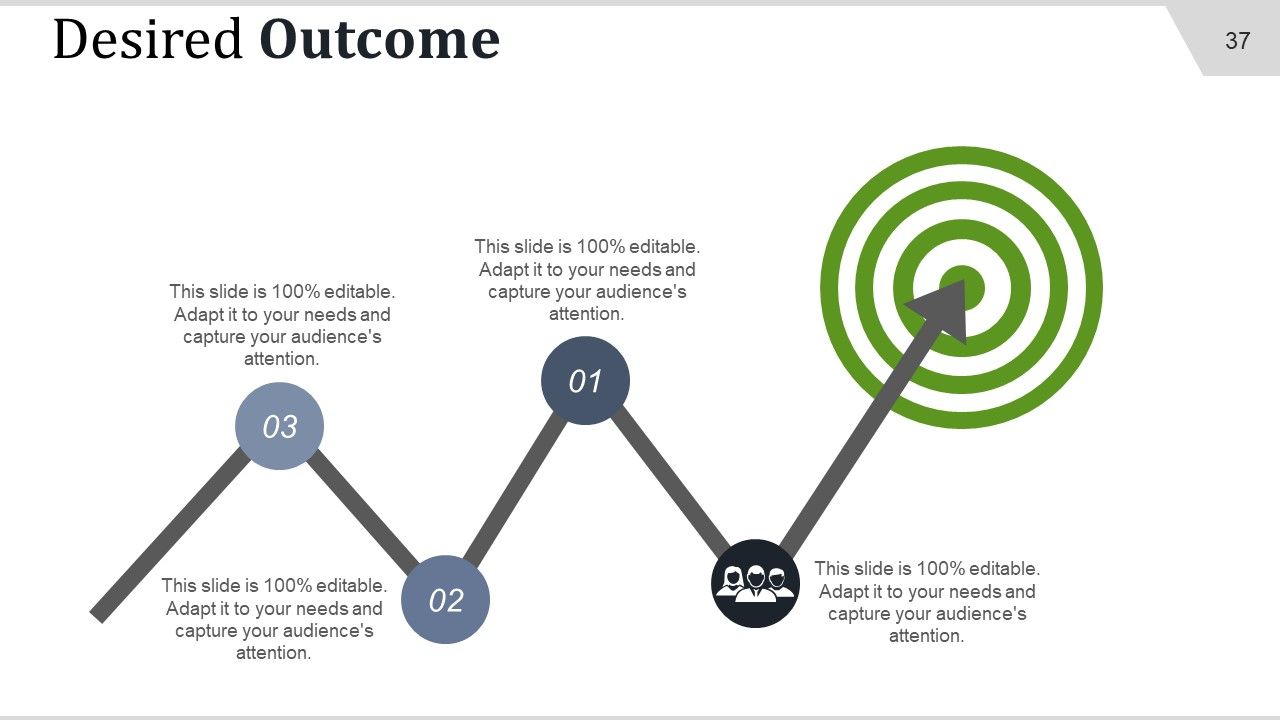
Slide 37: This slide presents Desired Outcome to be achieved with arrow and target imagery.
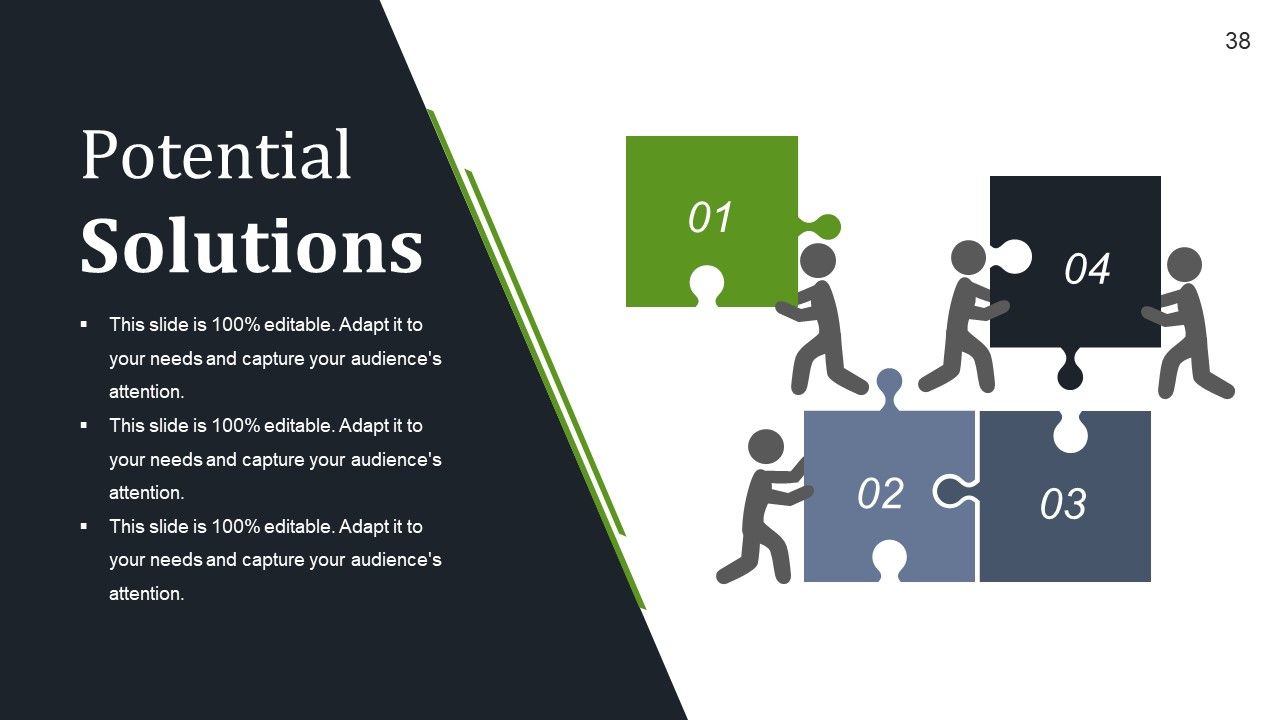
Slide 38: This slide states the Potential Solutions for various problems encountered.
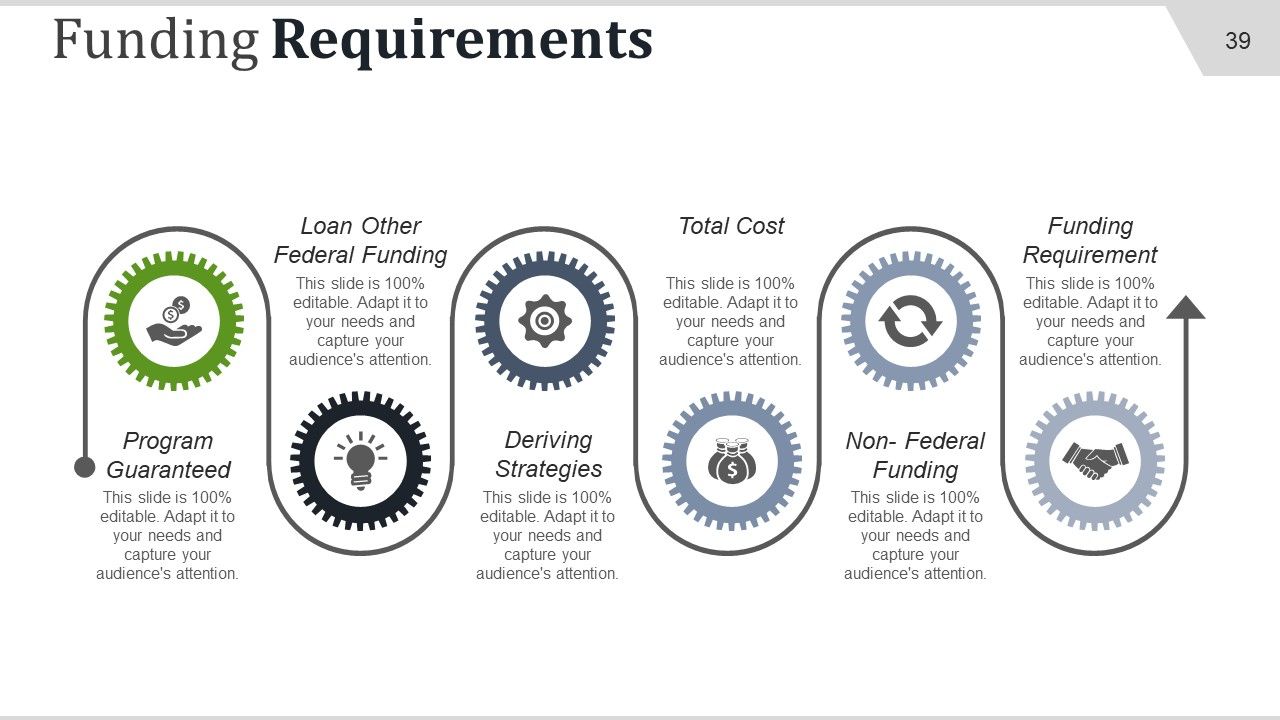
Slide 39: This is Funding Requirements slide showcased through their respective icons. These include- Program Guaranteed, Deriving Strategies Non- Federal Funding Funding Requirement Total Cost Loan Other Federal Funding
Slide 40: This is a Coffee Break slide with imagery for a halt. Make it your own and alter as per need.
Slide 41: This is an Executive Summary Outsourcing Proposal Icon slide showcasing various icons. Use/ alter as per need.
Slide 42: This slide presents Graph And Chart to move forward. You can change/ alter the contents as per need
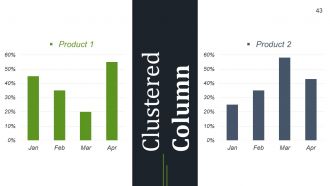
Slide 43: This slide presents Clustered Column for Product 1 and Product 2 comparison, growth etc.
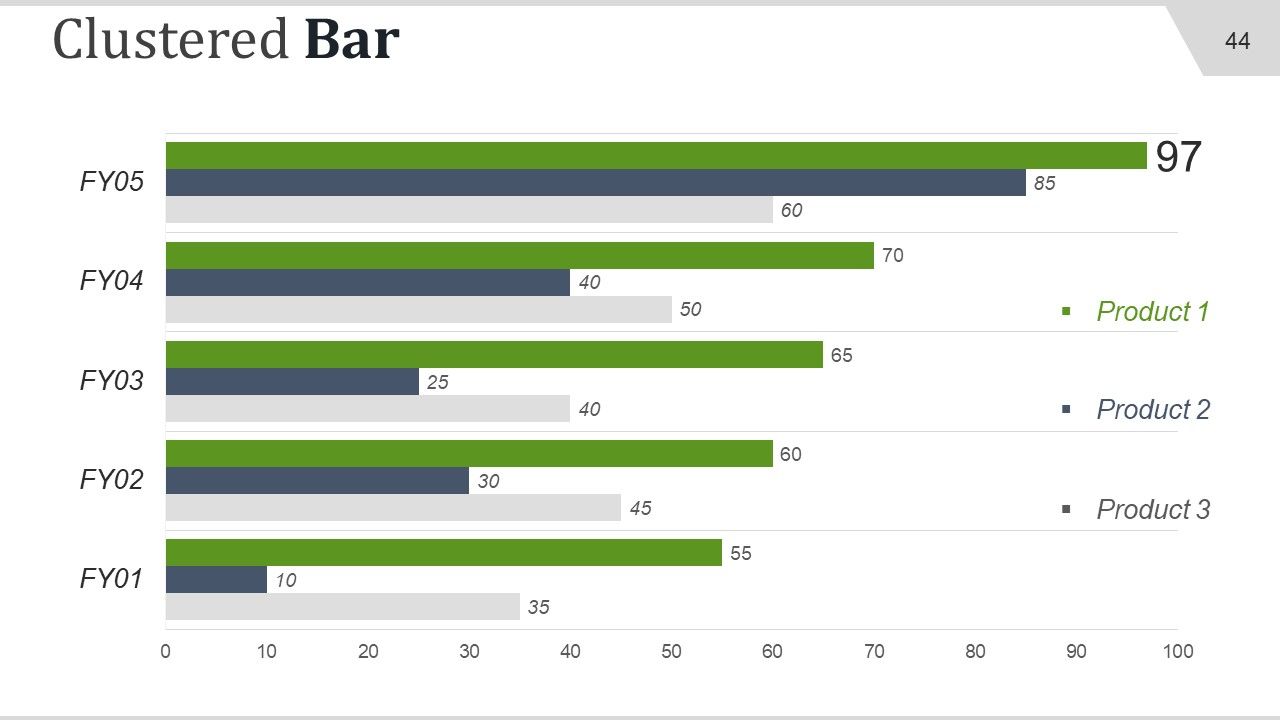
Slide 44: This is a Clustered Bar graph slide stating comparison, growth etc.
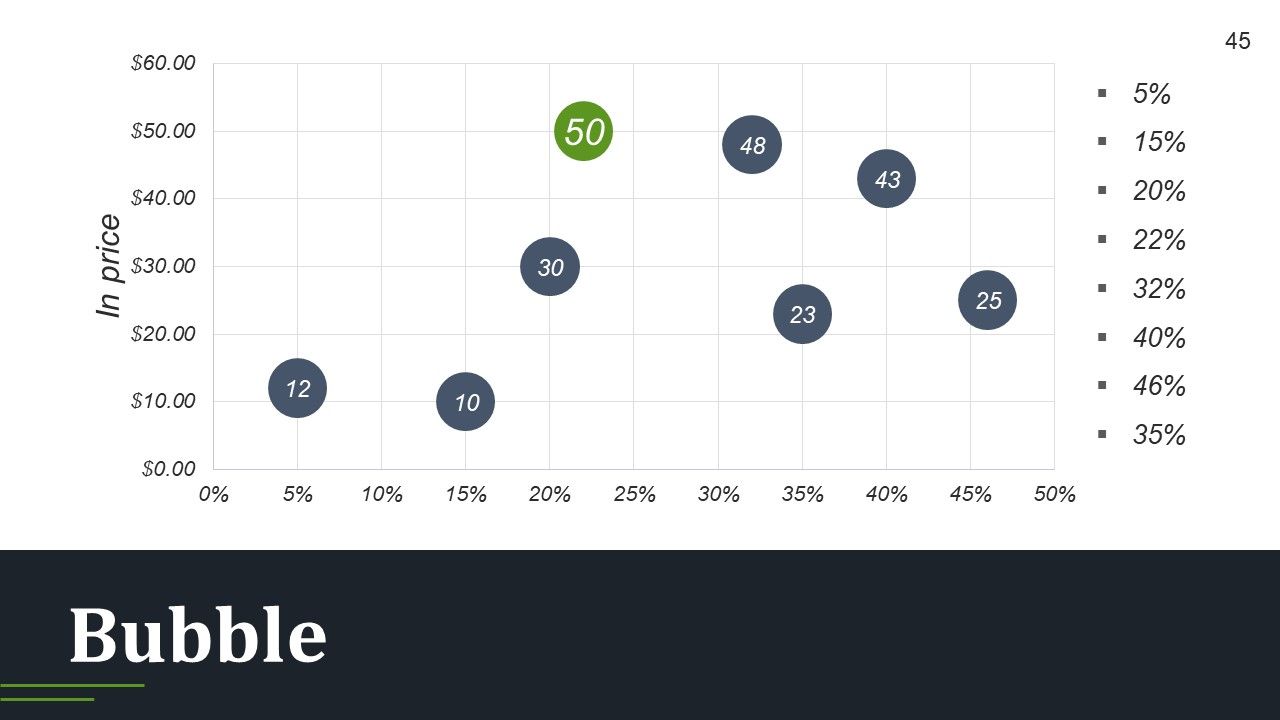
Slide 45: This slide showcases Bubble image with respect to Price.
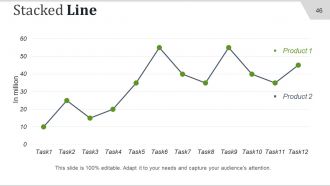
Slide 46: This slide shows a Stacked Line graph for comparison of Product 01, Product 02.
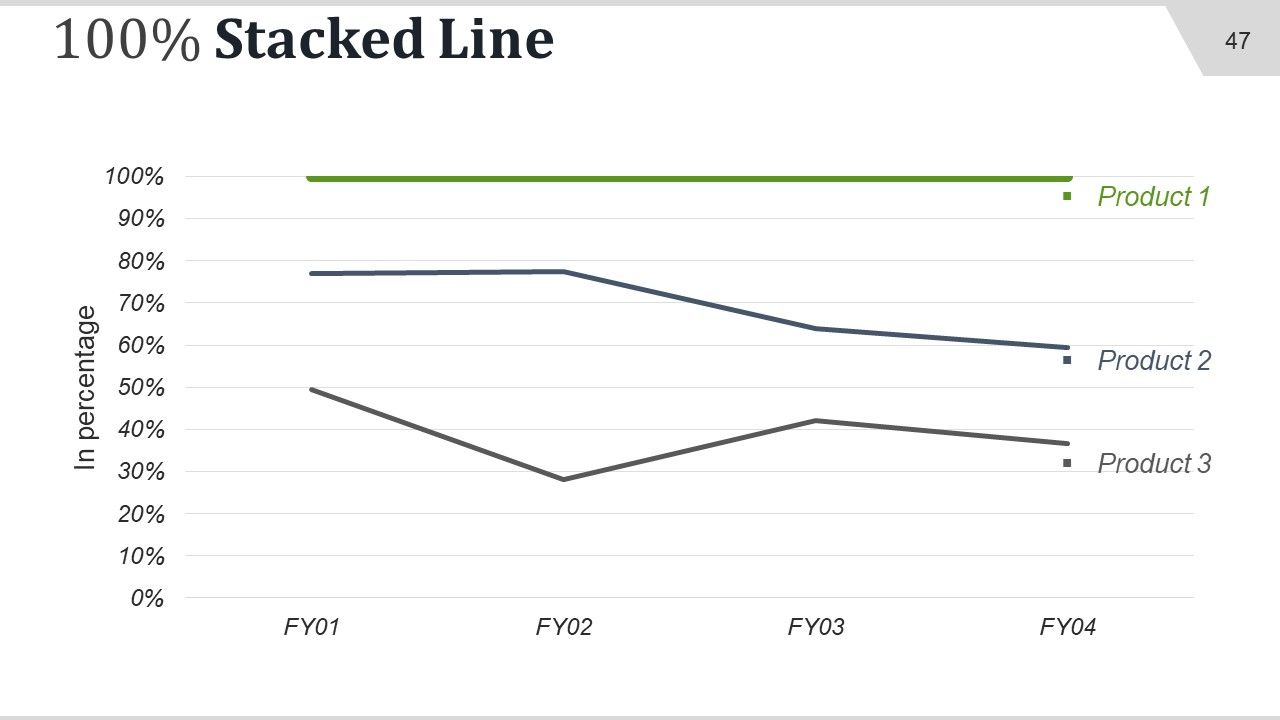
Slide 47: This is 100% Stacked Line graph slide to present product/ entity comparison.
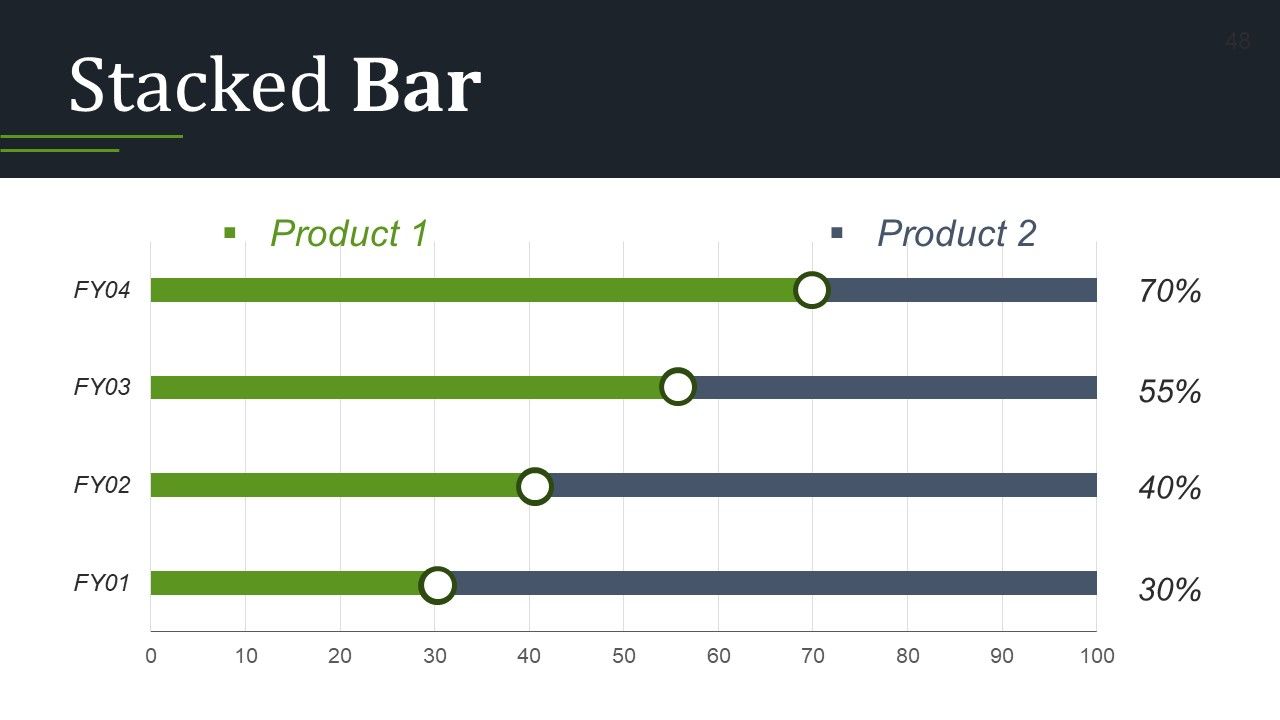
Slide 48: This is a Stacked Bar slide to show product/entities comparison.
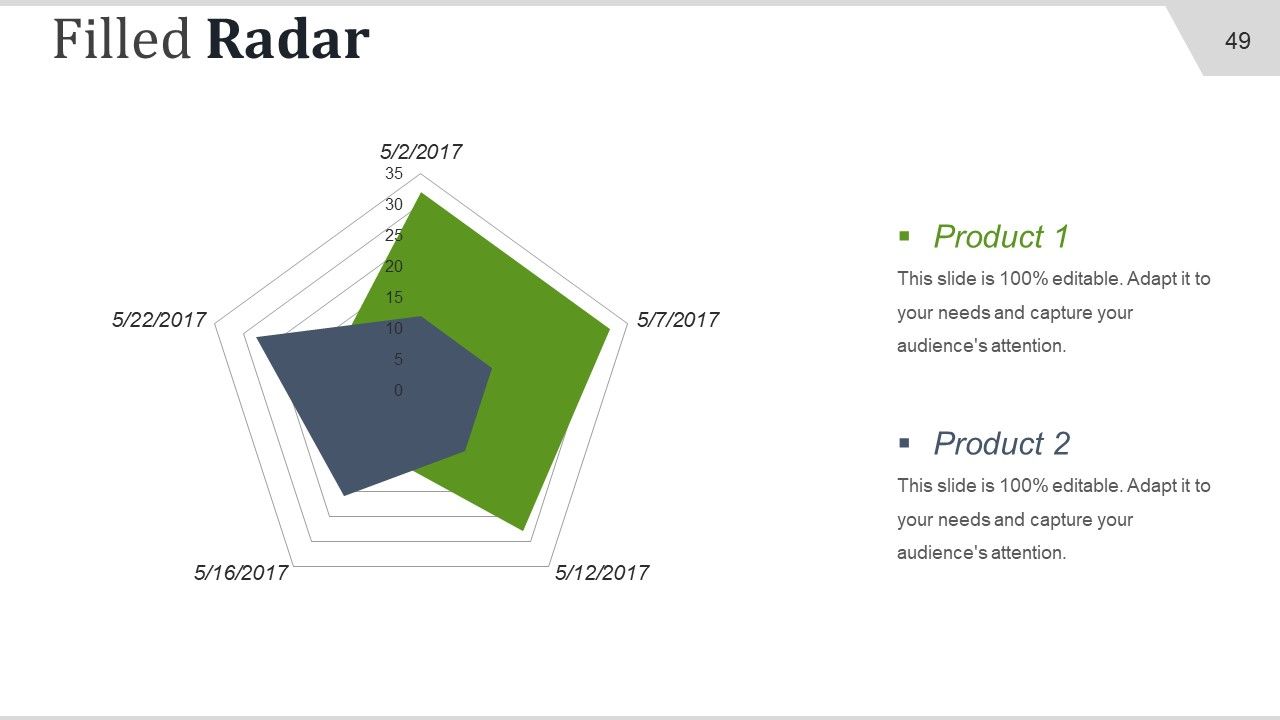
Slide 49: This slide presents a Filled Radar graph/chart. Compare Product 01, Product 02 and use as per required.
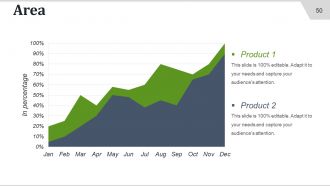
Slide 50: This slide presents Area graph/chart. Compare Product 01, Product 02 and use as per required.
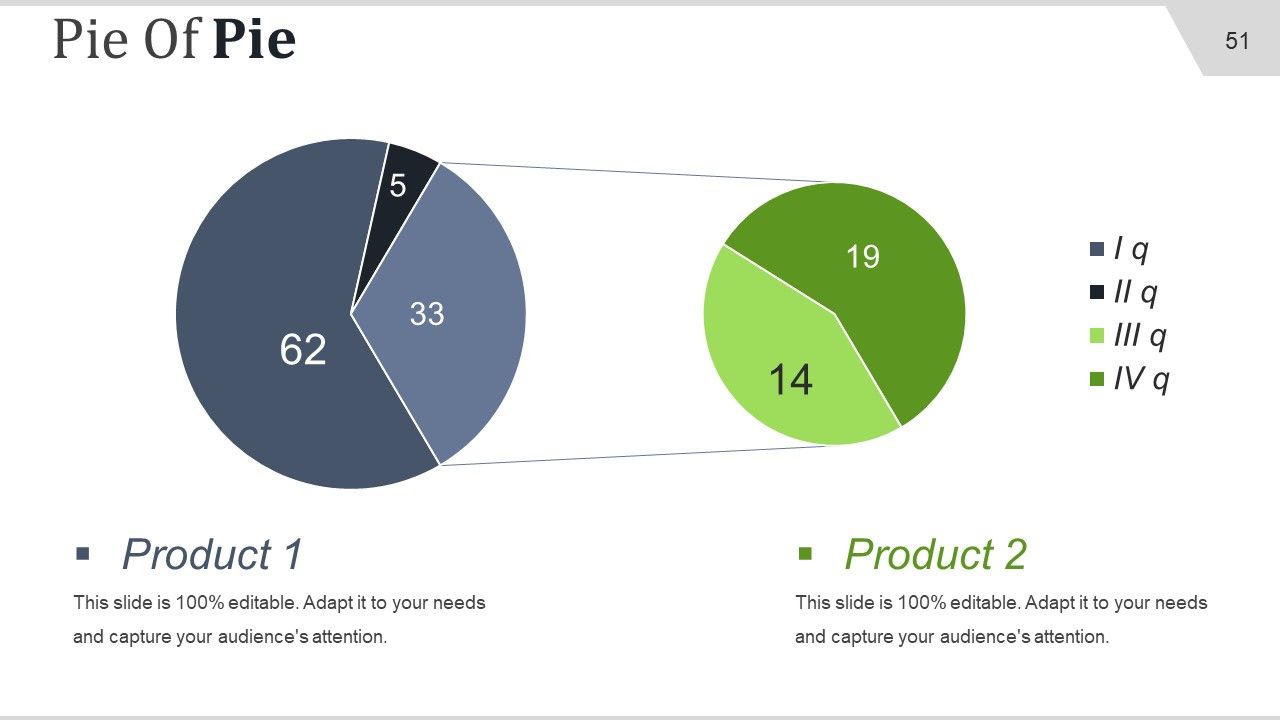
Slide 51: This is a Pie Of Pie image slide. Compare Product 01, Product 02 and use as per required.
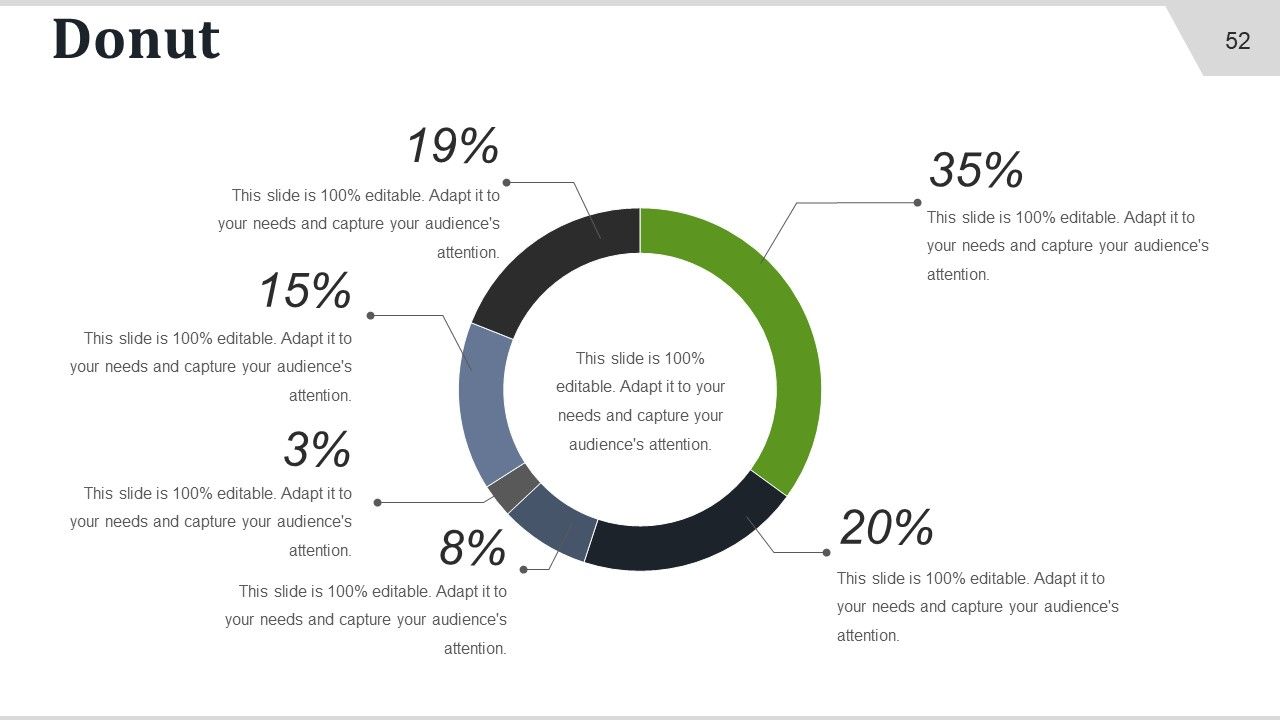
Slide 52: This slide presents Donut chart to state product/ entity comparison etc.
Slide 53: This slide is titled Additional slides to proceed forward. You can change/ alter contents as per need.
Slide 54: This slide showcases Our Team with Name and designation to fill.
Slide 55: This is an About Us slide. State company or team specifications here.
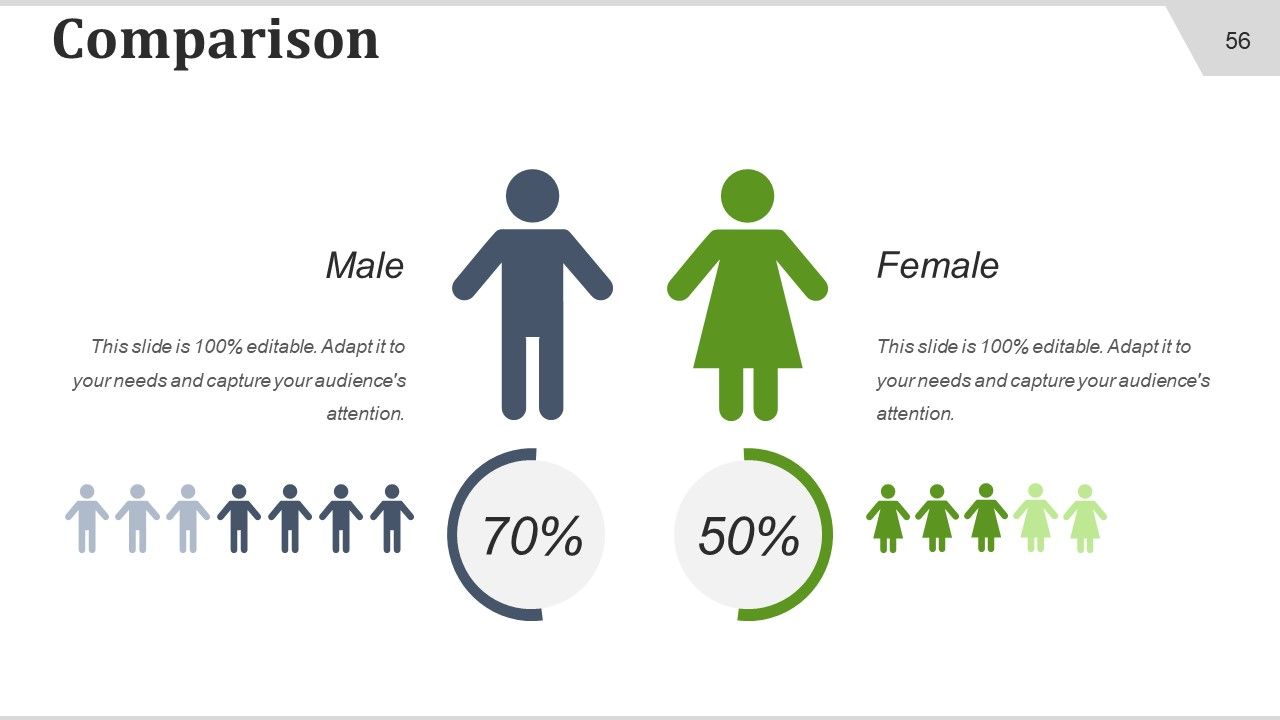
Slide 56: This is a Comparison slide for comparing entities/products etc. here.
Slide 57: This is Our Goals slide. State your goals, aspirations etc. here.
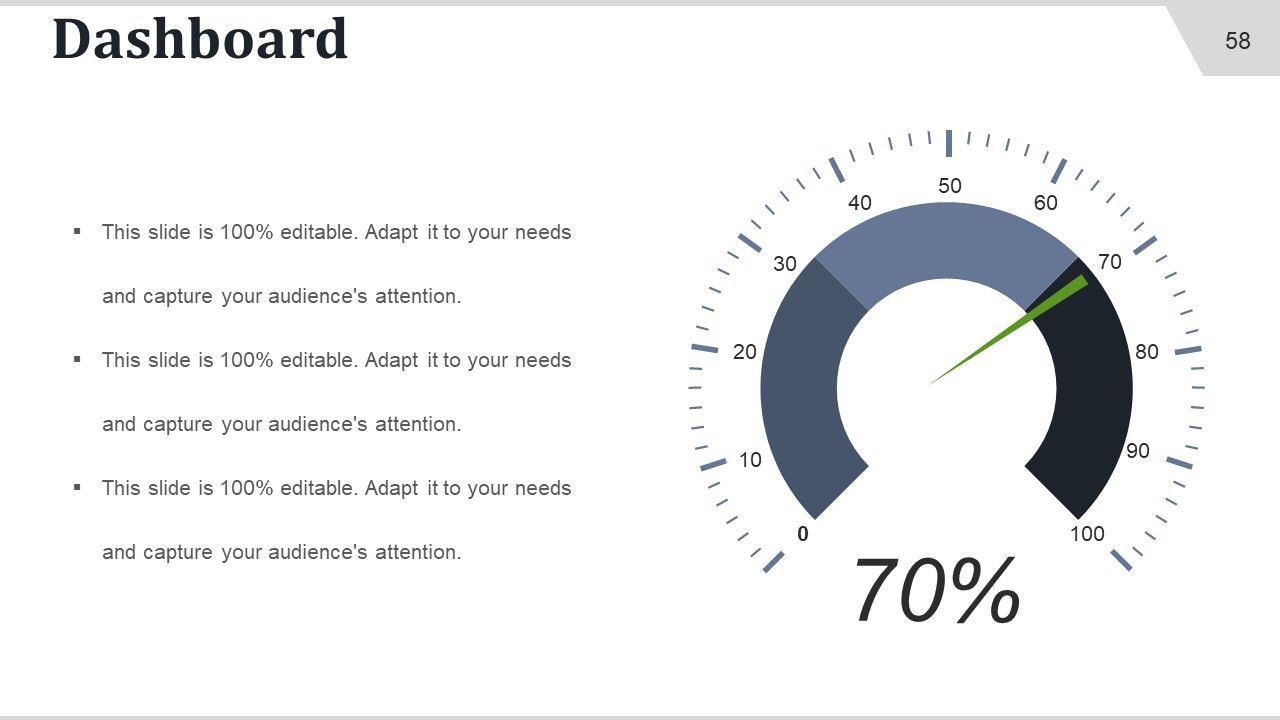
Slide 58: This is a Dashboard slide to state metrics, kpis etc.
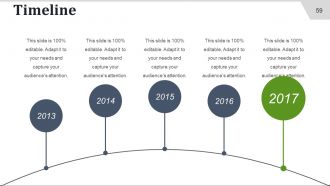
Slide 59: This is a Timeline slide to show evolution, growth, milestones etc.
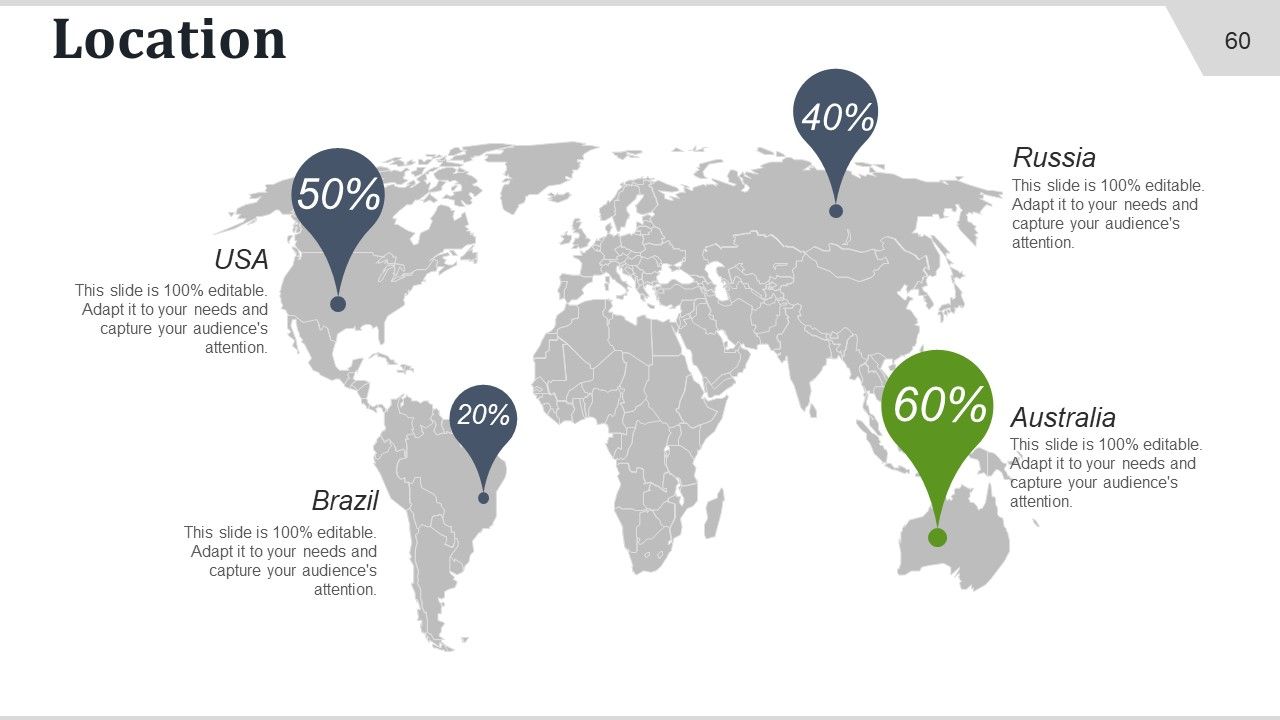
Slide 60: This is a Location slide to show segregation globally on a world map.
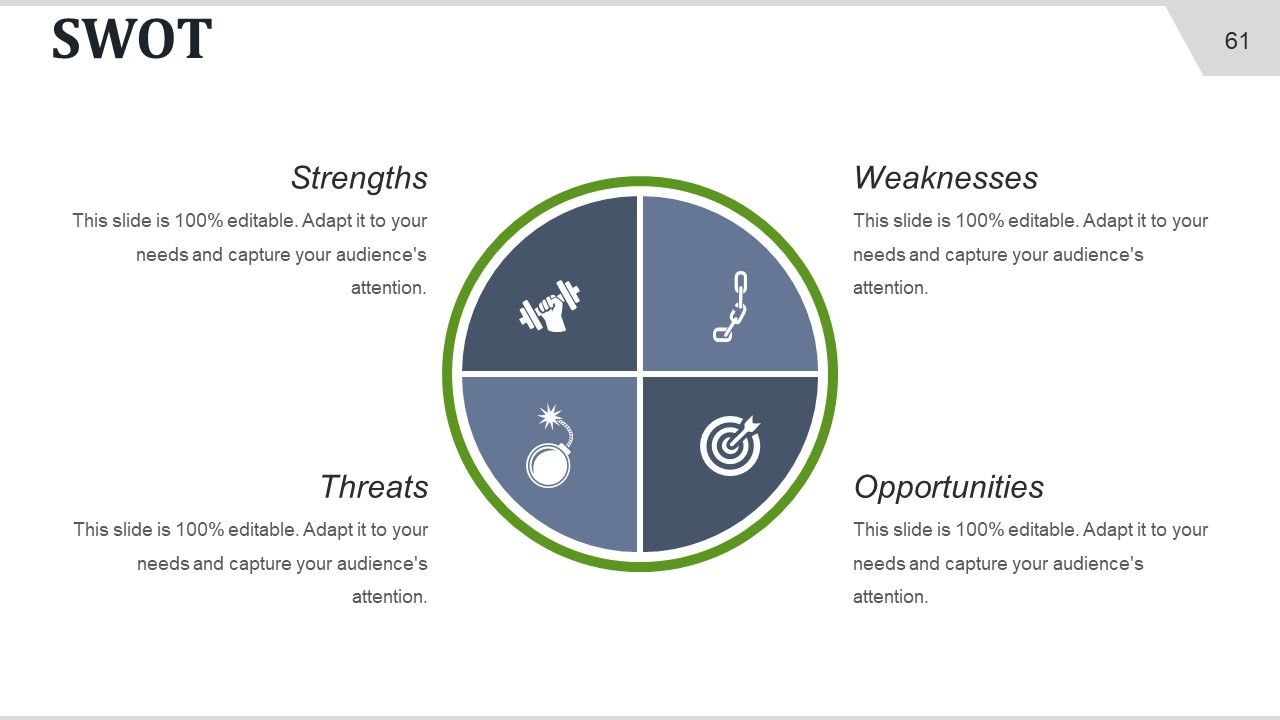
Slide 61: This slide presents SWOT Analysis. You can add your- Weaknesses, Opportunities, Strengths, Threats.
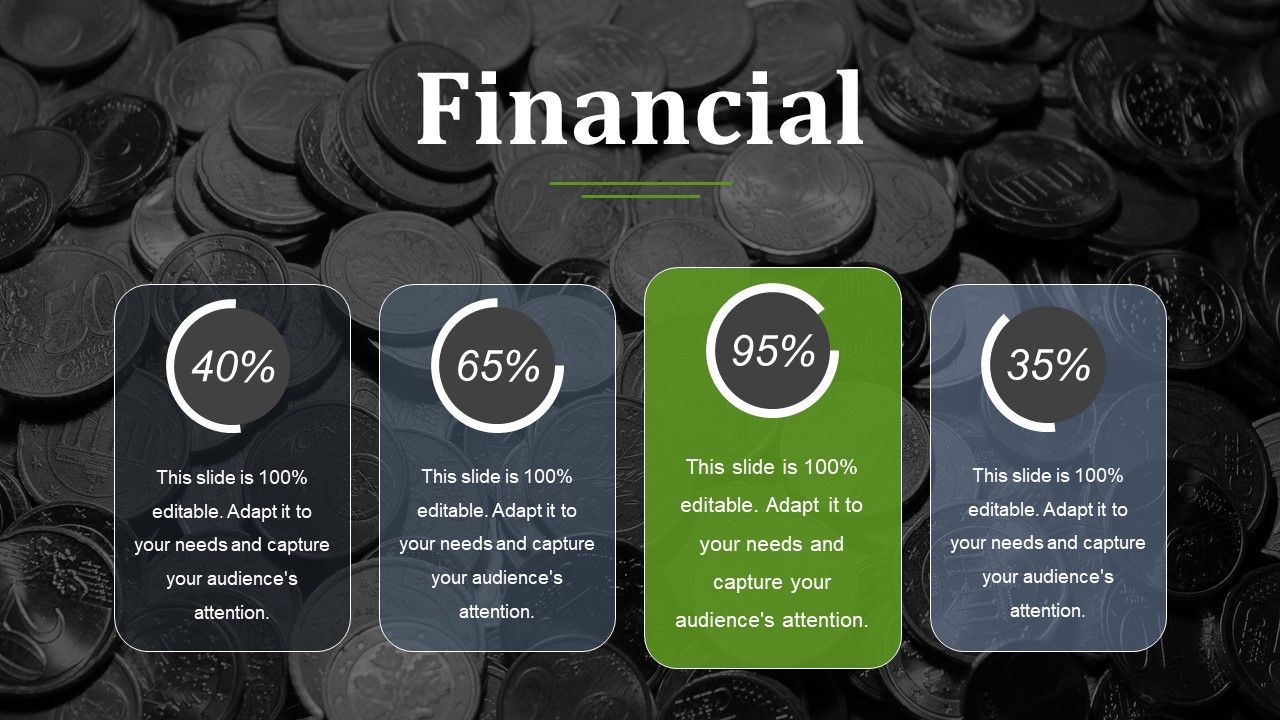
Slide 62: This is a Financial slide to state your Financial score with relevant imagery and text.
Slide 63: This is a Post It slide to mark reminders, highlights etc.
Slide 64: This is a Newspaper slide to highlight something or add memorabilia.
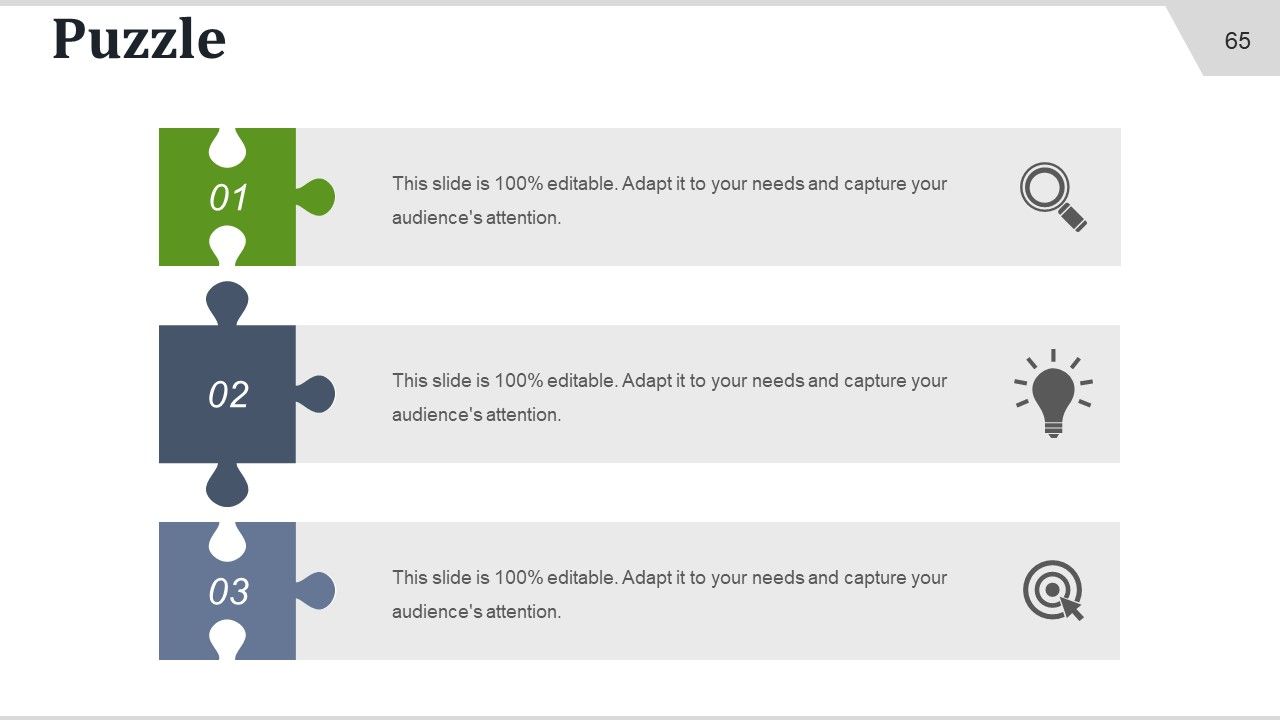
Slide 65: This is a Puzzle image slide to show information, specification etc
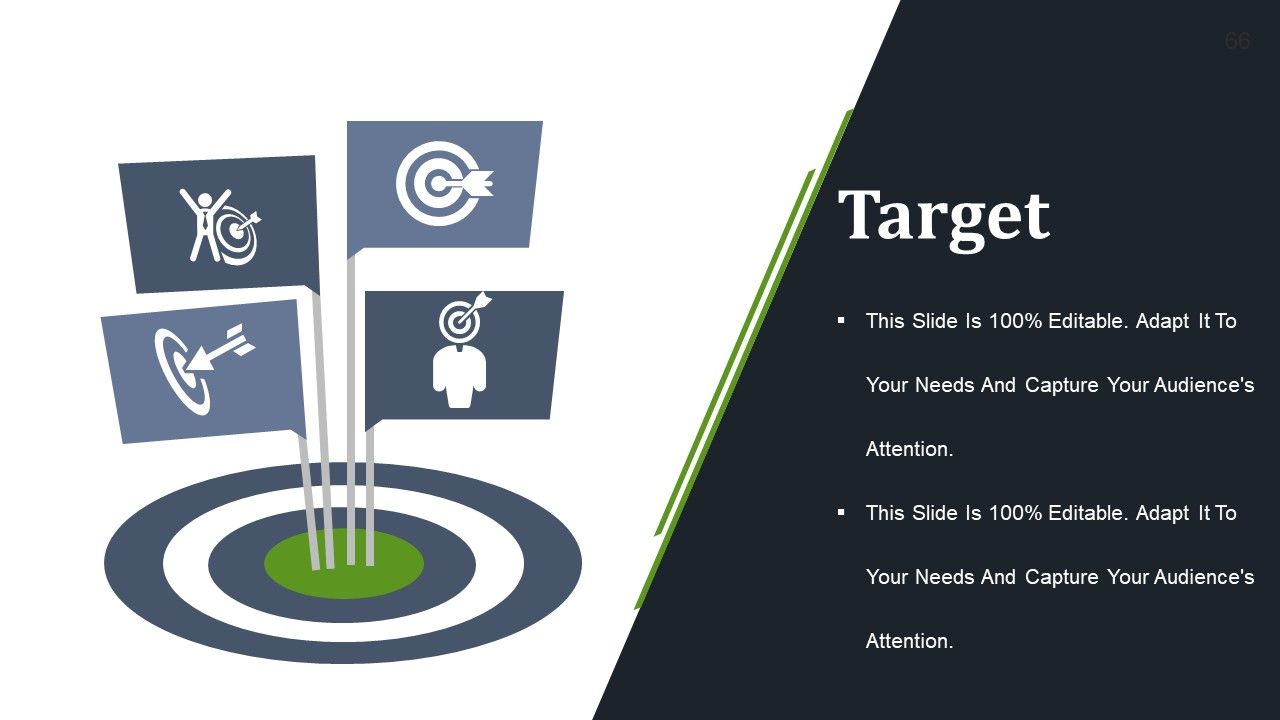
Slide 66: This is a Target slide to show targets, plans etc.
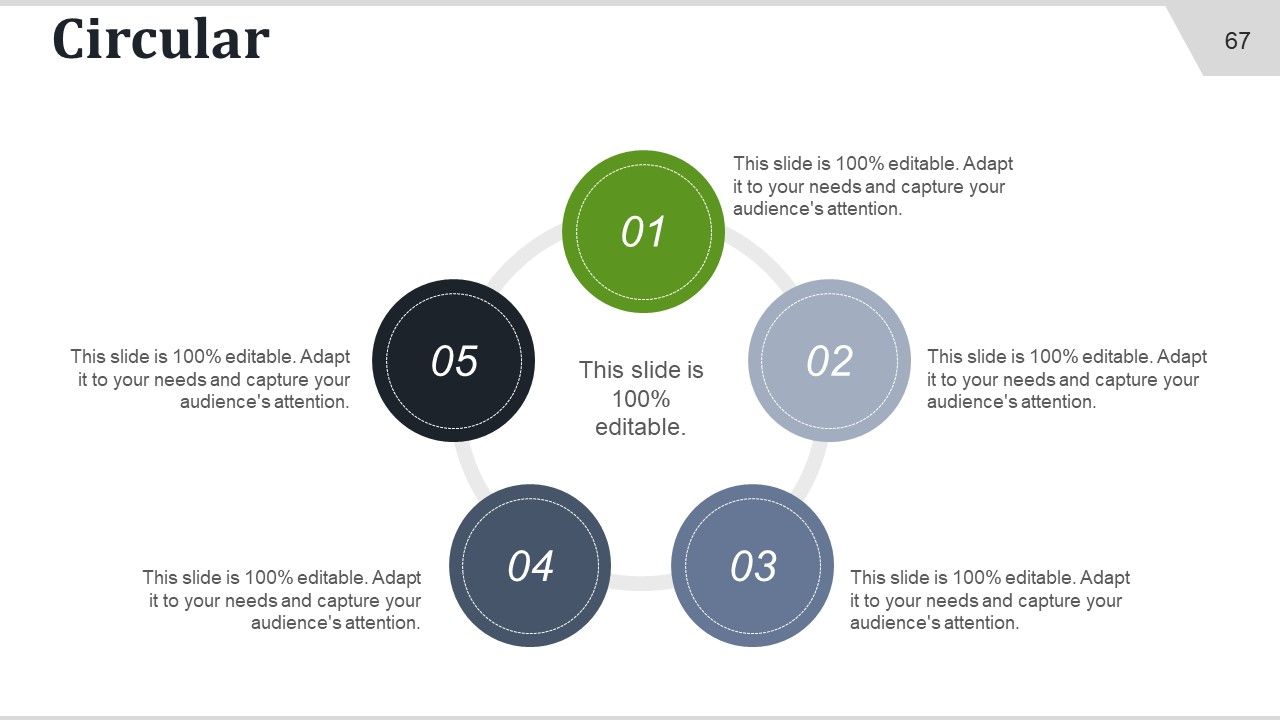
Slide 67: This is a Circular image slide to show information, specifications etc.
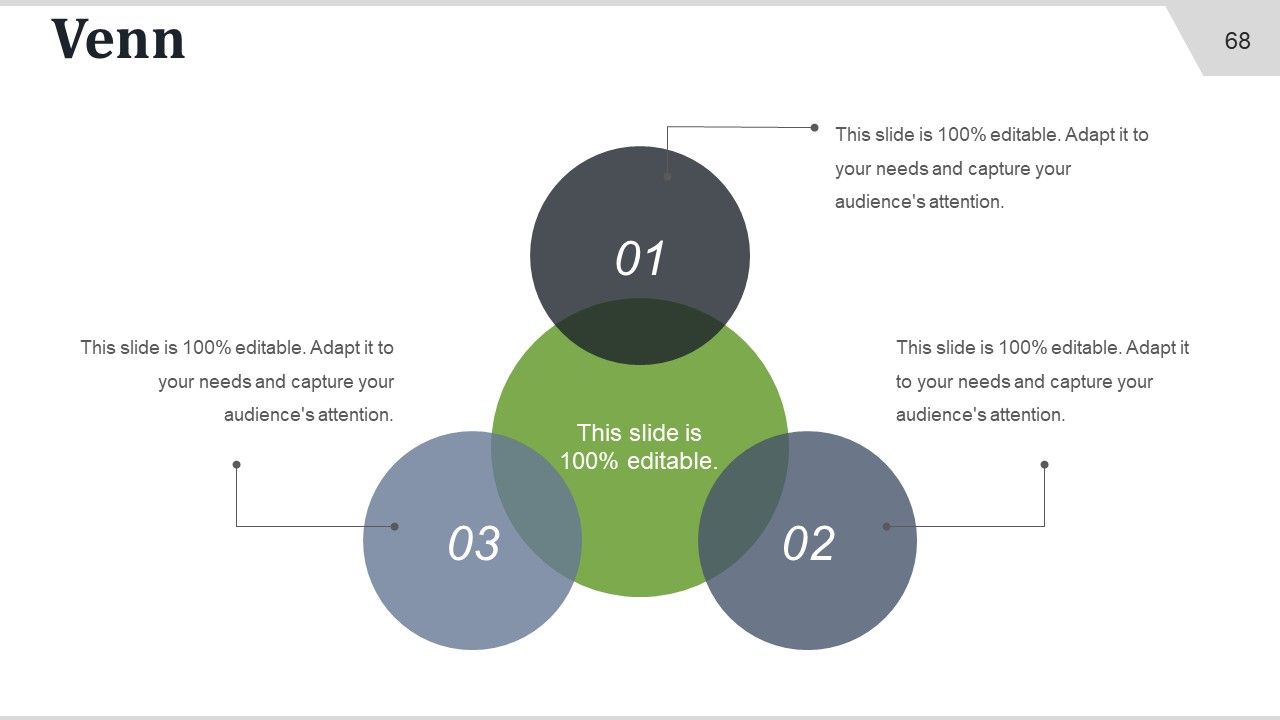
Slide 68: This is a Venn diagram image slide to show information, specifications etc.
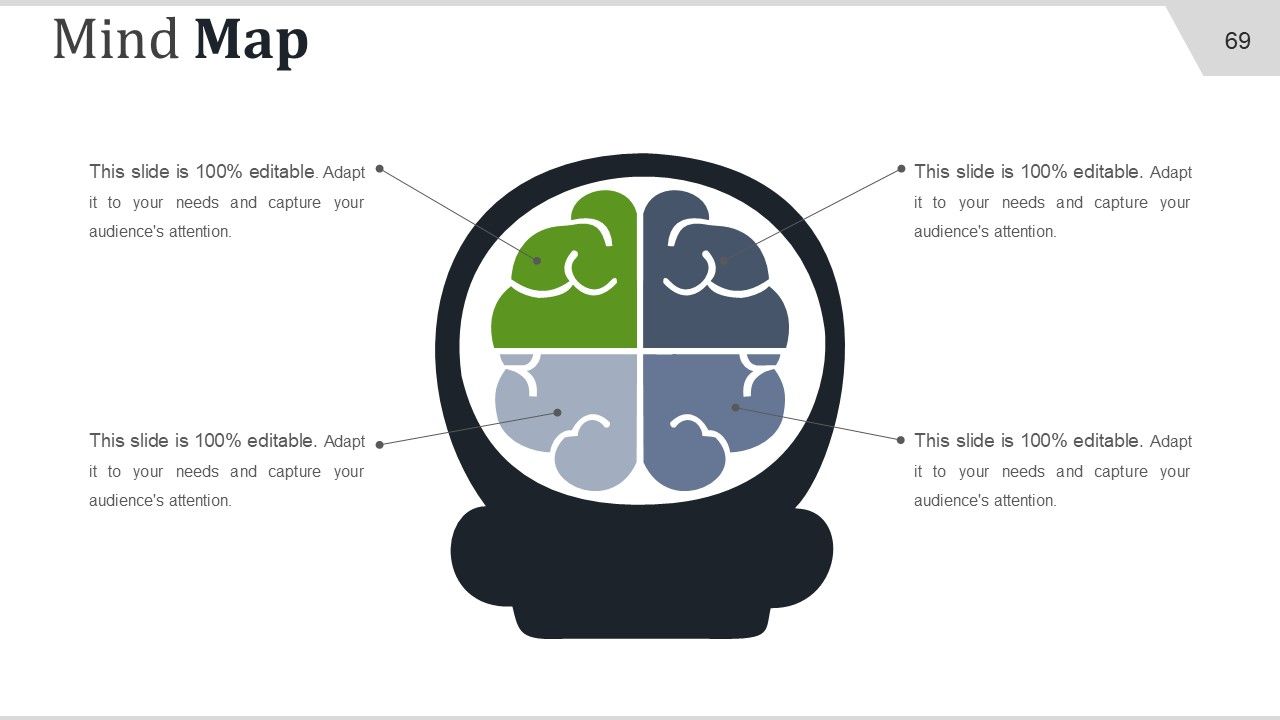
Slide 69: This slide presents a Mind map with text boxes.
Slide 70: This is a Quotes slide to convey messages, beliefs etc. You can change the slide content as per need.
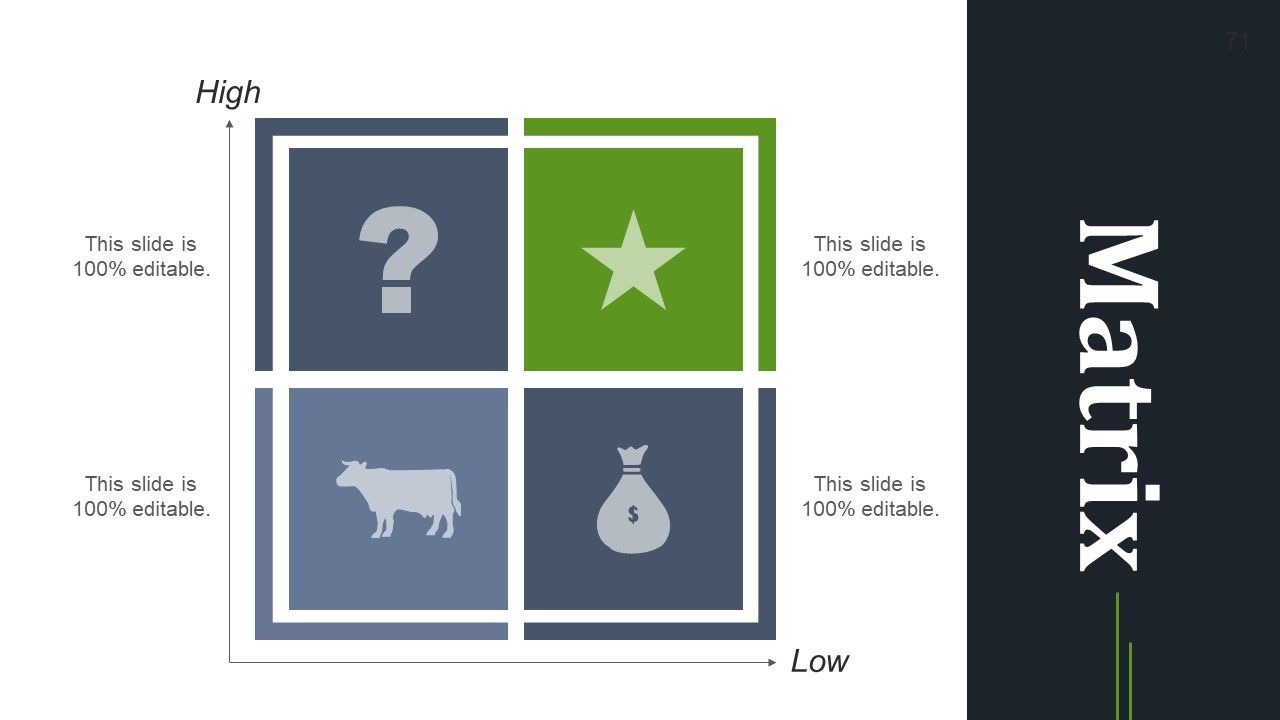
Slide 71: This is a Matrix slide to show information, specifications etc. with High and Low parameters.
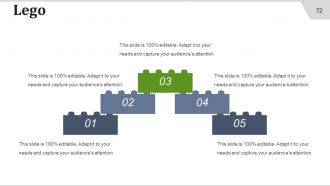
Slide 72: This is a Lego image slide to show information, specifications etc.
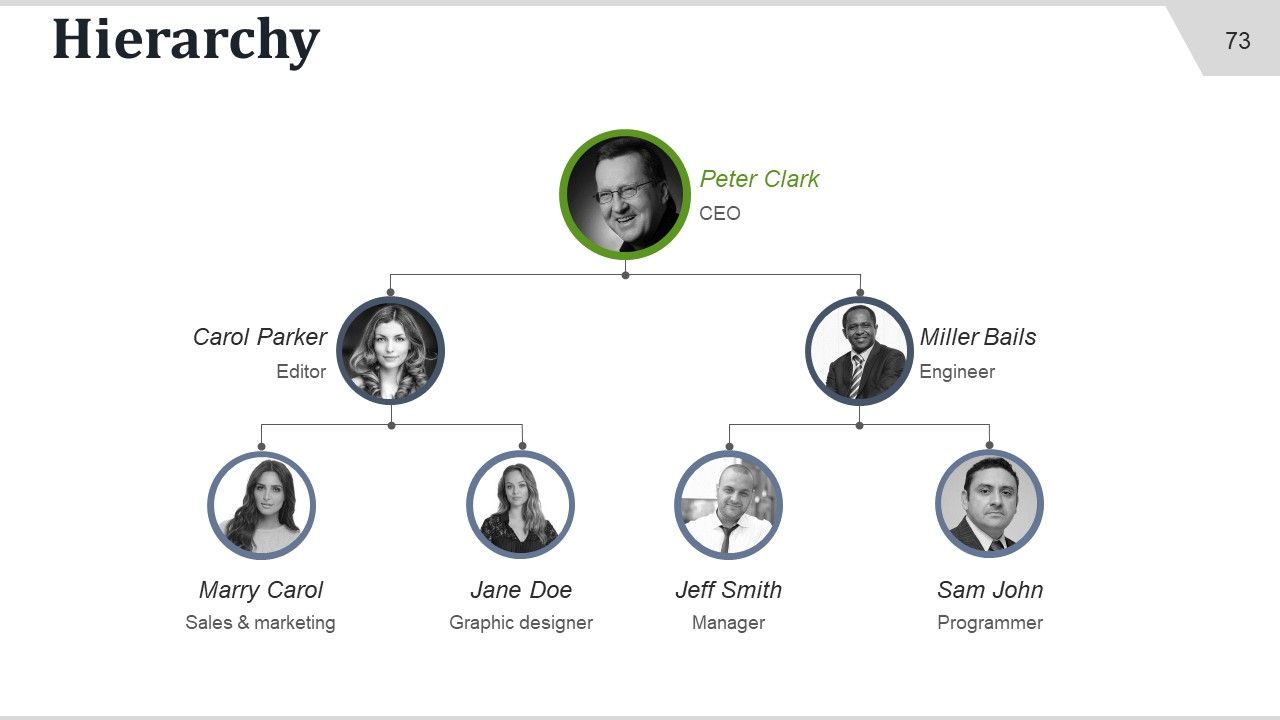
Slide 73: This is a slide Hierarchy with name, desination, images and text boxes.
Slide 74: This is a Silhouettes slide to present people oriented information, specifications etc.
Slide 75: This is a Bulb or Idea slide to state a new idea or highlight specifications/information etc.
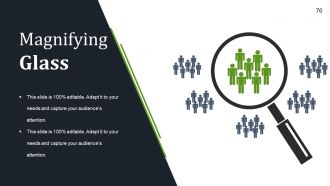
Slide 76: This is a Magnifying glass image slide to show information, scoping aspects etc.
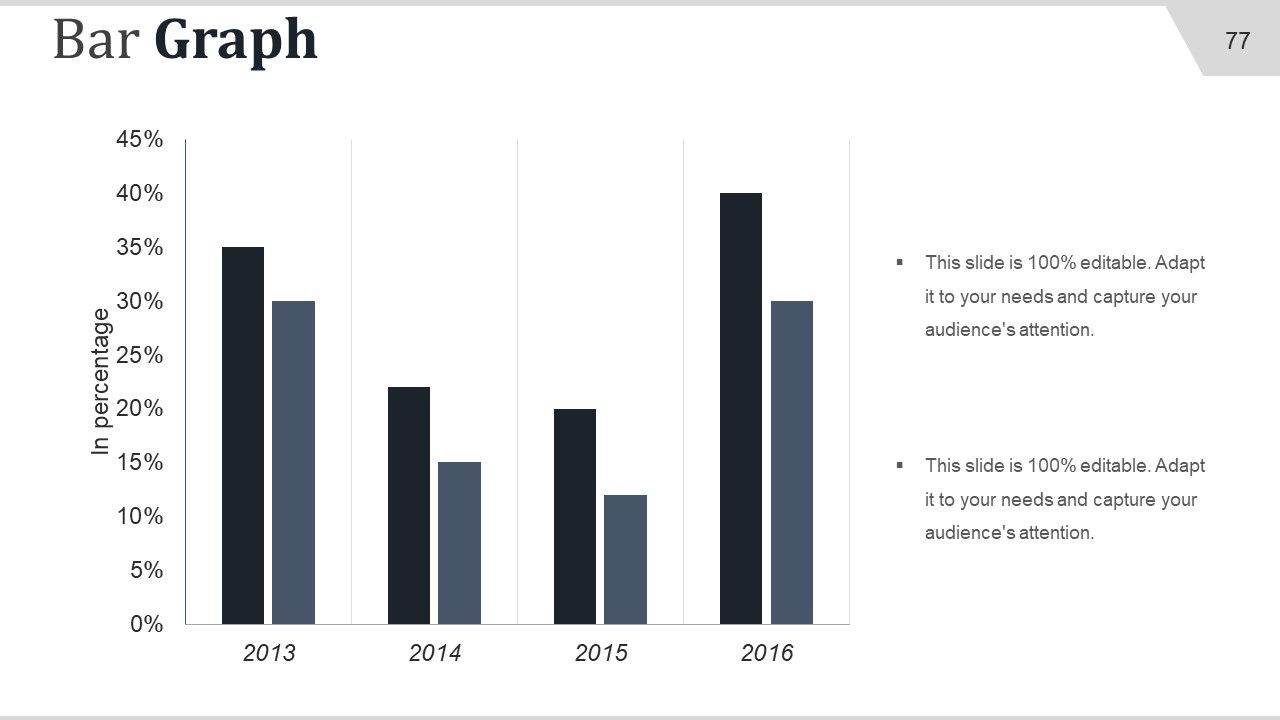
Slide 77: This is a Bar Graph image slide to show product/entity comparison, information etc.
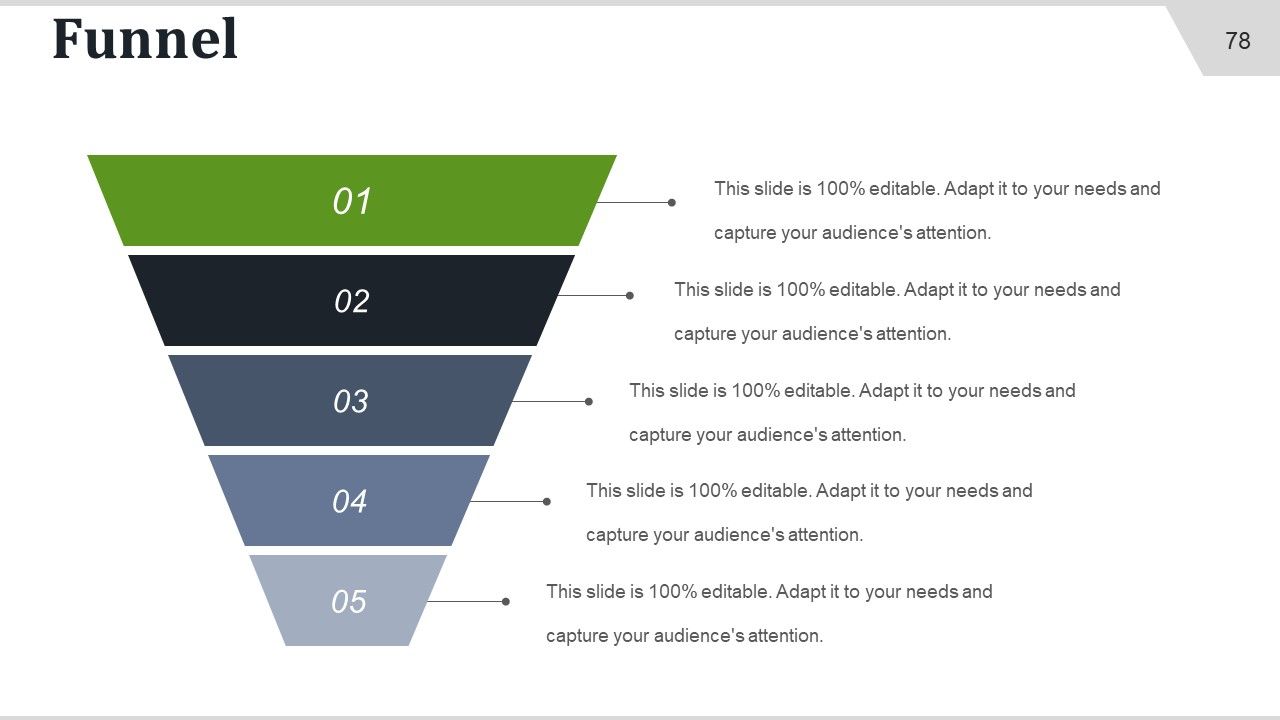
Slide 78: This slide presents a Funnel to show anything in funnel form.
Slide 79: This is a Thank You slide with Address# street number, city, state, Contact Numbers, Email Address.
Executive summary outsourcing proposal powerpoint presentation slides with all 79 slides:
Dish out the facts and figures with our Executive Summary Outsourcing Proposal Powerpoint Presentation Slides. Guide folks on calculating correctly.
-
Great designs, Easily Editable.
-
Great quality product.


