Charts, Graphs PowerPoint Designs, Presentation Charts Designs & PPT Graphics
- Sub Categories
-
- Arrows and Targets
- Bullet and Text Slides
- Charts and Graphs
- Circular Cycle Diagrams
- Concepts and Shapes
- Custom Flat Designs
- Dashboards and Measuring
- Flow Process
- Funnels
- Gears
- Growth
- Harvey Balls
- Idea Innovation and Light Bulbs
- Leadership
- Linear Process Diagrams
- Magnifying Glass
- Misc Other Graphics
- Opportunity and Handshake
- Organization Charts
- Puzzles
- Pyramids
- Roadmaps and Timelines
- Silhouettes
- Steps
- Strategic Planning Analysis
- SWOT Analysis
- Tables and Matrix
- Teamwork
- Technology and Communication
- Venn Diagrams
- Visuals and Illustrations
-
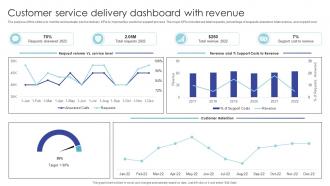 Customer Service Delivery Dashboard With Revenue
The purpose of this slide is to monitor and evaluate service delivery KPIs to improve the customer support process. The major KPIs included are total requests, percentage of requests answered, total revenue, and support cost. Presenting our well structured Customer Service Delivery Dashboard With Revenue. The topics discussed in this slide are Requests Answered, Total Revenue, Customer Service. This is an instantly available PowerPoint presentation that can be edited conveniently. Download it right away and captivate your audience.
-
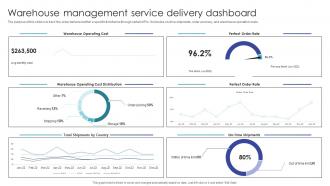 Warehouse Management Service Delivery Dashboard
The purpose of this slide is to track the order delivered within a specific timeframe through certain KPIs. It includes on time shipments, order accuracy, and warehouse operation costs. Introducing our Warehouse Management Service Delivery Dashboard set of slides. The topics discussed in these slides are Warehouse Operating Cost, Perfect Order Rate, Dashboard. This is an immediately available PowerPoint presentation that can be conveniently customized. Download it and convince your audience.
-
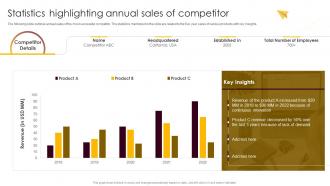 Statistics Highlighting Annual Sales Of Competitor Retail Merchandising Best Strategies For Higher
The following slide outlines annual sales of the most successful competitor. The statistics mentioned in the slide are related to the five year sales of various products with key insights.Present the topic in a bit more detail with this Statistics Highlighting Annual Sales Of Competitor Retail Merchandising Best Strategies For Higher. Use it as a tool for discussion and navigation on Product Increased, Continuous Innovation, Revenue Decreased. This template is free to edit as deemed fit for your organization. Therefore download it now.
-
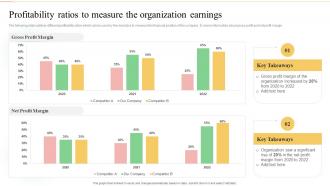 Profitability Ratios To Measure The Organization Earnings Ultimate Guide To Financial Planning
The following slide outlines different profitability ratios which can be used by the investors to measure the financial position of the company. It covers information about gross profit and net profit margin.Present the topic in a bit more detail with this Profitability Ratios To Measure The Organization Earnings Ultimate Guide To Financial Planning. Use it as a tool for discussion and navigation on Organization Increased, Profit Margin, Organization Significant. This template is free to edit as deemed fit for your organization. Therefore download it now.
-
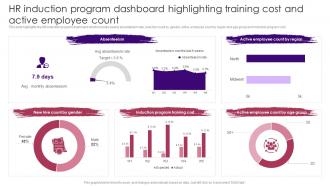 HR Induction Program Dashboard Highlighting Training Cost Staff Induction Training Guide
This slide highlights the HR induction program dashboard which includes weekly absenteeism rate, new hire count by gender, active employee count by region and age group and induction program cost. Deliver an outstanding presentation on the topic using this HR Induction Program Dashboard Highlighting Training Cost Staff Induction Training Guide. Dispense information and present a thorough explanation of Absenteeism, Induction Program, Training Cost, Active Employee using the slides given. This template can be altered and personalized to fit your needs. It is also available for immediate download. So grab it now.
-
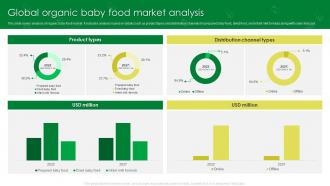 Global Organic Baby Food Market Analysis
This slide covers analysis of organic baby food market. It includes analysis based on details such as product types and distribution channels for prepared baby food, dried food, and infant milk formula along with sales forecast. Introducing our Global Organic Baby Food Market Analysis set of slides. The topics discussed in these slides are Product Types, Distribution Channel Types. This is an immediately available PowerPoint presentation that can be conveniently customized. Download it and convince your audience.
-
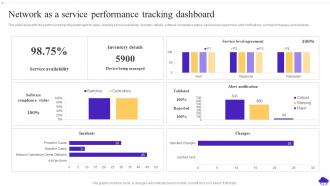 Network As A Service Performance Tracking Dashboard NaaS Ppt Powerpoint Presentation Layouts
This slide represents the performance tracking dashboard for naas, covering service availability, inventory details, software compliance status, service level agreement, alert notifications, number of changes and incidents. Present the topic in a bit more detail with this Network As A Service Performance Tracking Dashboard NaaS Ppt Powerpoint Presentation Layouts. Use it as a tool for discussion and navigation on Network Service, Performance Tracking. This template is free to edit as deemed fit for your organization. Therefore download it now.
-
 Aligning Product Portfolios Categorizing Different Products Using BCG Matrix
Following slide portrays McKinsey portfolio matrix that can be used by an organization to categorize its different product offerings with respect to market attractiveness and business strength. Deliver an outstanding presentation on the topic using this Aligning Product Portfolios Categorizing Different Products Using BCG Matrix. Dispense information and present a thorough explanation of Market, Product, Average using the slides given. This template can be altered and personalized to fit your needs. It is also available for immediate download. So grab it now.
-
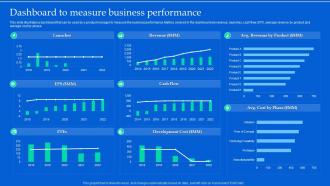 Aligning Product Portfolios Dashboard To Measure Business Performance
This slide illustrates a dashboard that can be used by a product manager to measure the business performance. Metrics covered in the dashboard are revenue, launches, cash flow, EPS, average revenue by product and average cost by phase. Present the topic in a bit more detail with this Aligning Product Portfolios Dashboard To Measure Business Performance. Use it as a tool for discussion and navigation on Launches, Revenue, Cash Flow, Development Cost. This template is free to edit as deemed fit for your organization. Therefore download it now.
-
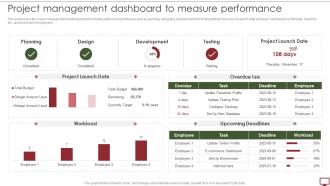 Steps To Develop Project Management Plan Project Management Dashboard To Measure Performance
This slide covers the project management dashboard which includes status of project phases such as planning, designing, development and testing that also focuses on launch date of project, overdue tasks with date, deadline, etc. and workload on employees. Deliver an outstanding presentation on the topic using this Steps To Develop Project Management Plan Project Management Dashboard To Measure Performance. Dispense information and present a thorough explanation of Design, Planning, Development, Project Launch Date using the slides given. This template can be altered and personalized to fit your needs. It is also available for immediate download. So grab it now.
-
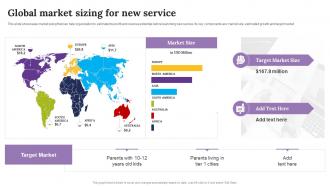 Global Market Sizing For New Service Improving Customer Outreach During New Service Launch
This slide showcases market sizing that can help organization to estimate the profit and revenue potential before launching new service. Its key components are market size, estimated growth and target market Present the topic in a bit more detail with this Global Market Sizing For New Service Improving Customer Outreach During New Service Launch. Use it as a tool for discussion and navigation on Target Market, Market Size, Global Market. This template is free to edit as deemed fit for your organization. Therefore download it now.
-
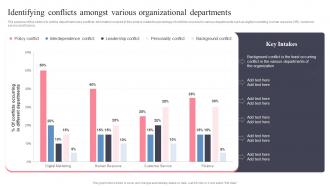 Identifying Conflicts Amongst Various Organizational Managing Workplace Conflict To Improve Employees
The purpose of this slide is to outline department wise conflicts. Information covered in this slide is related to percentage of conflicts occurred in various departments such as digital marketing, human resource HR, customer service and finance. Present the topic in a bit more detail with this Identifying Conflicts Amongst Various Organizational Managing Workplace Conflict To Improve Employees. Use it as a tool for discussion and navigation on Identifying Conflicts, Organizational Departments. This template is free to edit as deemed fit for your organization. Therefore download it now.
-
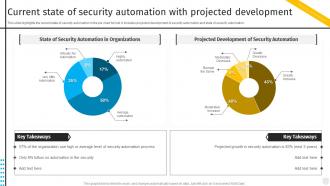 Current State Of Security Automation Projected Security Automation To Investigate And Remediate Cyberthreats
This slide highlights the current state of security automation in the pie chart format. It includes projected development of security automation and state of security automation. Deliver an outstanding presentation on the topic using this Current State Of Security Automation Projected Security Automation To Investigate And Remediate Cyberthreats. Dispense information and present a thorough explanation of Automation, Development, Process using the slides given. This template can be altered and personalized to fit your needs. It is also available for immediate download. So grab it now.
-
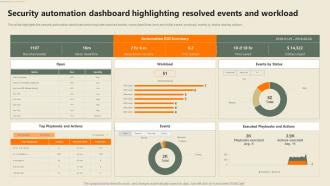 Security Automation Dashboard Highlighting Resolved Events Security Automation In Information Technology
This slide highlights the security automation dashboard which includes resolved events, mean dwell time, time and dollar saved, workload, events by status and top actions. Deliver an outstanding presentation on the topic using this Security Automation Dashboard Highlighting Resolved Events Security Automation In Information Technology. Dispense information and present a thorough explanation of Automation, Dashboard, Workload using the slides given. This template can be altered and personalized to fit your needs. It is also available for immediate download. So grab it now.
-
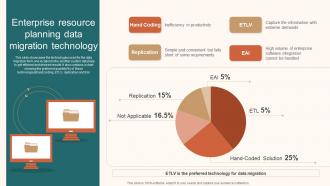 Enterprise Resource Planning Data Migration Technology
This slide showcases the technologies used for the data migration form one location to the another system database to get efficient and desired results. It also contains a chart showing the preferred quantity percentage of these technologies hand coding, ETLV, replication and EAI. Introducing our Enterprise Resource Planning Data Migration Technology set of slides. The topics discussed in these slides are Inefficiency In Productivity, Software Integration, High Volume Of Enterprise. This is an immediately available PowerPoint presentation that can be conveniently customized. Download it and convince your audience.
-
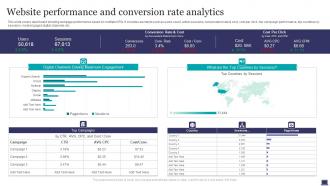 Website Performance And Conversion Rate Analytics
This slide covers dashboard showing webpage performance based on multiple KPIs. It includes elements such as users count, active sessions, conversation rate and cost, cost per click, top campaign performance, top countries by sessions, most engaged digital channels, etc. Introducing our Website Performance And Conversion Rate Analytics set of slides. The topics discussed in these slides are Website Performance, Conversion Rate Analytics. This is an immediately available PowerPoint presentation that can be conveniently customized. Download it and convince your audience.
-
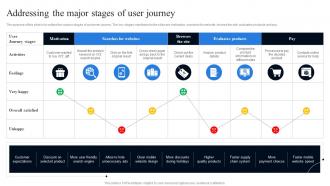 Addressing The Major Stages Of User Journey Conducting Mobile SEO Audit To Understand
The purpose of this slide is to outline the various stages of customer journey. The key stages mentioned in the slide are motivation, searches for website, browse the site, evaluates products and pay.Present the topic in a bit more detail with this Addressing The Major Stages Of User Journey Conducting Mobile SEO Audit To Understand. Use it as a tool for discussion and navigation on Evaluates Products, Unnecessary, Customer Expectations. This template is free to edit as deemed fit for your organization. Therefore download it now.
-
 Cloud Architecture And Security Review Cost Management Dashboard In Cloud Management Platform
This slide covers dashboard platform for the resource organization, resource security, auditing, and cost. It also includes reporting, dashboards, budgets, optimizations, etc. Deliver an outstanding presentation on the topic using this Cloud Architecture And Security Review Cost Management Dashboard In Cloud Management Platform. Dispense information and present a thorough explanation of Cost Management, Dashboard, Cloud Management, Platform using the slides given. This template can be altered and personalized to fit your needs. It is also available for immediate download. So grab it now.
-
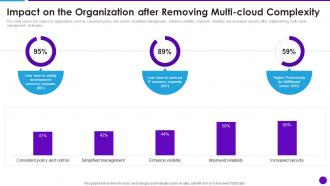 Cloud Architecture And Security Review Impact On The Organization After Removing Multi Cloud Complexity
This slide covers the impact on organization such as consistent policy and control, simplified management, enhance visibility, improved reliability and increased security after implementing multi cloud management strategies. Deliver an outstanding presentation on the topic using this Cloud Architecture And Security Review Impact On The Organization After Removing Multi Cloud Complexity. Dispense information and present a thorough explanation of Impact On The Organization, Removing Multi Cloud, Complexity using the slides given. This template can be altered and personalized to fit your needs. It is also available for immediate download. So grab it now.
-
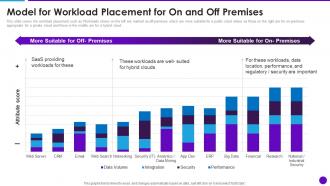 Cloud Architecture And Security Review Model For Workload Placement For On And Off Premises
This slide covers the workload placement such as Workloads shown on the left are marked as off premises which are more suitable for a public cloud where as those on the right are for on premises appropriate for a private cloud and those in the middle are for a hybrid cloud. Deliver an outstanding presentation on the topic using this Cloud Architecture And Security Review Model For Workload Placement For On And Off Premises. Dispense information and present a thorough explanation of Model For Workload, Placement, On And Off Premises using the slides given. This template can be altered and personalized to fit your needs. It is also available for immediate download. So grab it now.
-
 Industry Overview And Key Facts With Market Trends Raise Capital Through Equity Convertible Bond Financing
The slide provides the industry overview and key facts market trends of the industry. Additionally, it provides market size for the year 2014 2023 and market share 2019 of the industry Present the topic in a bit more detail with this Industry Overview And Key Facts With Market Trends Raise Capital Through Equity Convertible Bond Financing. Use it as a tool for discussion and navigation on Overview, Additionally, Market Trends. This template is free to edit as deemed fit for your organization. Therefore download it now.
-
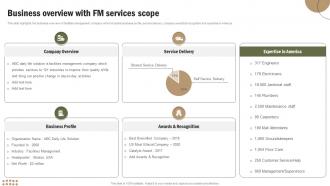 Business Overview With Fm Services Scope Office Spaces And Facility Management Service
This slide highlights the business overview of facilities management company which includes business profile, service delivery, company awards and recognition and expertise in America. Present the topic in a bit more detail with this Business Overview With Fm Services Scope Office Spaces And Facility Management Service. Use it as a tool for discussion and navigation on Company Overview, Service Delivery, Business Profile. This template is free to edit as deemed fit for your organization. Therefore download it now.
-
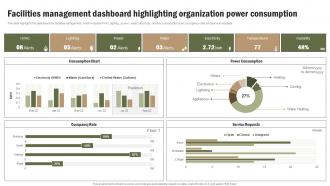 Facilities Management Dashboard Highlighting Organization Consumption Office Spaces Facility Management Service
This slide highlights the dashboard for facilities management which includes HVAC, lighting, power, water, electricity, monthly consumption chart, occupancy rate, and service requests. Present the topic in a bit more detail with this Facilities Management Dashboard Highlighting Organization Consumption Office Spaces Facility Management Service. Use it as a tool for discussion and navigation on Management, Dashboard, Organization. This template is free to edit as deemed fit for your organization. Therefore download it now.
-
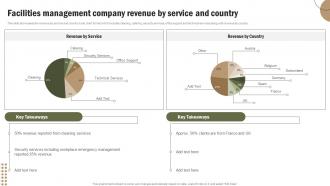 Office Spaces And Facility Management Service Facilities Management Company Revenue By Service And Country
This slide showcases the revenue by service and country in pie chart format which includes cleaning, catering, security services, office support and technical services along with revenue by country. Present the topic in a bit more detail with this Office Spaces And Facility Management Service Facilities Management Company Revenue By Service And Country. Use it as a tool for discussion and navigation on Facilities Management, Revenue, Service. This template is free to edit as deemed fit for your organization. Therefore download it now.
-
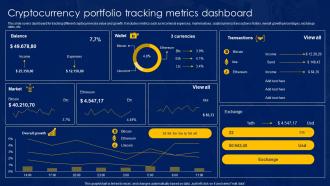 Cryptocurrency Portfolio Tracking Metrics Dashboard
This slide covers dashboard for tracking different cryptocurrencies value and growth. It includes metrics such as incomes and expenses, market values, cryptocurrency transactions history, overall growth percentages, exchange rates, etc. Introducing our Cryptocurrency Portfolio Tracking Metrics Dashboard set of slides. The topics discussed in these slides are Transactions, Currencies, Wallet, Balance. This is an immediately available PowerPoint presentation that can be conveniently customized. Download it and convince your audience.
-
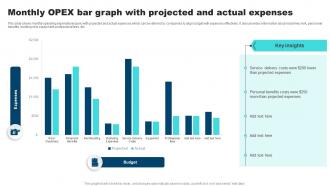 Monthly OPEX Bar Graph With Projected And Actual Expenses
This slide shows monthly operating expenditure opex with projected and actual expenses which can be referred by companies to align budget with expenses effectively. It also provides information about machinery rent, personnel benefits, building rent, equipment, professional fees, etc. Presenting our well-structured Monthly OPEX Bar Graph With Projected And Actual Expenses. The topics discussed in this slide are Monthly OPEX, Bar Graph, Projected, Actual Expenses. This is an instantly available PowerPoint presentation that can be edited conveniently. Download it right away and captivate your audience.
-
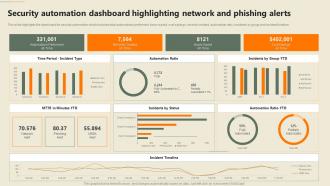 F652 Security Automation In Information Technology Security Automation Dashboard Highlighting Phishing
This slide highlights the dashboard for security automation which includes total automations performed, hours saved, cost savings, records created, automation ratio, incidents by group and incident timeline. Present the topic in a bit more detail with this F652 Security Automation In Information Technology Security Automation Dashboard Highlighting Phishing. Use it as a tool for discussion and navigation on Automation, Dashboard, Phishing Alerts. This template is free to edit as deemed fit for your organization. Therefore download it now.
-
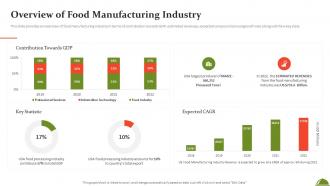 Overview Of Food Manufacturing Industry Ppt Powerpoint Presentation File Icon
This slide provides an overview of food manufacturing industry in terms of contribution towards GDP, estimated revenues, expected compound annual growth rate along with few key stats. Deliver an outstanding presentation on the topic using this Overview Of Food Manufacturing Industry Ppt Powerpoint Presentation File Icon. Dispense information and present a thorough explanation of Overview Of Food, Manufacturing, Industry using the slides given. This template can be altered and personalized to fit your needs. It is also available for immediate download. So grab it now.
-
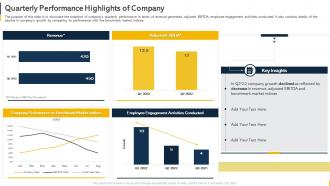 Quarterly Performance Highlights Of Company Organization Budget Forecasting
The purpose of this slide is to showcase the snapshot of companys quarterly performance in terms of revenue generated, adjusted EBITDA, employee engagement activities conducted. It also contains details of the decline in companys growth by comparing its performance with the benchmark market indices. Present the topic in a bit more detail with this Quarterly Performance Highlights Of Company Organization Budget Forecasting. Use it as a tool for discussion and navigation on Quarterly Performance, Highlights Of Company, Benchmark Market. This template is free to edit as deemed fit for your organization. Therefore download it now.
-
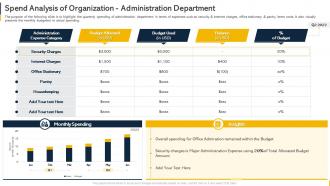 Spend Analysis Of Organization Administration Department Organization Budget Forecasting
The purpose of the following slide is to highlight the quarterly spending of administration department in terms of expenses such as security and internet charges, office stationary and pantry items costs. It also visually presents the monthly budgeted vs actual spending. Deliver an outstanding presentation on the topic using this Spend Analysis Of Organization Administration Department Organization Budget Forecasting. Dispense information and present a thorough explanation of Spend Analysis, Organization, Administration Department using the slides given. This template can be altered and personalized to fit your needs. It is also available for immediate download. So grab it now.
-
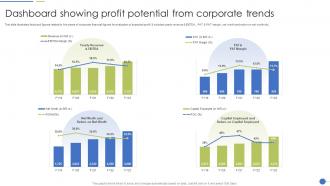 Dashboard Snapshot Showing Profit Potential From Corporate Trends
This slide illustrates facts and figures related to five years of corporate financial figures for evaluation of expected profit. It includes yearly revenue and EBITDA, PAT and PAT margin, net worth and return on net worth etc. Presenting our well structured Dashboard Showing Profit Potential From Corporate Trends. The topics discussed in this slide are Dashboard, Profit Potential, Corporate Trends. This is an instantly available PowerPoint presentation that can be edited conveniently. Download it right away and captivate your audience.
-
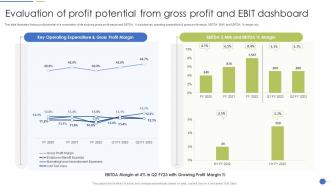 Evaluation Of Profit Potential From Gross Profit And EBIT Dashboard
This slide illustrates finding profit potential of a corporation while studying gross profit margin and EBITDA. It includes key operating expenditure and gross profit margin, EBITDA dollar MM and EBITDA percentage margin etc. Introducing our Evaluation Of Profit Potential From Gross Profit And EBIT Dashboard set of slides. The topics discussed in these slides are Evaluation Of Profit Potential, Gross Profit, EBIT Dashboard. This is an immediately available PowerPoint presentation that can be conveniently customized. Download it and convince your audience.
-
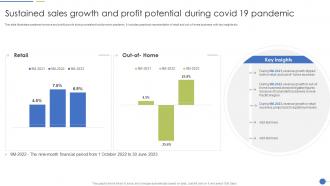 Sustained Sales Growth And Profit Potential During COVID 19 Pandemic
This slide illustrates sustained revenue and profit growth during consistent lockdowns in pandemic. It includes graphical representation of retail and out of home business with key insights etc. Introducing our Sustained Sales Growth And Profit Potential During COVID 19 Pandemic set of slides. The topics discussed in these slides are Sustained Sales, Growth And Profit Potential. This is an immediately available PowerPoint presentation that can be conveniently customized. Download it and convince your audience.
-
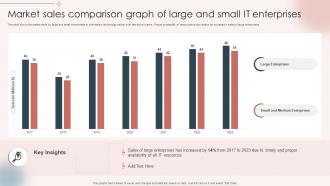 Market Sales Comparison Graph Of Large And Small IT Enterprises
This slide shows the sales made by large and small enterprises in information technology sector over last seven years . Proper availability of resources is key reason for increase in sales of large enterprises. Introducing our Market Sales Comparison Graph Of Large And Small IT Enterprises set of slides. The topics discussed in these slides are Market Sales, Comparison Graph, Small IT Enterprises. This is an immediately available PowerPoint presentation that can be conveniently customized. Download it and convince your audience.
-
 Revenue Graph Of ABC Bank Across Global Market
This slide illustrates information about revenue generated by ABC bank in last eight years across global market. Continuous digitalization is the main contributing factor for the same. Presenting our well structured Revenue Graph Of ABC Bank Across Global Market. The topics discussed in this slide are Revenue Graph, Global Market. This is an instantly available PowerPoint presentation that can be edited conveniently. Download it right away and captivate your audience.
-
 Stock Market Graph For Analyzing Investment Behavior
This slides shows the amount invested in stock market in last six years. It includes the comparison of investment in equity and debentures. Introducing our Stock Market Graph For Analyzing Investment Behavior set of slides. The topics discussed in these slides are Stock Market, Graph For Analyzing, Investment Behavior. This is an immediately available PowerPoint presentation that can be conveniently customized. Download it and convince your audience.
-
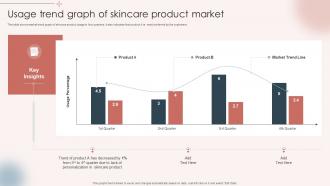 Usage Trend Graph Of Skincare Product Market
This slide shows market trend graph of skincare product usage in four quarters. It also indicates that product A is most preferred by the customers Presenting our well structured Usage Trend Graph Of Skincare Product Market. The topics discussed in this slide are Usage Trend Graph, Skincare Product Market. This is an instantly available PowerPoint presentation that can be edited conveniently. Download it right away and captivate your audience.
-
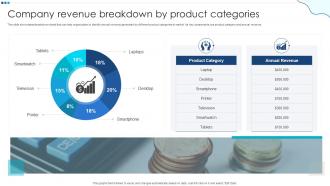 Company Revenue Breakdown By Product Categories
This slide showcases breakdown sheet that can help organization to identify annual revenue generated by different product categories in market. Its key components are product category and annual revenue Presenting our well structured Company Revenue Breakdown By Product Categories. The topics discussed in this slide are Company Revenue Breakdown, Product Categories. This is an instantly available PowerPoint presentation that can be edited conveniently. Download it right away and captivate your audience.
-
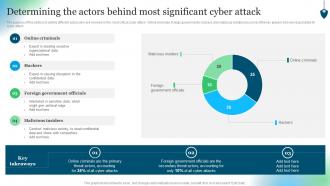 Determining The Actors Behind Most Significant Cyber Attack Conducting Security Awareness
The purpose of this slide is to outline different actors who are involved in the most critical cyber attack. Online criminals, foreign governments, hackers and malicious insiders are some of the key players who are responsible for cyber attack. Deliver an outstanding presentation on the topic using this Determining The Actors Behind Most Significant Cyber Attack Conducting Security Awareness. Dispense information and present a thorough explanation of Online Criminals, Foreign Government Officials, Malicious Insiders using the slides given. This template can be altered and personalized to fit your needs. It is also available for immediate download. So grab it now.
-
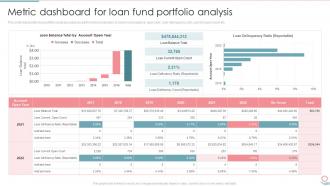 Metric Dashboard For Loan Fund Portfolio Analysis Ppt Show Example Introduction
This slide represents loan portfolio analysis using key performance indicators. It covers loan balance, open year, loan delinquency ratio, current open count etc. Present the topic in a bit more detail with this Metric Dashboard For Loan Fund Portfolio Analysis Ppt Show Example Introduction. Use it as a tool for discussion and navigation on Portfolio, Analysis, Dashboard. This template is free to edit as deemed fit for your organization. Therefore download it now.
-
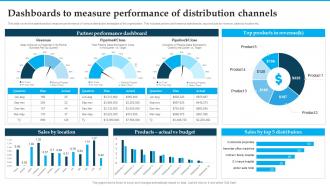 Dashboards To Measure Performance Of Distribution Distribution Strategies For Increasing Sales
This slide covers the dashboards to measure performance of various distribution strategies of the organization. This includes partner performance dashboards, top products by revenue, sales by location etc. Present the topic in a bit more detail with this Dashboards To Measure Performance Of Distribution Distribution Strategies For Increasing Sales. Use it as a tool for discussion and navigation on Measure, Performance, Distribution Channels. This template is free to edit as deemed fit for your organization. Therefore download it now.
-
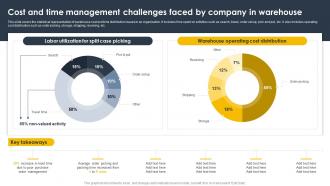 Cost And Time Management Challenges Faced By Company In Warehouse Supply Chain And Logistics
This slide covers the statistical representation of warehouse cost and time distribution issues in an organization. It includes time spent on activities such as search, travel, order set up, pick and put, etc. It also includes operating cost distribution such as order picking, storage, shipping, receiving, etc.Present the topic in a bit more detail with this Cost And Time Management Challenges Faced By Company In Warehouse Supply Chain And Logistics. Use it as a tool for discussion and navigation on Order Management, Packing Increased, Operating Distribution. This template is free to edit as deemed fit for your organization. Therefore download it now.
-
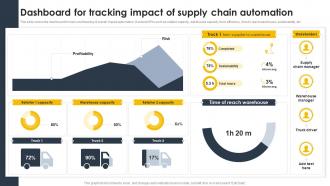 Dashboard For Tracking Impact Of Supply Chain Automation Supply Chain And Logistics Automation
This slide covers the dashboard for back end tracking of overall impact automation. It include KPIs such as retailer capacity, warehouse capacity, truck efficiency, time to reach warehouse, sustainability, etc.Present the topic in a bit more detail with this Dashboard For Tracking Impact Of Supply Chain Automation Supply Chain And Logistics Automation. Use it as a tool for discussion and navigation on Warehouse Capacity, Profitability, Supplier Warehouse. This template is free to edit as deemed fit for your organization. Therefore download it now.
-
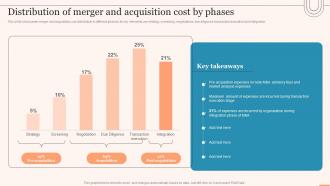 Distribution Of Merger And Acquisition Cost By Phases Evaluating Global Market
This slide showcases merger and acquisition cost distribution in different phases. Its key elements are strategy, screening, negotiations, due diligence, transaction execution and integration. Present the topic in a bit more detail with this Distribution Of Merger And Acquisition Cost By Phases Evaluating Global Market. Use it as a tool for discussion and navigation on Distribution Of Merger, Acquisition Cost. This template is free to edit as deemed fit for your organization. Therefore download it now.
-
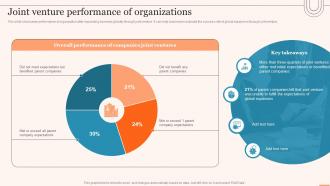 Joint Venture Performance Of Organizations Evaluating Global Market
This slide showcases performance of organization after expanding business globally through joint venture. It can help business to evaluate the success rate of global expansion through joint venture. Deliver an outstanding presentation on the topic using this Joint Venture Performance Of Organizations Evaluating Global Market. Dispense information and present a thorough explanation of Overall Performance, Companies Joint Ventures, Company Expectations using the slides given. This template can be altered and personalized to fit your needs. It is also available for immediate download. So grab it now.
-
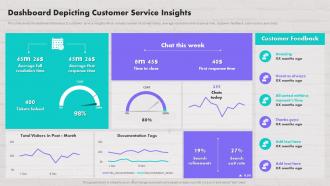 Dashboard Depicting Customer Service Insights Customer Contact Strategy To Drive Maximum Sales
This slide shows the dashboard that depicts customer service insights which includes number of solved tickets, average resolution and response time, customer feedback, total visitors and chats. Present the topic in a bit more detail with this Dashboard Depicting Customer Service Insights Customer Contact Strategy To Drive Maximum Sales. Use it as a tool for discussion and navigation on Dashboard, Response, Average Resolution. This template is free to edit as deemed fit for your organization. Therefore download it now.
-
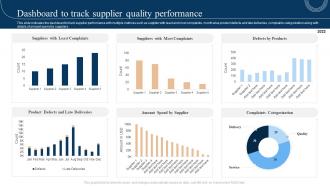 Dashboard To Track Supplier Quality Performance Strategic Sourcing And Vendor Quality Enhancement Plan
This slide indicates the dashboard to track supplier performance with multiple metrices such as supplier with least and most complaints, month wise product defects and late deliveries, complaints categorization along with details of amount spend by suppliers. Deliver an outstanding presentation on the topic using this Dashboard To Track Supplier Quality Performance Strategic Sourcing And Vendor Quality Enhancement Plan. Dispense information and present a thorough explanation of Dashboard, Performance, Complaints Categorization using the slides given. This template can be altered and personalized to fit your needs. It is also available for immediate download. So grab it now.
-
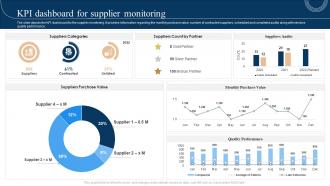 Kpi Dashboard For Supplier Monitoring Strategic Sourcing And Vendor Quality Enhancement Plan
The slide depicts the KPI dashboard for the supplier monitoring. It provides information regarding the monthly purchase value, number of contracted suppliers, scheduled and completed audits along with vendors quality performance. Present the topic in a bit more detail with this Kpi Dashboard For Supplier Monitoring Strategic Sourcing And Vendor Quality Enhancement Plan. Use it as a tool for discussion and navigation on Dashboard, Provides Information, Performance. This template is free to edit as deemed fit for your organization. Therefore download it now.
-
 Performance Analysis Of Business Suppliers Strategic Sourcing And Vendor Quality Enhancement Plan
The slide represents the dashboard to illustrates the existing performance of business suppliers. It includes information regarding the suppliers availability, defect rate, compliance rate, sourcing time along with the efficiency details. Present the topic in a bit more detail with this Performance Analysis Of Business Suppliers Strategic Sourcing And Vendor Quality Enhancement Plan. Use it as a tool for discussion and navigation on Performance, Analysis, Business Suppliers. This template is free to edit as deemed fit for your organization. Therefore download it now.
-
 KPI Dashboard For Workforce Diversity Analysis
This slide shows the workforce diversity graph of an organization. It can be used to present headcount of workforce diversity in the firm. Presenting our well structured KPI Dashboard For Workforce Diversity Analysis. The topics discussed in this slide are Workforce Cost, Workforce Diversity, Temporary Workers Analysis . This is an instantly available PowerPoint presentation that can be edited conveniently. Download it right away and captivate your audience.
-
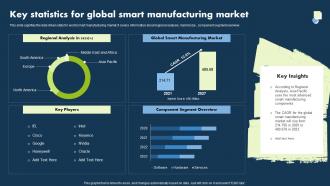 Key Statistics For Global Smart Manufacturing Market
This slide signifies the data driven stats for world smart manufacturing market. It covers information about regional analysis, market size , component segment overview. Introducing our Key Statistics For Global Smart Manufacturing Market set of slides. The topics discussed in these slides are Regional Analysis, Key Players, Component Segment Overview, Global Smart Manufacturing Market. This is an immediately available PowerPoint presentation that can be conveniently customized. Download it and convince your audience.
-
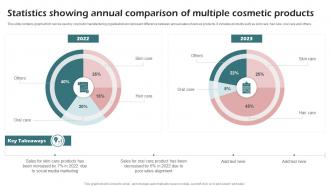 Statistics Showing Annual Comparison Of Multiple Cosmetic Products
This slide contains graph which can be used by cosmetic manufacturing organizations to represent difference between annual sales of various products. It includes products such as skin care, hair care, oral care and others. Presenting our well structured Statistics Showing Annual Comparison Of Multiple Cosmetic Products. The topics discussed in this slide are Social Media Marketing, Poor Sales Alignment, Care Product. This is an instantly available PowerPoint presentation that can be edited conveniently. Download it right away and captivate your audience.
-
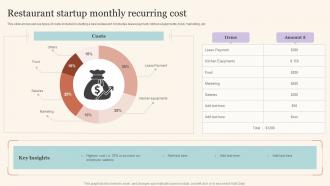 Restaurant Startup Monthly Recurring Cost
This slide shows various types of costs included in starting a new restaurant. It includes lease payment, kitchen equipments, food, marketing, etc. Introducing our Restaurant Startup Monthly Recurring Cost set of slides. The topics discussed in these slides are Lease Payment, Cost, Kitchen Equipments. This is an immediately available PowerPoint presentation that can be conveniently customized. Download it and convince your audience.
-
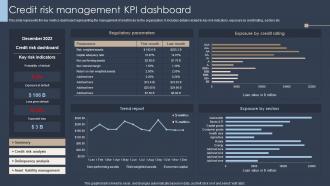 Credit Risk Management Kpi Dashboard Erm Program Ppt Show Visual Aids
This slide represents the key metrics dashboard representing the management of credit risks by the organization. It includes details related to key risk indicators, exposure by credit rating, sectors etc. Deliver an outstanding presentation on the topic using this Credit Risk Management Kpi Dashboard Erm Program Ppt Show Visual Aids. Dispense information and present a thorough explanation of Management, Dashboard, Risk Indicators using the slides given. This template can be altered and personalized to fit your needs. It is also available for immediate download. So grab it now.
-
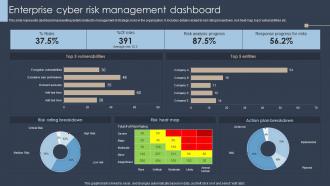 Enterprise Cyber Risk Management Dashboard Erm Program Ppt Show Infographics
This slide represents dashboard representing details related to management of strategic risks in the organization. It includes details related to risk rating breakdown, risk heat map, top 5 vulnerabilities etc. Deliver an outstanding presentation on the topic using this Enterprise Cyber Risk Management Dashboard Erm Program Ppt Show Infographics. Dispense information and present a thorough explanation of Enterprise, Management, Dashboard using the slides given. This template can be altered and personalized to fit your needs. It is also available for immediate download. So grab it now.
-
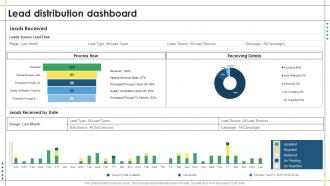 Lead Management Process To Drive More Sales Lead Distribution Dashboard
Deliver an outstanding presentation on the topic using this Lead Management Process To Drive More Sales Lead Distribution Dashboard. Dispense information and present a thorough explanation of Distribution, Dashboard, Sources using the slides given. This template can be altered and personalized to fit your needs. It is also available for immediate download. So grab it now.
-
 Dashboard Depicting Sales And Customer Analytics Approaches To Merchandise Planning
This slide focuses on dashboard that depicts sales and customer analytics which covers sales revenue, average transaction rate, out of stock items, sales by division, monthly visitors, etc. Present the topic in a bit more detail with this Dashboard Depicting Sales And Customer Analytics Approaches To Merchandise Planning. Use it as a tool for discussion and navigation on Sales Revenue, Total Customers, Sales Division. This template is free to edit as deemed fit for your organization. Therefore download it now.
-
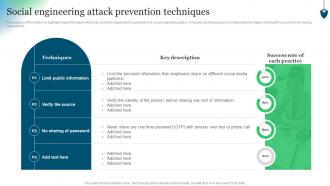 Social Engineering Attack Prevention Techniques Conducting Security Awareness
The purpose of this slide is to highlight major techniques which can assist the organization in prevention of social engineering attack. It includes techniques such as limit public information, verifying the source and no sharing of password. Present the topic in a bit more detail with this Social Engineering Attack Prevention Techniques Conducting Security Awareness. Use it as a tool for discussion and navigation on Techniques, Limit Public Information, Verify Source. This template is free to edit as deemed fit for your organization. Therefore download it now.
-
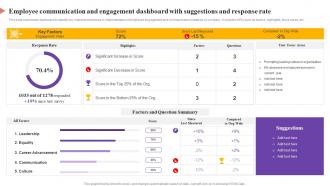 Employee Communication And Engagement Dashboard With Suggestions And Response Rate
This slide showcases dashboard to identify key improvement areas in implementation of employee engagement and communication initiatives by company. It includes KPIs such as factors, highlights, focus areas, etc. Presenting our well-structured Employee Communication And Engagement Dashboard With Suggestions And Response Rate. The topics discussed in this slide are Employee Communication, Engagement Dashboard, Suggestions Response Rate. This is an instantly available PowerPoint presentation that can be edited conveniently. Download it right away and captivate your audience.
-
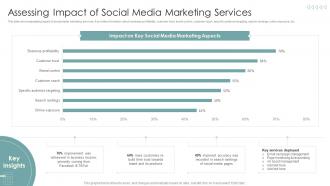 Assessing Impact Of Social Media Marketing Strategies To Improve Marketing Through Social Networks
This slide shows assessing impact of social media marketing services. It provides information about business profitability, customer trust, brand control, customer reach, specific audience targeting, search rankings, online exposure, etc. Deliver an outstanding presentation on the topic using this Assessing Impact Of Social Media Marketing Strategies To Improve Marketing Through Social Networks. Dispense information and present a thorough explanation of Marketing, Services, Business Profitability using the slides given. This template can be altered and personalized to fit your needs. It is also available for immediate download. So grab it now.


