Charts, Graphs PowerPoint Designs, Presentation Charts Designs & PPT Graphics
- Sub Categories
-
- Arrows and Targets
- Bullet and Text Slides
- Charts and Graphs
- Circular Cycle Diagrams
- Concepts and Shapes
- Custom Flat Designs
- Dashboards and Measuring
- Flow Process
- Funnels
- Gears
- Growth
- Harvey Balls
- Idea Innovation and Light Bulbs
- Leadership
- Linear Process Diagrams
- Magnifying Glass
- Misc Other Graphics
- Opportunity and Handshake
- Organization Charts
- Puzzles
- Pyramids
- Roadmaps and Timelines
- Silhouettes
- Steps
- Strategic Planning Analysis
- SWOT Analysis
- Tables and Matrix
- Teamwork
- Technology and Communication
- Venn Diagrams
- Visuals and Illustrations
-
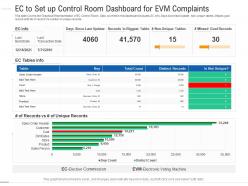 Ec to set up control room dashboard for evm complaints powerpoint template
This slide Covers the Graphical Representation of EC Control Room. Data covered in this dashboard includes-EC info, Days since last Update ,Non unique tables, Misses goal record with No of record Vs number of unique records. This is a EC To Set Up Control Room Dashboard For EVM Complaints Powerpoint Template drafted with a diverse set of graphics, that can be reformulated and edited as per your needs and requirements. Just download it in your system and make use of it in PowerPoint or Google Slides, depending upon your presentation preferences.
-
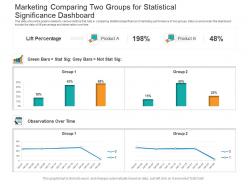 Marketing comparing two groups for statistical significance dashboard powerpoint template
This slide shows the graphs related to various metrics that help in comparing statistical significance of marketing performance of two groups. Data covered under this dashboard include the data of lift percentage and observation over time. This is a Marketing Comparing Two Groups For Statistical Significance Dashboard Powerpoint Template drafted with a diverse set of graphics, that can be reformulated and edited as per your needs and requirements. Just download it in your system and make use of it in PowerPoint or Google Slides, depending upon your presentation preferences.
-
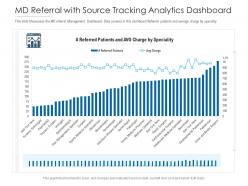 Md referral with source tracking analytics dashboard powerpoint template
This slide Showcases the MD referral Management Dashboard. Data covered in this dashboard Referred patients and average charge by specialty. This is a MD Referral With Source Tracking Analytics Dashboard Powerpoint Template drafted with a diverse set of graphics, that can be reformulated and edited as per your needs and requirements. Just download it in your system and make use of it in PowerPoint or Google Slides, depending upon your presentation preferences.
-
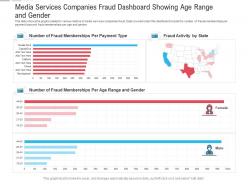 Media services companies fraud dashboard showing age range and gender powerpoint template
This slide shows the graphs related to various metrics of media services companies fraud. Data covered under this dashboard include the number of frauds memberships per payment type and fraud memberships per age and gender. This is a Media Services Companies Fraud Dashboard Showing Age Range And Gender Powerpoint Template featuring in built editable components to add your personal touches. Tailor this template as per your liking and display it on a widescreen or standard screen, the choice is yours.
-
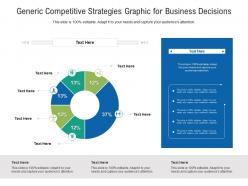 Generic competitive strategies graphic for business decisions infographic template
Deploy our Generic Competitive Strategies Graphic For Business Decisions Infographic Template to present high-quality presentations. It is designed in PowerPoint and is available for immediate download in standard and widescreen sizes. Not only this, but this layout is also 100 percent editable, giving you full control over its applications.
-
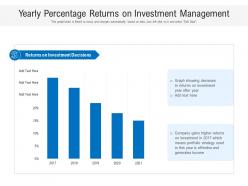 Yearly percentage returns on investment management
Presenting our well-structured Yearly Percentage Returns On Investment Management. The topics discussed in this slide are Graph Showing Decrease In Returns On Investment Year After Year. This is an instantly available PowerPoint presentation that can be edited conveniently. Download it right away and captivate your audience.
-
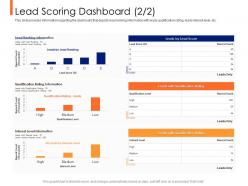 Lead ranking mechanism lead scoring dashboard ppt powerpoint presentation slides maker
This slide provides information regarding the dashboard that depicts lead ranking information with leads qualification rating, leads interest level, etc. Present the topic in a bit more detail with this Lead Ranking Mechanism Lead Scoring Dashboard Ppt Powerpoint Presentation Slides Maker. Use it as a tool for discussion and navigation on Lead Scoring Dashboard. This template is free to edit as deemed fit for your organization. Therefore download it now.
-
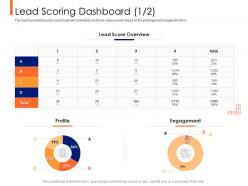 Lead ranking mechanism lead scoring dashboard total ppt powerpoint presentation icon example
The dashboard will provide overall scenario of all leads and track various leads based on the grading point assigned to them. Present the topic in a bit more detail with this Lead Ranking Mechanism Lead Scoring Dashboard Total Ppt Powerpoint Presentation Icon Example. Use it as a tool for discussion and navigation on Lead Score Overview, Profile, Engagement. This template is free to edit as deemed fit for your organization. Therefore download it now.
-
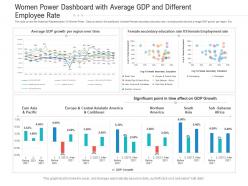 Women power dashboard with average gdp and different employee rate powerpoint template
This slide covers the Graphical Representation Of Women Power. Data covered in this dashboard includes-Female secondary education rate vs employment rate and average GDP growth per region Etc. This is Women Power Dashboard With Average GDP And Different Employee Rate Powerpoint Template with high quality vector based graphics, that can be edited as per your business needs. You can also reproduce this slide in various formats, be it PNG, JPG, etc. This slide also comes with an additional feature of portrayal on standard and widescreen aspect ratios, thus retaining its high quality.
-
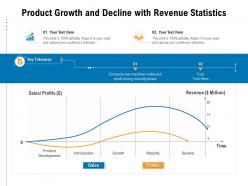 Product growth and decline with revenue statistics
Introducing our Product Growth And Decline With Revenue Statistics set of slides. The topics discussed in these slides are Sales, Profits, Revenue. This is an immediately available PowerPoint presentation that can be conveniently customized. Download it and convince your audience.
-
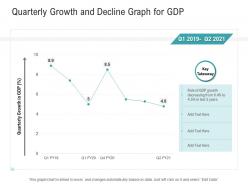 Quarterly growth and decline graph for gdp
Introducing our Quarterly Growth And Decline Graph For GDP set of slides. The topics discussed in these slides are Quarterly Growth And Decline Graph For GDP. This is an immediately available PowerPoint presentation that can be conveniently customized. Download it and convince your audience.
-
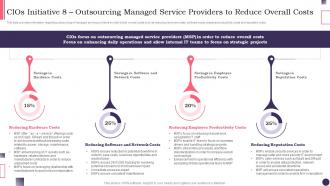 CIOS Handbook For IT CIOS Initiative 8 Outsourcing Managed Service Providers To Reduce Overall Costs
This slide provides information regarding outsourcing of managed service providers in order to limit overall costs such as reducing hardware costs, software costs, employee productivity costs and reputation costs. Present the topic in a bit more detail with this CIOS Handbook For IT CIOS Initiative 8 Outsourcing Managed Service Providers To Reduce Overall Costs. Use it as a tool for discussion and navigation on Reducing Hardware Costs, Outsourcing Managed Service, Reducing Reputation Costs. This template is free to edit as deemed fit for your organization. Therefore download it now.
-
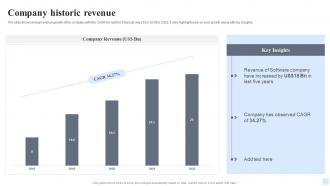 Company Historic Revenue Software Consultancy Services Company Profile Ppt Diagrams
The slide shows annual revenue growth of the company with the CAGR for last five financial years from 2018 to 2022. It also highlights year on year growth along with key insights. Present the topic in a bit more detail with this Company Historic Revenue Software Consultancy Services Company Profile Ppt Diagrams. Use it as a tool for discussion and navigation on Company Historic, Revenue, Software Company. This template is free to edit as deemed fit for your organization. Therefore download it now.
-
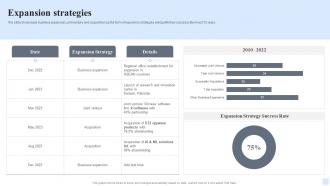 Expansion Strategies Software Consultancy Services Company Profile Ppt Introduction
The slide showcases business expansion, joint venture and acquisition as the form of expansion strategies along with their success rate in last 12 years. Present the topic in a bit more detail with this Expansion Strategies Software Consultancy Services Company Profile Ppt Introduction. Use it as a tool for discussion and navigation on Expansion Strategy, Business Expansion. This template is free to edit as deemed fit for your organization. Therefore download it now.
-
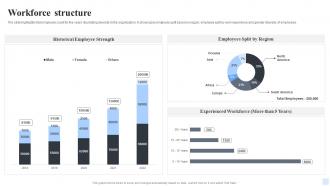 Workforce Structure Software Consultancy Services Company Profile Ppt Icons
The slide highlights total employee count for five years illustrating diversity in the organization. It showcases employee split based on region, employee split by work experience and gender diversity of employees. Present the topic in a bit more detail with this Workforce Structure Software Consultancy Services Company Profile Ppt Icons. Use it as a tool for discussion and navigation on Historical Employee Strength, Workforce Structure. This template is free to edit as deemed fit for your organization. Therefore download it now.
-
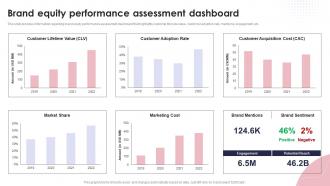 Brand Equity Performance Assessment Dashboard Ppt Powerpoint Presentation Gallery Icons
This slide provides information regarding brand equity performance assessment dashboard that highlights customer lifecycle value, customer adoption rate, mentions, engagement, etc. Present the topic in a bit more detail with this Brand Equity Performance Assessment Dashboard Ppt Powerpoint Presentation Gallery Icons. Use it as a tool for discussion and navigation on Customer Lifetime Value, Customer Adoption Rate, Customer Acquisition. This template is free to edit as deemed fit for your organization. Therefore download it now.
-
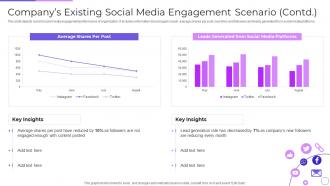 Companys Existing Social Media Engagement Contd Engaging Customer Communities Through Social
This slide depicts current social media engagement performance of organization. It includes information about organic reach, average shares per post, new likes and followers and leads generated from social media platforms. Present the topic in a bit more detail with this Companys Existing Social Media Engagement Contd Engaging Customer Communities Through Social. Use it as a tool for discussion and navigation on Engagement, Performance, Organization. This template is free to edit as deemed fit for your organization. Therefore download it now.
-
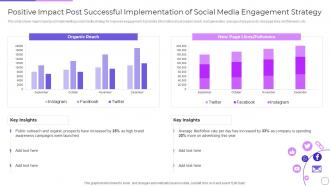 Positive Impact Post Successful Implementation Of Social Engaging Customer Communities Through Social
This slide shows major impact post implementing social media strategy for improved engagement. It provides information about organic reach, lead generation, average share per post, new page likes and followers, etc. Deliver an outstanding presentation on the topic using this Positive Impact Post Successful Implementation Of Social Engaging Customer Communities Through Social. Dispense information and present a thorough explanation of Successful, Implementation, Engagement using the slides given. This template can be altered and personalized to fit your needs. It is also available for immediate download. So grab it now.
-
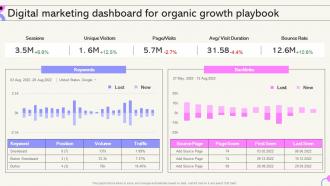 Digital Marketing Dashboard For Organic Growth Playbook Internal Sales Growth Strategy Playbook
Deliver an outstanding presentation on the topic using this Digital Marketing Dashboard For Organic Growth Playbook Internal Sales Growth Strategy Playbook. Dispense information and present a thorough explanation of Marketing, Dashboard, Growth using the slides given. This template can be altered and personalized to fit your needs. It is also available for immediate download. So grab it now.
-
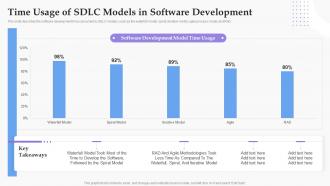 Time Usage Of SDLC Models In Software Development Ppt Demonstration
This slide describes the software development time consumed by SDLC models, such as the waterfall model, spiral, iterative model, agile process model, and RAD. Present the topic in a bit more detail with this Time Usage Of SDLC Models In Software Development Ppt Demonstration. Use it as a tool for discussion and navigation on Time Usage, SDLC Models, Software Development. This template is free to edit as deemed fit for your organization. Therefore download it now.
-
 Effective Recruitment Dashboard Depicting Social Media Recruitment Metrics
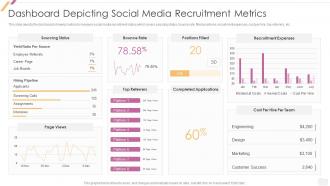
This slide depicts the dashboard showing metrics to measure social media recruitment status which covers sourcing status, bounce rate, filled positions, recruitment expenses, cost per hire, top referrers, etc. Deliver an outstanding presentation on the topic using this Effective Recruitment Dashboard Depicting Social Media Recruitment Metrics. Dispense information and present a thorough explanation of Sourcing Status, Bounce Rate, Positions Filled, Recruitment Expenses using the slides given. This template can be altered and personalized to fit your needs. It is also available for immediate download. So grab it now.
-
 Effective Recruitment Impact Of Employee Advocacy Programs On Social Recruiting
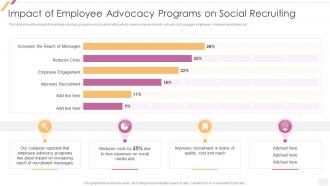
This slide shows the impact of employee advocacy programs on social recruiting which covers increase in reach, reduces cost, engages employees, improves recruitment, etc. Deliver an outstanding presentation on the topic using this Effective Recruitment Impact Of Employee Advocacy Programs On Social Recruiting. Dispense information and present a thorough explanation of Increases, Reach Messages, Reduces Costs, Employee Engagement using the slides given. This template can be altered and personalized to fit your needs. It is also available for immediate download. So grab it now.
-
 Key Issues Related To Sales And Conversion Rate Product Planning Process
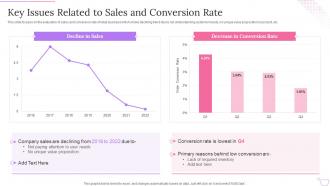
This slide focuses on the evaluation of sales and conversion rate of retail business which shows declining trend due to not understanding customer needs, no unique value proposition in product, etc. Present the topic in a bit more detail with this Key Issues Related To Sales And Conversion Rate Product Planning Process. Use it as a tool for discussion and navigation on Decline Sales, Decrease Conversion Rate, 2016 To 2022. This template is free to edit as deemed fit for your organization. Therefore download it now.
-
 Product Planning Process Impact Of Merchandising Plan On Retail Performance
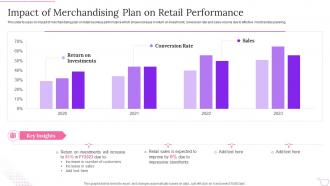
This slide focuses on impact of merchandising plan on retail business performance which shows increase in return on investment, conversion rate and sales volume due to effective merchandise planning. Present the topic in a bit more detail with this Product Planning Process Impact Of Merchandising Plan On Retail Performance. Use it as a tool for discussion and navigation on Return Investments, Conversion Rate, Sales, 2020 to 2023. This template is free to edit as deemed fit for your organization. Therefore download it now.
-
 Product Planning Process Retail Analytics Dashboard To Measure Merchandise Planning
This slide shows the retail analytics dashboard to measure merchandise planning effectiveness which includes conversion rate, sell-through rate, return on investment, website traffic, abandonment rate, etc. Present the topic in a bit more detail with this Product Planning Process Retail Analytics Dashboard To Measure Merchandise Planning. Use it as a tool for discussion and navigation on Conversation Rate, Sell Through Rate, Online. This template is free to edit as deemed fit for your organization. Therefore download it now.
-
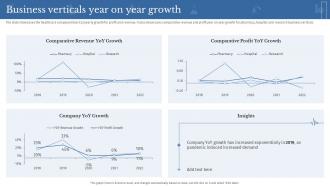 Business Verticals Year On Year Growth Clinical Medicine Research Company Profile
The slide showcases the healthcare company historical yearly growth for profit and revenue. It also showcases comparative revenue and profit year on year growth for pharmacy, hospital and research business verticals Deliver an outstanding presentation on the topic using this Business Verticals Year On Year Growth Clinical Medicine Research Company Profile. Dispense information and present a thorough explanation of Business, Growth, Comparative using the slides given. This template can be altered and personalized to fit your needs. It is also available for immediate download. So grab it now.
-
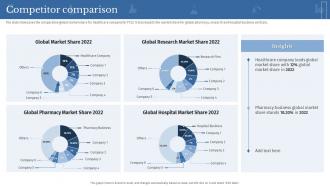 Clinical Medicine Research Company Profile Competitor Comparison
The slide showcases the comparative global market share for healthcare company for FY22. It also depicts the market share for global pharmacy, research and hospital business verticals. Present the topic in a bit more detail with this Clinical Medicine Research Company Profile Competitor Comparison. Use it as a tool for discussion and navigation on Competitor, Comparison, Business. This template is free to edit as deemed fit for your organization. Therefore download it now.
-
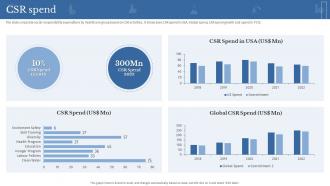 Csr Spend Clinical Medicine Research Company Profile
The slide corporate social responsibility expenditure by healthcare group based on CSR activities. It showcases CSR spend in USA, Global spend, CSR spend growth and spend in FY22. Deliver an outstanding presentation on the topic using this Csr Spend Clinical Medicine Research Company Profile. Dispense information and present a thorough explanation of Corporate, Social Responsibility, Expenditure using the slides given. This template can be altered and personalized to fit your needs. It is also available for immediate download. So grab it now.
-
 Gross Profit And Margin Clinical Medicine Research Company Profile
The slide describes gross profit share for FY22 from pharmacy, hospital and research business verticals and historical gross profit growth and margin along with description of statistical data Deliver an outstanding presentation on the topic using this Gross Profit And Margin Clinical Medicine Research Company Profile. Dispense information and present a thorough explanation of Management, Research, Business using the slides given. This template can be altered and personalized to fit your needs. It is also available for immediate download. So grab it now.
-
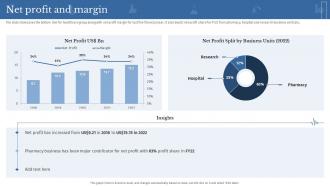 Net Profit And Margin Clinical Medicine Research Company Profile
The slide showcases the bottom line for healthcare group along with net profit margin for last five financial year. It also depict net profit share for FY22 from pharmacy, hospital and research business verticals. Present the topic in a bit more detail with this Net Profit And Margin Clinical Medicine Research Company Profile. Use it as a tool for discussion and navigation on Pharmacy Business, Contributor, Business Verticals. This template is free to edit as deemed fit for your organization. Therefore download it now.
-
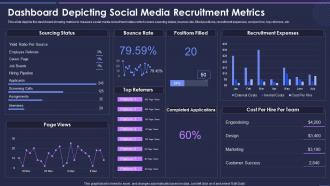 Strategic Process For Social Media Dashboard Depicting Social Media Recruitment Metrics
This slide depicts the dashboard showing metrics to measure social media recruitment status which covers sourcing status, bounce rate, filled positions, recruitment expenses, cost per hire, top referrers, etc. Present the topic in a bit more detail with this Strategic Process For Social Media Dashboard Depicting Social Media Recruitment Metrics. Use it as a tool for discussion and navigation on Sourcing Status, Bounce Rate, Positions Filled, Recruitment Expenses. This template is free to edit as deemed fit for your organization. Therefore download it now.
-
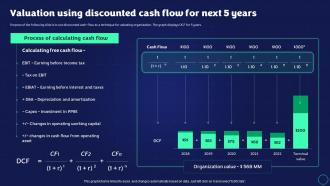 Exit Strategy Strategic Plan Valuation Using Discounted Cash Flow For Next 5 Years
Purpose of the following slide is to use discounted cash-flow as a technique for valuating organization. The graph displays DCF for 5 years. Present the topic in a bit more detail with this Exit Strategy Strategic Plan Valuation Using Discounted Cash Flow For Next 5 Years. Use it as a tool for discussion and navigation on Operating Asset, Organization Value, 2018 To 2022. This template is free to edit as deemed fit for your organization. Therefore download it now.
-
 Exit Strategy Strategic Plan KPIs To Effectively Measure Organization Debt
The purpose of the following slide is to show the various KPIs that are used to measure the creditors of the organization such as Age summary, Credit Dyas and purchase vs Paid Graph. Deliver an outstanding presentation on the topic using this Exit Strategy Strategic Plan KPIs To Effectively Measure Organization Debt. Dispense information and present a thorough explanation of Creditors Days, Bank Balance, Purchased VS Paid using the slides given. This template can be altered and personalized to fit your needs. It is also available for immediate download. So grab it now.
-
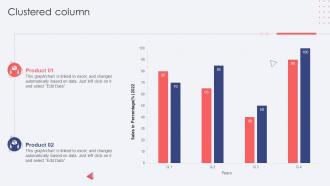 Clustered Column Ecommerce Website Development
Present the topic in a bit more detail with this Clustered Column Ecommerce Website Development. Use it as a tool for discussion and navigation on Clustered Column, Product. This template is free to edit as deemed fit for your organization. Therefore download it now.
-
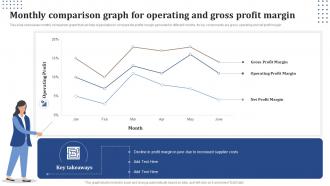 Monthly Comparison Graph For Operating And Gross Profit Margin
This slide showcases monthly comparison graph that can help organization to compare the profits margin generated in different months. Its key components are gross, operating and net profit margin. Introducing our Monthly Comparison Graph For Operating And Gross Profit Margin set of slides. The topics discussed in these slides are Gross Profit Margin, Operating Profit Margin, Net Profit Margin. This is an immediately available PowerPoint presentation that can be conveniently customized. Download it and convince your audience.
-
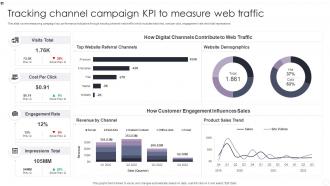 Tracking Channel Campaign KPI To Measure Web Traffic
This slide covers measuring campaign key performance indicators through tracking channel web traffic which includes total visit, cost per click, engagement rate and total impressions. Introducing our Tracking Channel Campaign KPI To Measure Web Traffic set of slides. The topics discussed in these slides are Customer Engagement, Revenue Channel, Engagement Rate, Visits Total. This is an immediately available PowerPoint presentation that can be conveniently customized. Download it and convince your audience.
-
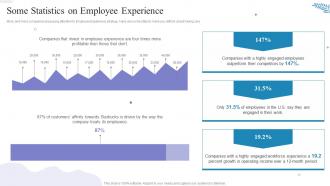 Some Statistics On Employee Experience How To Build A High Performing Workplace Culture
More and more companies are paying attention to Employee Experience strategy. Here are some stats to make you rethink about having one. Present the topic in a bit more detail with this Some Statistics On Employee Experience How To Build A High Performing Workplace Culture. Use it as a tool for discussion and navigation on Employee, Experience, Workforce. This template is free to edit as deemed fit for your organization. Therefore download it now.
-
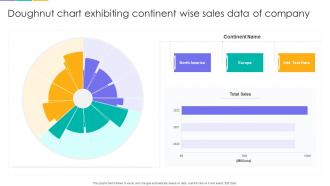 Doughnut Chart Exhibiting Continent Wise Sales Data Of Company
Introducing our Doughnut Chart Exhibiting Continent Wise Sales Data Of Company set of slides. The topics discussed in these slides are Doughnut Chart, Exhibiting Continent, Sales Data Company. This is an immediately available PowerPoint presentation that can be conveniently customized. Download it and convince your audience.
-
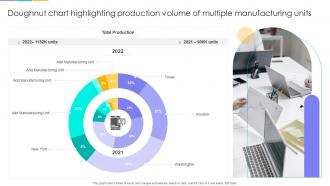 Doughnut Chart Highlighting Production Volume Of Multiple Manufacturing Units
Presenting our well-structured Doughnut Chart Highlighting Production Volume Of Multiple Manufacturing Units. The topics discussed in this slide are Doughnut Chart, Production Volume, Manufacturing Units. This is an instantly available PowerPoint presentation that can be edited conveniently. Download it right away and captivate your audience.
-
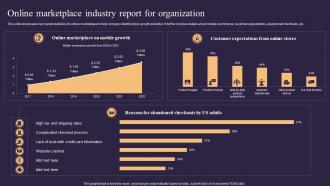 Online Marketplace Industry Report For Organization
This slide showcases key market statistics for online marketplace to help company identify future growth potential. It further incudes details about mobile ecommerce, customer expectations, abandoned checkouts, etc. Presenting our well-structured Online Marketplace Industry Report For Organization. The topics discussed in this slide are Online Marketplace, Industry Report, Organization. This is an instantly available PowerPoint presentation that can be edited conveniently. Download it right away and captivate your audience.
-
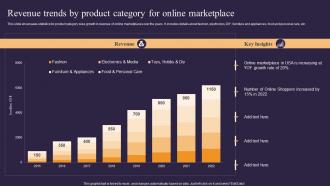 Revenue Trends By Product Category For Online Marketplace
This slide showcases statistics for product category wise growth in revenue of online marketplaces over the years. It includes details about fashion, electronics, DIY, furniture and appliances, food and personal care, etc. Introducing our Revenue Trends By Product Category For Online Marketplace set of slides. The topics discussed in these slides are Revenue Trends, Product Category, Online Marketplace. This is an immediately available PowerPoint presentation that can be conveniently customized. Download it and convince your audience.
-
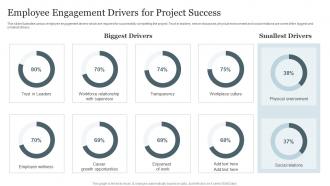 Employee Engagement Drivers For Project Success
This slide illustrates various employee engagement drivers which are required for successfully completing the project. Trust in leaders, sense of purpose, physical environment and social relations are some of the biggest and smallest drivers. Introducing our Employee Engagement Drivers For Project Success set of slides. The topics discussed in these slides are Transparency, Workplace Culture, Enjoyment Work, Employee Wellness. This is an immediately available PowerPoint presentation that can be conveniently customized. Download it and convince your audience.
-
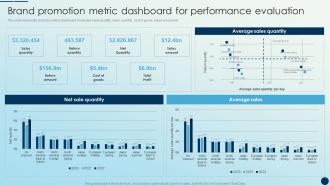 Brand Promotion Metric Dashboard For Performance Evaluation Brand Promotion Strategies
This slide represents brand promotion dashboard. It includes sales quantity, return quantity, cost of goods, return amount etc. Present the topic in a bit more detail with this Brand Promotion Metric Dashboard For Performance Evaluation Brand Promotion Strategies. Use it as a tool for discussion and navigation on Average Sales Quantity, Sale Quantity, Average Sales. This template is free to edit as deemed fit for your organization. Therefore download it now.
-
 Brand Performance Overview Market Share And Strategic Marketing Plan To Increase
Purpose of this slide is to address information about brand performance. Information covered are of competitors, product market share and performance status. Present the topic in a bit more detail with this Brand Performance Overview Market Share And Strategic Marketing Plan To Increase. Use it as a tool for discussion and navigation on Brand Performance Overview, Competitors, Performance Status. This template is free to edit as deemed fit for your organization. Therefore download it now.
-
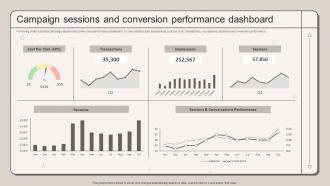 Campaign Sessions And Conversion Performance Dashboard Strategic Marketing Plan To Increase
Following slide illustrates campaign session and conversion performance dashboard. It covers details such as revenues, cost per click, transactions, impressions, sessions and conversion performance. Present the topic in a bit more detail with this Campaign Sessions And Conversion Performance Dashboard Strategic Marketing Plan To Increase. Use it as a tool for discussion and navigation on Campaign Sessions, Conversion Performance. This template is free to edit as deemed fit for your organization. Therefore download it now.
-
 Line Chart Strategic Marketing Plan To Increase Positive Brand Perception Branding
Deliver an outstanding presentation on the topic using this Line Chart Strategic Marketing Plan To Increase Positive Brand Perception Branding. Dispense information and present a thorough explanation of Line Chart, Product using the slides given. This template can be altered and personalized to fit your needs. It is also available for immediate download. So grab it now.
-
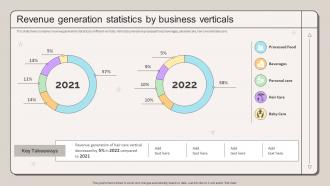 Revenue Generation Statistics By Business Verticals Strategic Marketing Plan To Increase
This slide shows companys revenue generation statistics by different verticals. Verticals covered are processed food, beverages, personal care, hair care and baby care. Present the topic in a bit more detail with this Revenue Generation Statistics By Business Verticals Strategic Marketing Plan To Increase. Use it as a tool for discussion and navigation on Revenue Generation, Statistics, Business Verticals. This template is free to edit as deemed fit for your organization. Therefore download it now.
-
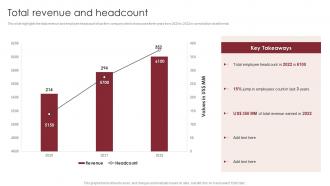 Total Revenue And Headcount Global Legal Services Company Profile Ppt Slides Graphics Template
This slide highlights the total revenue and employee headcount of law firm company which showcases three years from 2020 to 2022 in combination chart format. Deliver an outstanding presentation on the topic using this Total Revenue And Headcount Global Legal Services Company Profile Ppt Slides Graphics Template. Dispense information and present a thorough explanation of Headcount, Revenue, Combination using the slides given. This template can be altered and personalized to fit your needs. It is also available for immediate download. So grab it now.
-
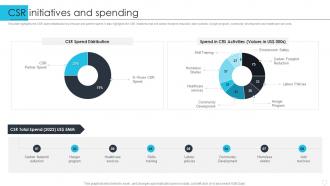 Csr Initiatives And Spending Manpower Security Services Company Profile
This slide highlights the CSR spend distribution by inhouse and partner spend. It also highlights the CSR initiatives that are carbon footprint reduction, labor policies, hunger program, community development and healthcare services. Present the topic in a bit more detail with this Csr Initiatives And Spending Manpower Security Services Company Profile. Use it as a tool for discussion and navigation on Initiatives, Distribution, Development. This template is free to edit as deemed fit for your organization. Therefore download it now.
-
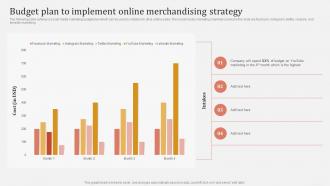 Budget Plan To Implement Online Merchandising Strategy Offline And Online Merchandising
The following slide outlines a social media marketing budget plan which can be used by retailers to drive online sales. The social media marketing channels covered in the slide are facebook, instagram, twitter, youtube, and linkedin marketing. Present the topic in a bit more detail with this Budget Plan To Implement Online Merchandising Strategy Offline And Online Merchandising. Use it as a tool for discussion and navigation on Facebook Marketing, YouTube Marketing, LinkedIn Marketing. This template is free to edit as deemed fit for your organization. Therefore download it now.
-
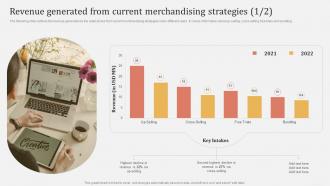 Offline And Online Merchandising Revenue Generated From Current Merchandising Strategies
The following slide outlines the revenue generated by the retail stores from current merchandising strategies in two different years. It covers information about up-selling, cross-selling, free trials and bundling. Present the topic in a bit more detail with this Offline And Online Merchandising Revenue Generated From Current Merchandising Strategies. Use it as a tool for discussion and navigation on Cross Selling, Free Trials, 2021 To 2022. This template is free to edit as deemed fit for your organization. Therefore download it now.
-
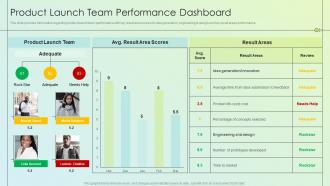 Q277 Product Launch Kickoff Planning Product Launch Team Performance Dashboard
This slide provides information regarding product launch team performance with key result area scores for idea generation, engineering and design and key result areas performance. Deliver an outstanding presentation on the topic using this Q277 Product Launch Kickoff Planning Product Launch Team Performance Dashboard. Dispense information and present a thorough explanation of Product Launch Team, Idea Generation, Innovation using the slides given. This template can be altered and personalized to fit your needs. It is also available for immediate download. So grab it now.
-
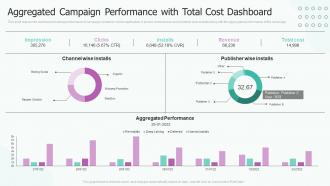 Aggregated Campaign Performance With Total Cost Dashboard
This slide represents dashboard showing performance of campaign related to mobile application. It shows channel wise and publisher wise installs along with the aggregated performance of the campaign. Introducing our Aggregated Campaign Performance With Total Cost Dashboard set of slides. The topics discussed in these slides are Aggregated Performance, Total Cost Dashboard, Aggregated Campaign Performance. This is an immediately available PowerPoint presentation that can be conveniently customized. Download it and convince your audience.
-
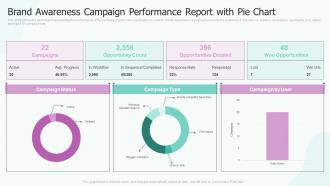 Brand Awareness Campaign Performance Report With Pie Chart
This slide shows the dashboard representing the performance of the campaign held by the organization in order to create awareness regarding its brand to the audience. It includes no. of active campaigns, opportunity cost, status and types of campaigns etc. Introducing our Brand Awareness Campaign Performance Report With Pie Chart set of slides. The topics discussed in these slides are Opportunity Count, Opportunities Emailed, Won Opportunities. This is an immediately available PowerPoint presentation that can be conveniently customized. Download it and convince your audience.
-
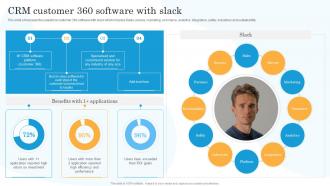 Crm Customer 360 Software With Slack Salesforce Company Profile Ppt Slides Example File
This slide showcases the salesforce customer 360 software with slack which includes Sales, service, marketing, commerce, analytics, integration, safety, industries and sustainability. Deliver an outstanding presentation on the topic using this Crm Customer 360 Software With Slack Salesforce Company Profile Ppt Slides Example File. Dispense information and present a thorough explanation of Performance, Investment, Application using the slides given. This template can be altered and personalized to fit your needs. It is also available for immediate download. So grab it now.
-
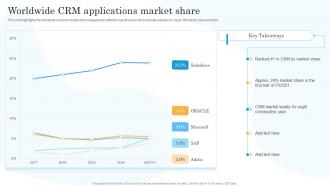 Worldwide Crm Applications Market Share Salesforce Company Profile Ppt Summary Background Image
This slide highlights the worldwide customer relationship management software market share which includes salesforce, oracle, Microsoft, sap and adobe. Deliver an outstanding presentation on the topic using this Worldwide Crm Applications Market Share Salesforce Company Profile Ppt Summary Background Image. Dispense information and present a thorough explanation of Applications, Consecutive, Relationship using the slides given. This template can be altered and personalized to fit your needs. It is also available for immediate download. So grab it now.
-
 Product Development And Management Dashboard Product Development And Management Strategy
This slide represents product development and management dashboard. It covers project hours, hours spent on project tasks, to do list etc. Present the topic in a bit more detail with this Product Development And Management Dashboard Product Development And Management Strategy. Use it as a tool for discussion and navigation on Product, Development, Management. This template is free to edit as deemed fit for your organization. Therefore download it now.
-
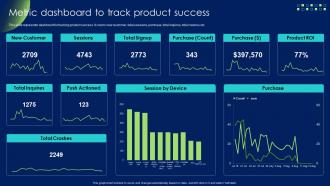 Product Development And Management Strategy Metric Dashboard To Track Product Success
This slide represents dashboard for tracking product success. It covers new customer, total sessions, purchase, total inquires, total crashes etc. Deliver an outstanding presentation on the topic using this Product Development And Management Strategy Metric Dashboard To Track Product Success. Dispense information and present a thorough explanation of Dashboard, Product, Success using the slides given. This template can be altered and personalized to fit your needs. It is also available for immediate download. So grab it now.
-
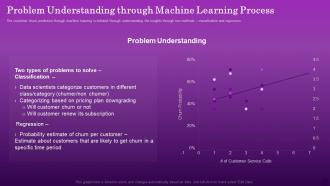 Problem Understanding Through Machine Learning Process Ensuring Organizational Growth
The customer churn prediction through machine learning is initiated through understanding the insights through two methods classification and regression. Deliver an outstanding presentation on the topic using this Problem Understanding Through Machine Learning Process Ensuring Organizational Growth. Dispense information and present a thorough explanation of Probability Estimate Of Churn, Data Scientists Categorize Customers, Categorizing Based On Pricing Plan Downgrading using the slides given. This template can be altered and personalized to fit your needs. It is also available for immediate download. So grab it now.
-
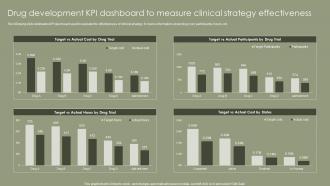 Drug Development KPI Dashboard To Measure Clinical Strategy Effectiveness
The following slide delineates KPI dashboard used to evaluate the effectiveness of clinical strategy. It covers information about drug cost, participants, hours, etc. Introducing our Drug Development KPI Dashboard To Measure Clinical Strategy Effectiveness set of slides. The topics discussed in these slides are Drug Development, KPI Dashboard, Measure, Clinical Strategy Effectiveness. This is an immediately available PowerPoint presentation that can be conveniently customized. Download it and convince your audience.


