Charts, Graphs PowerPoint Designs, Presentation Charts Designs & PPT Graphics
- Sub Categories
-
- Arrows and Targets
- Bullet and Text Slides
- Charts and Graphs
- Circular Cycle Diagrams
- Concepts and Shapes
- Custom Flat Designs
- Dashboards and Measuring
- Flow Process
- Funnels
- Gears
- Growth
- Harvey Balls
- Idea Innovation and Light Bulbs
- Leadership
- Linear Process Diagrams
- Magnifying Glass
- Misc Other Graphics
- Opportunity and Handshake
- Organization Charts
- Puzzles
- Pyramids
- Roadmaps and Timelines
- Silhouettes
- Steps
- Strategic Planning Analysis
- SWOT Analysis
- Tables and Matrix
- Teamwork
- Technology and Communication
- Venn Diagrams
- Visuals and Illustrations
-
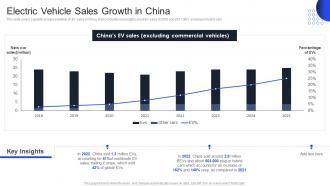 Assessment Electric Vehicle Sales Growth In China International Auto Sector
This slide covers a graphical representation of EV sales in China. It also includes key insights about EV sales in 2020 and 2021, BEV and plug-in hybrid cars. Present the topic in a bit more detail with this Assessment Electric Vehicle Sales Growth In China International Auto Sector. Use it as a tool for discussion and navigation on Chinas EV Sales, Excluding Commercial Vehicles, 2018 To 2025. This template is free to edit as deemed fit for your organization. Therefore download it now.
-
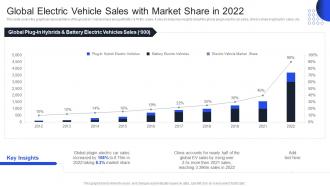 Assessment Global Electric Vehicle Sales With Market Share International Auto Sector
This slide covers the graphical representation of the global EV market share along with BEV and PHEV sales. It also includes key insights about the global plugin electric car sales, chinas share in global EV sales, etc. Deliver an outstanding presentation on the topic using this Assessment Global Electric Vehicle Sales With Market Share International Auto Sector. Dispense information and present a thorough explanation of Global Plugin, Electric Car Sales, Market Share, 2012 To 2022 using the slides given. This template can be altered and personalized to fit your needs. It is also available for immediate download. So grab it now.
-
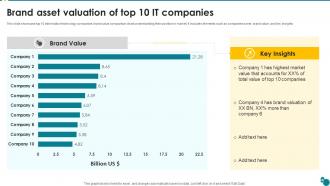 Brand Asset Valuation Of Top 10 It Companies
This slide showcase top 10 information technology companies brand value comparison chart understanding their position in market. It includes elements such as companies name, brand value, and key insights. Presenting our well structured Brand Asset Valuation Of Top 10 It Companies. The topics discussed in this slide are Brand Value, Market Value, Brand Valuation. This is an instantly available PowerPoint presentation that can be edited conveniently. Download it right away and captivate your audience.
-
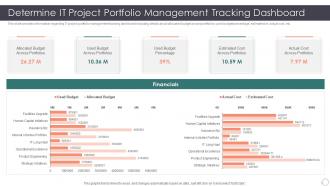 Role Enhancing Capability Cost Reduction Determine It Project Portfolio Management Tracking Dashboard
This slide provides information regarding IT project portfolio management tracking dashboard including details about allocated budget across portfolios, used budget percentage, estimated vs. actual cost, etc. Present the topic in a bit more detail with this Role Enhancing Capability Cost Reduction Determine It Project Portfolio Management Tracking Dashboard. Use it as a tool for discussion and navigation on Portfolio, Management, Dashboard. This template is free to edit as deemed fit for your organization. Therefore download it now.
-
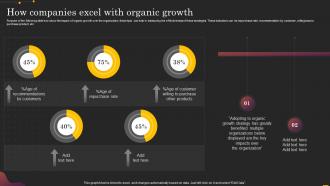 How Companies Excel With Organic Growth Driving Growth From Internal Operations
Purpose of the following slide is to show the impact of organic growth over the organization, these kpis can help in measuring the effectiveness of these strategies. These indicators can be repurchase rate, recommendation by customer, willingness to purchase product, etc. Present the topic in a bit more detail with this How Companies Excel With Organic Growth Driving Growth From Internal Operations. Use it as a tool for discussion and navigation on Companies Excel, Organic Growth, Customers. This template is free to edit as deemed fit for your organization. Therefore download it now.
-
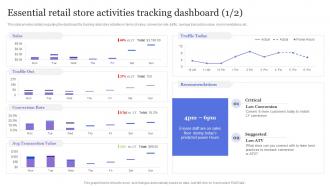 Essential Retail Store Activities Tracking Dashboard Retailer Guideline Playbook
This slide provides details regarding the dashboard for tracking retail store activities in terms of sales, conversion rate, traffic, average transaction value, recommendations, etc. Present the topic in a bit more detail with this Essential Retail Store Activities Tracking Dashboard Retailer Guideline Playbook. Use it as a tool for discussion and navigation on Sales, Conversion Rate, Transaction Value. This template is free to edit as deemed fit for your organization. Therefore download it now.
-
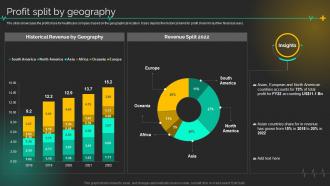 Medical Care Company Profile Profit Split By Geography Ppt Styles Example Introduction
The slide showcases the profit share for healthcare company based on the geographical location. It also depicts the historical trend for profit share for last five financial years. Present the topic in a bit more detail with this Medical Care Company Profile Profit Split By Geography Ppt Styles Example Introduction. Use it as a tool for discussion and navigation on Geography, European, Revenue. This template is free to edit as deemed fit for your organization. Therefore download it now.
-
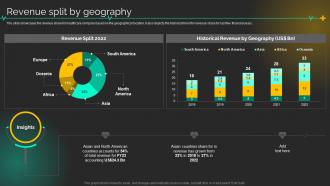 Medical Care Company Profile Revenue Split By Geography Ppt Styles Graphics Pictures
The slide showcases the revenue share for healthcare company based on the geographical location. It also depicts the historical trend for revenue share for last five financial years. Present the topic in a bit more detail with this Medical Care Company Profile Revenue Split By Geography Ppt Styles Graphics Pictures. Use it as a tool for discussion and navigation on Revenue, Geography, Financial. This template is free to edit as deemed fit for your organization. Therefore download it now.
-
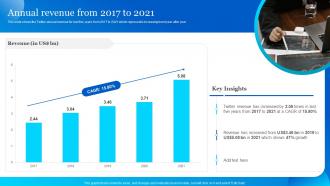 Annual Revenue From 2017 To 2021 Twitter Company Profile Ppt Powerpoint Presentation File Files
This slide shows the Twitter annual revenue for last five years from 2017 to 2021 which represents increasing trend year after year. Deliver an outstanding presentation on the topic using this Annual Revenue From 2017 To 2021 Twitter Company Profile Ppt Powerpoint Presentation File Files. Dispense information and present a thorough explanation of Annual Revenue, Twitter Revenue, Growth using the slides given. This template can be altered and personalized to fit your needs. It is also available for immediate download. So grab it now.
-
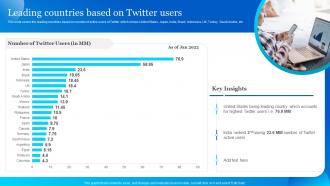 Leading Countries Based On Twitter Users Twitter Company Profile
This slide covers the leading countries based on number of active users of Twitter which shows United States, Japan, India, Brazil, Indonesia, UK, Turkey, Saudi Arabia, etc. Deliver an outstanding presentation on the topic using this Leading Countries Based On Twitter Users Twitter Company Profile. Dispense information and present a thorough explanation of Leading Countries, Based On Twitter Users using the slides given. This template can be altered and personalized to fit your needs. It is also available for immediate download. So grab it now.
-
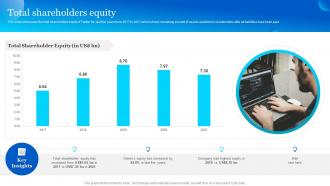 Total Shareholders Equity Twitter Company Profile Ppt Powerpoint Presentation File Slides
This slide showcases the total shareholders equity of Twitter for last five years from 2017 to 2021 which shows remaining amount of assets available to shareholders after all liabilities have been paid. Present the topic in a bit more detail with this Total Shareholders Equity Twitter Company Profile Ppt Powerpoint Presentation File Slides. Use it as a tool for discussion and navigation on Total Shareholders Equity. This template is free to edit as deemed fit for your organization. Therefore download it now.
-
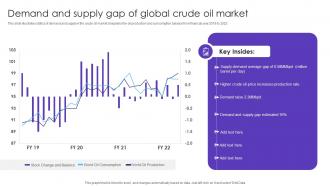 Demand And Supply Gap Of Global Crude Oil Market
This slide illustrates statics of demand and supply in the crude oil market.it explains the oil production and consumption balance from financial year 2019 to 2022. Introducing our Demand And Supply Gap Of Global Crude Oil Market set of slides. The topics discussed in these slides are Demand And Supply Gap, Global Crude Oil Market. This is an immediately available PowerPoint presentation that can be conveniently customized. Download it and convince your audience.
-
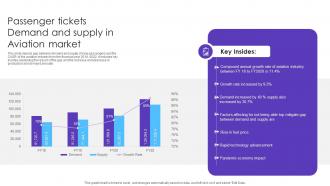 Passenger Tickets Demand And Supply In Aviation Market
This slide depicts gap between demand and supply of new passengers and the CAGR of the aviation industry from the financial year 2018 to 2022. it includes key insides explaining the reason of the gap and the increase and decrease in production and demand annually. Presenting our well structured Passenger Tickets Demand And Supply In Aviation Market. The topics discussed in this slide are Passenger Tickets, Demand And Supply, Aviation Market. This is an instantly available PowerPoint presentation that can be edited conveniently. Download it right away and captivate your audience.
-
 Brand Awareness Metrics Sentiment Analysis Opinion Mining Building Brand Awareness
This slide provides information regarding sentiment analysis opinion mining as brand awareness metrics. It helps in identifying key influencer across social network. The slide also include key initiatives to manage sentiment analysis. Present the topic in a bit more detail with this Brand Awareness Metrics Sentiment Analysis Opinion Mining Building Brand Awareness. Use it as a tool for discussion and navigation on Brand Awareness Metrics, Sentiment Analysis, Opinion Mining. This template is free to edit as deemed fit for your organization. Therefore download it now.
-
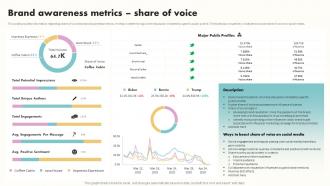 Brand Awareness Metrics Share Of Voice Building Brand Awareness
This slide provides information regarding share of voice as brand awareness metrics. It helps in determining online discussion initiated by specific public profile. The slide also include key initiatives to boost share of voice on social media. Deliver an outstanding presentation on the topic using this Brand Awareness Metrics Share Of Voice Building Brand Awareness. Dispense information and present a thorough explanation of Potential Impressions, Brand Awareness Metrics, Positive Sentiment using the slides given. This template can be altered and personalized to fit your needs. It is also available for immediate download. So grab it now.
-
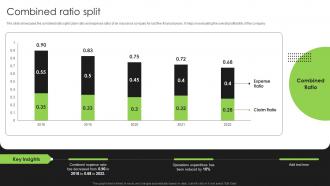 Combined Ratio Split Life And Non Life Insurance Company Profile Ppt Gallery Maker
The slide showcases the combined ratio split claim ratio and expense ratio of an insurance company for last five financial years. It helps in evaluating the overall profitability of the company. Present the topic in a bit more detail with this Combined Ratio Split Life And Non Life Insurance Company Profile Ppt Gallery Maker. Use it as a tool for discussion and navigation on Combined Ratio Split. This template is free to edit as deemed fit for your organization. Therefore download it now.
-
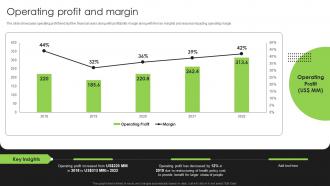 Operating Profit And Margin Life And Non Life Insurance Company Profile
The slide showcases operating profit trend last five financial years along with profitability margin along with the key insights and reasons impacting operating margin. Deliver an outstanding presentation on the topic using this Operating Profit And Margin Life And Non Life Insurance Company Profile. Dispense information and present a thorough explanation of Operating Profit And Margin using the slides given. This template can be altered and personalized to fit your needs. It is also available for immediate download. So grab it now.
-
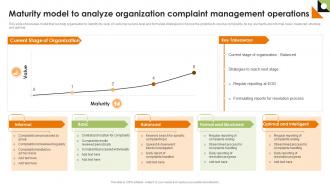 Maturity Model To Analyze Organization Complaint Management Operations
This slide showcases model that can help organization to identify the level of customer service level and formulate strategies to improve the potential to resolve complaints. Its key elements are informal, basic, balanced, structure and optimal. Presenting our well-structured Maturity Model To Analyze Organization Complaint Management Operations. The topics discussed in this slide are Formal And Structured, Optimal And Intelligent, Balanced, Basic, Informal. This is an instantly available PowerPoint presentation that can be edited conveniently. Download it right away and captivate your audience.
-
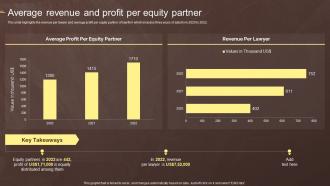 Average Revenue And Profit Per Equity Partner Law Associates Company Profile
This slide highlights the revenue per lawyer and average profit per equity partner of law firm which includes three years of data from 2020 to 2022. Deliver an outstanding presentation on the topic using this Average Revenue And Profit Per Equity Partner Law Associates Company Profile. Dispense information and present a thorough explanation of Average Revenue And Profit, Equity Partner using the slides given. This template can be altered and personalized to fit your needs. It is also available for immediate download. So grab it now.
-
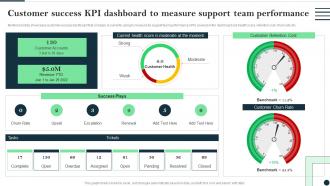 Customer Success Best Practices Guide Customer Success Kpi Dashboard To Measure Support Team Performance
Mentioned slide showcases customer success dashboard that company is currently using to measure its support team performance. KPIs covered in the dashboard are health score, retention cost, churn rate etc. Present the topic in a bit more detail with this Customer Success Best Practices Guide Customer Success Kpi Dashboard To Measure Support Team Performance. Use it as a tool for discussion and navigation on Success, Dashboard, Measure. This template is free to edit as deemed fit for your organization. Therefore download it now.
-
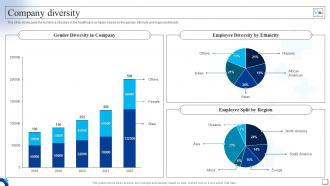 Medical Services Company Profile Company Diversity Ppt Slides Example Introduction
The slide showcases the workforce structure in the healthcare company based on the gender, ethnicity and regional diversity. Present the topic in a bit more detail with this Medical Services Company Profile Company Diversity Ppt Slides Example Introduction. Use it as a tool for discussion and navigation on Company, Diversity, Workforce Structure. This template is free to edit as deemed fit for your organization. Therefore download it now.
-
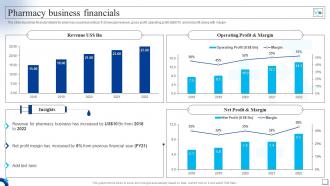 Medical Services Company Profile Pharmacy Business Financials Ppt Summary Professional
The slide describes financial details for pharmacy business vertical. It showcase revenue, gross profit, operating profit, EBIDTA and net profit along with margin Present the topic in a bit more detail with this Medical Services Company Profile Pharmacy Business Financials Ppt Summary Professional. Use it as a tool for discussion and navigation on Pharmacy, Business, Financials. This template is free to edit as deemed fit for your organization. Therefore download it now.
-
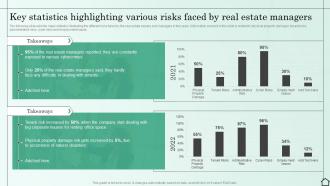 Key Statistics Highlighting Various Risks Faced By Real Estate Managers Managing Various Risks
The following slide exhibits major statistics illustrating the different risks faced by the real estate owners and managers in two years. Information covered in this slide is related to physical property damager, tenant risks, administrative risks, cyber risks and employment issues. Present the topic in a bit more detail with this Key Statistics Highlighting Various Risks Faced By Real Estate Managers Managing Various Risks. Use it as a tool for discussion and navigation on Statistics Highlighting, Real Estate Managers. This template is free to edit as deemed fit for your organization. Therefore download it now.
-
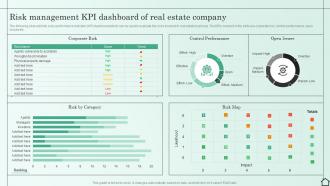 Risk Management KPI Dashboard Of Real Estate Company Managing Various Risks
The following slide exhibits a key performance indicator KPI dashboard which can be used to evaluate the risks involved in real estate business. The KPIs covered in the slide are corporate risk, control performance, open issues etc. Present the topic in a bit more detail with this Risk Management KPI Dashboard Of Real Estate Company Managing Various Risks. Use it as a tool for discussion and navigation on Corporate Risk, Control Performance, Category. This template is free to edit as deemed fit for your organization. Therefore download it now.
-
 Top Cyber Risks Faced By The Real Estate Company Managing Various Risks
The following slide exhibits four cyber risks which are faced by the real estate organization. It provides key information about the ransomware, phishing, web based attack and email fraud attack. Present the topic in a bit more detail with this Top Cyber Risks Faced By The Real Estate Company Managing Various Risks. Use it as a tool for discussion and navigation on Phishing, Business Email Compromise, Ransomware. This template is free to edit as deemed fit for your organization. Therefore download it now.
-
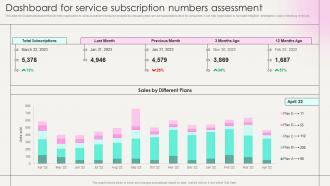 Dashboard For Service Subscription Numbers Assessment Marketing Strategies New Service
This slide showcases dashboard that can help organization to conduct post service launch analysis by calculating total service subscriptions done by consumers. It can help organization to formulate mitigation strategies in case of declining revenues. Deliver an outstanding presentation on the topic using this Dashboard For Service Subscription Numbers Assessment Marketing Strategies New Service. Dispense information and present a thorough explanation of Dashboard, Service Subscription, Numbers Assessment using the slides given. This template can be altered and personalized to fit your needs. It is also available for immediate download. So grab it now.
-
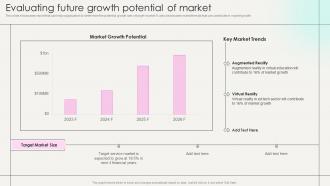 Evaluating Future Growth Potential Of Market Marketing Strategies New Service
This slide showcases report that can help organization to determine the potential growth rate of target market. It also showcases market trends that can contribute in market growth. Deliver an outstanding presentation on the topic using this Evaluating Future Growth Potential Of Market Marketing Strategies New Service. Dispense information and present a thorough explanation of Market Growth Potential, Augmented Reality, Virtual Reality using the slides given. This template can be altered and personalized to fit your needs. It is also available for immediate download. So grab it now.
-
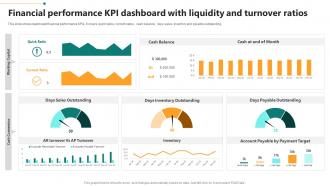 Financial Performance KPI Dashboard With Liquidity And Turnover Ratios
This slide shows dashboard financial performance KPIs. It covers quick ratios, current ratios, cash balance, days sales, inventory and payable outstanding. Presenting our well-structured Financial Performance KPI Dashboard With Liquidity And Turnover Ratios. The topics discussed in this slide are Sales Outstanding, Inventory Outstanding, Payable Outstanding. This is an instantly available PowerPoint presentation that can be edited conveniently. Download it right away and captivate your audience.
-
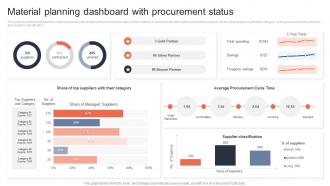 Material Planning Dashboard With Procurement Status
This slide illustrates dashboard for material planning which tracks the procurement status of raw material. It also provides information about total suppliers, share of top suppliers with their category, average procurement cycle time and supplier classification. Presenting our well-structured Material Planning Dashboard With Procurement Status. The topics discussed in this slide are Average Procurement Cycle Time, Supplier Classification. This is an instantly available PowerPoint presentation that can be edited conveniently. Download it right away and captivate your audience.
-
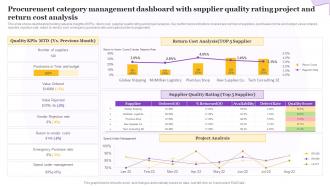 Procurement Category Management Dashboard With Supplier Quality Rating Project And Return Cost Analysis
This slide shows dashboard providing valuable insights of KPIs, return cost, supplier quality rating and project analysis. Key performance indicators covered are number of suppliers, purchases in time and budget, value ordered, rejected, rejection rate, return to vendor cost, emergency purchase ratio and spend under management. Presenting our well structured Procurement Category Management Dashboard With Supplier Quality Rating Project And Return Cost Analysis. The topics discussed in this slide are Return Cost Analysis, Supplier Quality Rating, Project Analysis. This is an instantly available PowerPoint presentation that can be edited conveniently. Download it right away and captivate your audience.
-
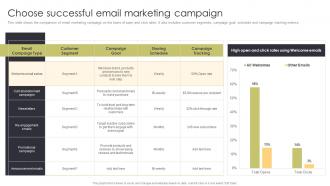 Choose Successful Email Marketing Campaign Sales Automation Procedure For Better Deal Management
This slide shows the comparison of email marketing campaign on the basis of open and click rates. It also includes customer segments, campaign goal, schedule and campaign tracking metrics. Present the topic in a bit more detail with this Choose Successful Email Marketing Campaign Sales Automation Procedure For Better Deal Management. Use it as a tool for discussion and navigation on Newsletters, Promotional Campaigns, Announcement Emails. This template is free to edit as deemed fit for your organization. Therefore download it now.
-
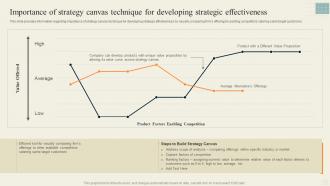 Importance Of Strategy Canvas Technique Effective Strategy Formulation
This slide provides information regarding importance of strategy canvas technique for developing strategic effectiveness by visually comparing firms offerings to existing competitors catering same target customers. Present the topic in a bit more detail with this Importance Of Strategy Canvas Technique Effective Strategy Formulation. Use it as a tool for discussion and navigation on Strategy Canvas Technique, Developing, Strategic Effectiveness. This template is free to edit as deemed fit for your organization. Therefore download it now.
-
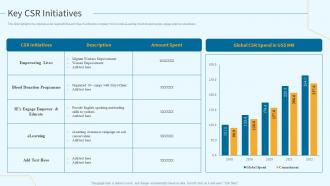 Key CSR Initiatives Architectural Planning And Design Services Company Profile
This slide highlights the corporate social responsibilities activities of architecture company which include eLearning, blood donation camps, engage empower and educate. Deliver an outstanding presentation on the topic using this Key CSR Initiatives Architectural Planning And Design Services Company Profile. Dispense information and present a thorough explanation of Empowering Lives, Blood Donation Programme, Engage Empower And Educate using the slides given. This template can be altered and personalized to fit your needs. It is also available for immediate download. So grab it now.
-
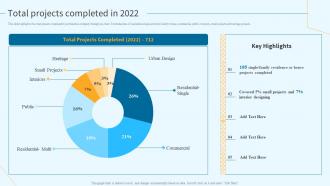 Total Projects Completed In 2022 Architectural Planning And Design Services Company Profile
This slide highlights the total projects completed by architecture company through pie chart. It includes data of residential single and multi family homes, commercial, public, interiors, small projects and heritage projects. Deliver an outstanding presentation on the topic using this Total Projects Completed In 2022 Architectural Planning And Design Services Company Profile. Dispense information and present a thorough explanation of Interiors, Residential Multi, Commercial, Residential Single using the slides given. This template can be altered and personalized to fit your needs. It is also available for immediate download. So grab it now.
-
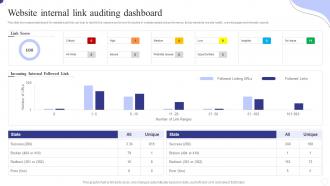 Website Internal Link Auditing Dashboard Snapshot
This slide showcases dashboard snapshot for website audit that can help to identify the reasons and errors for decline in website speed and performance. Its key elements are site health, crawled pages and thematic reports. Presenting our well-structured Website Internal Link Auditing Dashboard. The topics discussed in this slide are Website, Internal Link Auditing, Dashboard. This is an instantly available PowerPoint presentation that can be edited conveniently. Download it right away and captivate your audience.
-
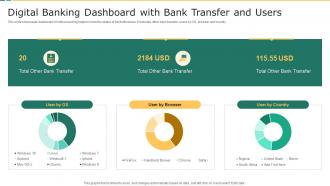 Digital Banking Dashboard With Bank Transfer And Users
This slide showcases dashboard of online banking helps to know the status of funds or finances. It includes other bank transfer, users by OS, browser and country. Presenting our well-structured Digital Banking Dashboard With Bank Transfer And Users. The topics discussed in this slide are Digital Banking Dashboard, Bank Transfer Users. This is an instantly available PowerPoint presentation that can be edited conveniently. Download it right away and captivate your audience.
-
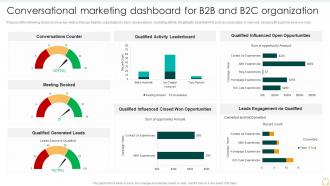 F525 Conversational Marketing Dashboard For B2b And B2c Organization Effective B2b Marketing Organization Set 2
Purpose of the following slide is to show key metrics that can help the organization to track conversational marketing efforts, it highlights essential KPIs such as subscribers, e-mail sent, sessions through link sent on e-mail Deliver an outstanding presentation on the topic using this F525 Conversational Marketing Dashboard For B2b And B2c Organization Effective B2b Marketing Organization Set 2. Dispense information and present a thorough explanation of Conversational, Marketing, Dashboard using the slides given. This template can be altered and personalized to fit your needs. It is also available for immediate download. So grab it now.
-
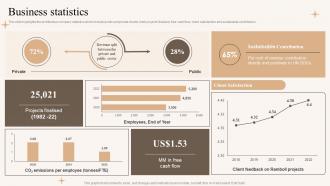 Residential And Commercial Architect Services Company Profile Business Statistics
This slide highlights the architecture company statistics which include public and private clients, total projects finalized, free cash flow, client satisfaction and sustainable contribution. Deliver an outstanding presentation on the topic using this Residential And Commercial Architect Services Company Profile Business Statistics. Dispense information and present a thorough explanation of Business, Statistics, Contribution using the slides given. This template can be altered and personalized to fit your needs. It is also available for immediate download. So grab it now.
-
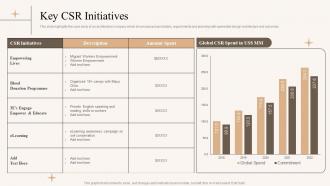 Residential And Commercial Architect Services Company Profile Key Csr Initiatives
This slide highlights the case study of an architecture company which showcases project details, requirements and planning with xperiential design architecture and outcomes. Present the topic in a bit more detail with this Residential And Commercial Architect Services Company Profile Key Csr Initiatives. Use it as a tool for discussion and navigation on Initiatives, Architecture, Requirements. This template is free to edit as deemed fit for your organization. Therefore download it now.
-
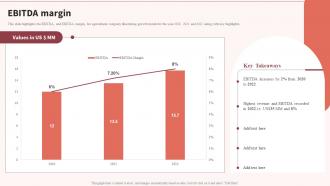 EBITDA Margin Multinational Food Processing Company Profile
This slide highlights the EBITDA, and EBITDA margin, for agricultural company illustrating growth trends for the year 2020, 2021 and 2022 along with key highlights. Present the topic in a bit more detail with this EBITDA Margin Multinational Food Processing Company Profile. Use it as a tool for discussion and navigation on EBITDA Margin. This template is free to edit as deemed fit for your organization. Therefore download it now.
-
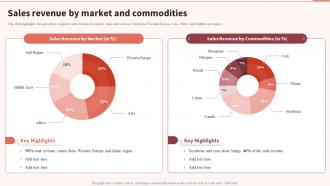 Sales Revenue By Market And Commodities Multinational Food Processing Company Profile
This slide highlights the agriculture company sales revenue by market share and services. It includes Western Europe, Asia, Africa, and Middle east region. Deliver an outstanding presentation on the topic using this Sales Revenue By Market And Commodities Multinational Food Processing Company Profile. Dispense information and present a thorough explanation of Sales Revenue, Commodities, Market using the slides given. This template can be altered and personalized to fit your needs. It is also available for immediate download. So grab it now.
-
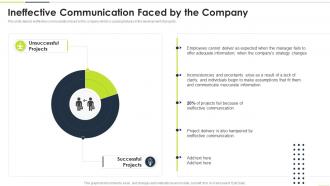 Ineffective Communication Faced By The Company DSDM Ppt Powerpoint Presentation Infographic
This slide depicts ineffective communication faced by the company which is causing failures in the development of projects. Present the topic in a bit more detail with this Ineffective Communication Faced By The Company DSDM Ppt Powerpoint Presentation Infographic. Use it as a tool for discussion and navigation on Unsuccessful Projects, Strategy Changes, Communicate Inaccurate, Project Delivery. This template is free to edit as deemed fit for your organization. Therefore download it now.
-
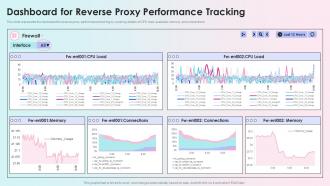 Dashboard For Reverse Proxy Performance Tracking Reverse Proxy Load Balancer Ppt Portrait
This slide represents the dashboard for reverse proxy performance tracking by covering details of CPU load, available memory, and connections. Present the topic in a bit more detail with this Dashboard For Reverse Proxy Performance Tracking Reverse Proxy Load Balancer Ppt Portrait. Use it as a tool for discussion and navigation on Connections, Reverse Proxy, Performance Tracking. This template is free to edit as deemed fit for your organization. Therefore download it now.
-
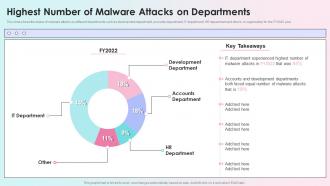 Highest Number Of Malware Attacks On Departments Reverse Proxy Load Balancer Ppt Infographics
This slide shows the status of malware attacks on different departments such as development department, accounts department, IT department, HR department and others, in organization for the FY2022 year. Present the topic in a bit more detail with this Highest Number Of Malware Attacks On Departments Reverse Proxy Load Balancer Ppt Infographics. Use it as a tool for discussion and navigation on Development Department, Accounts Department, Hr Department. This template is free to edit as deemed fit for your organization. Therefore download it now.
-
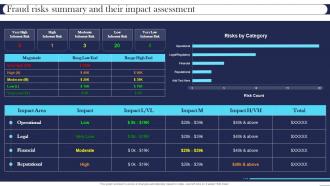 Fraud Risks Summary And Their Impact Assessment Best Practices For Managing
Present the topic in a bit more detail with this Fraud Risks Summary And Their Impact Assessment Best Practices For Managing. Use it as a tool for discussion and navigation on Moderate Inherent Risk, Low Inherent Risk, Very Low Inherent Risk. This template is free to edit as deemed fit for your organization. Therefore download it now.
-
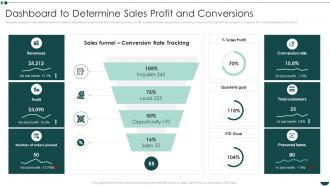 Business Process Reengineering Operational Efficiency Dashboard To Determine Sales Profit And Conversions
This slide focuses on dashboard to determine sales profits and conversions that also includes revenues, profits, number of orders placed, total customers, procured items that will help company to measure the overall business performance. Present the topic in a bit more detail with this Business Process Reengineering Operational Efficiency Dashboard To Determine Sales Profit And Conversions. Use it as a tool for discussion and navigation on Conversions, Dashboard, Revenues. This template is free to edit as deemed fit for your organization. Therefore download it now
-
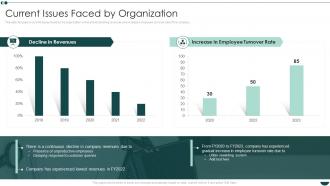 Current Issues Faced By Organization Business Process Reengineering Operational Efficiency
This slide focuses on current issues faced by the organization which shows declining revenues and increase in employee turnover rate of the company. Deliver an outstanding presentation on the topic using this Current Issues Faced By Organization Business Process Reengineering Operational Efficiency. Dispense information and present a thorough explanation of Organization, Revenues, Experienced using the slides given. This template can be altered and personalized to fit your needs. It is also available for immediate download. So grab it now.
-
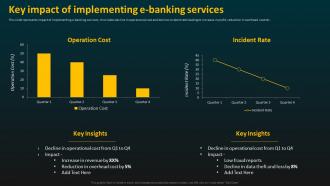 Key Impact Of Implementing E Banking Services E Banking Management And Services
This slide represents impact of implementing e banking services. It includes decline in operational cost and decline incident rate leading to increase in profit, reduction in overhead cost etc. Present the topic in a bit more detail with this Key Impact Of Implementing E Banking Services E Banking Management And Services. Use it as a tool for discussion and navigation on Operation Cost, Revenue, E Banking Services. This template is free to edit as deemed fit for your organization. Therefore download it now.
-
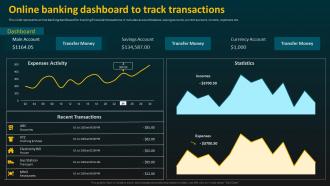 Online Banking Dashboard To Track Transactions E Banking Management And Services
This slide represents online banking dashboard for tracking financial transactions. It includes account balance, saving account, current account, income, expenses etc. Present the topic in a bit more detail with this Online Banking Dashboard To Track Transactions E Banking Management And Services. Use it as a tool for discussion and navigation on Banking Dashboard, Track Transactions, Expenses Activity. This template is free to edit as deemed fit for your organization. Therefore download it now.
-
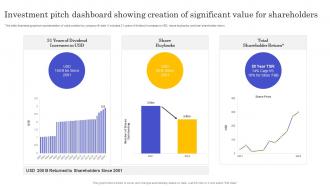 Investment Pitch Dashboard Showing Creation Of Significant Value For Shareholders
This slide illustrates graphical representation of value creation by company till date. It includes 31 years of dividend increases in USD, share buybacks, and total shareholder return. Introducing our Investment Pitch Dashboard Showing Creation Of Significant Value For Shareholders set of slides. The topics discussed in these slides are Investment Pitch Dashboard, Significant Value, Shareholders. This is an immediately available PowerPoint presentation that can be conveniently customized. Download it and convince your audience.
-
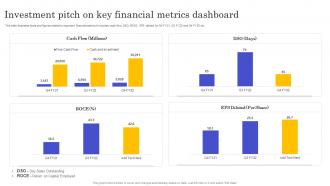 Investment Pitch On Key Financial Metrics Dashboard
This slide illustrates facts and figures related to important financial metrics It includes cash flow, DSO, ROCE, EPS diluted for Q4 FY21, Q3 FY22 and Q4 FY22 etc. Presenting our well-structured Investment Pitch On Key Financial Metrics Dashboard. The topics discussed in this slide are Investment Pitch, Key Financial Metrics, Dashboard. This is an instantly available PowerPoint presentation that can be edited conveniently. Download it right away and captivate your audience.
-
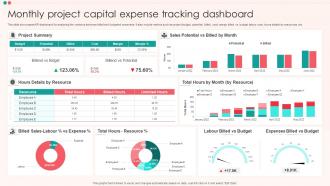 Monthly Project Capital Expense Tracking Dashboard
This slide showcases KPI dashboard for analysing the variance between billed and budgeted expenses. It also include metrics such as project budget, potential, billed, cost, margin billed vs. budget labour cost, hours details by resources, etc. Presenting our well-structured Monthly Project Capital Expense Tracking Dashboard. The topics discussed in this slide are Monthly, Project Capital Expense, Tracking Dashboard. This is an instantly available PowerPoint presentation that can be edited conveniently. Download it right away and captivate your audience.
-
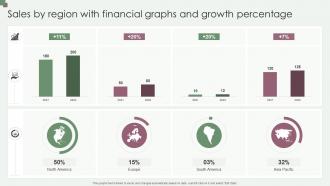 Sales By Region With Financial Graphs And Growth Percentage
Presenting our well-structured Sales By Region With Financial Graphs And Growth Percentage. The topics discussed in this slide are Sales By Region, Financial Graphs, Growth Percentage. This is an instantly available PowerPoint presentation that can be edited conveniently. Download it right away and captivate your audience.
-
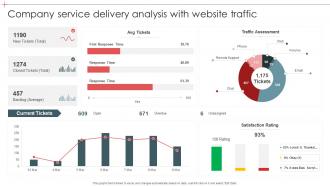 Company Service Delivery Analysis With Website Traffic
Introducing our Company Service Delivery Analysis With Website Traffic set of slides. The topics discussed in these slides are Company Service, Delivery Analysis, Website Traffic. This is an immediately available PowerPoint presentation that can be conveniently customized. Download it and convince your audience.
-
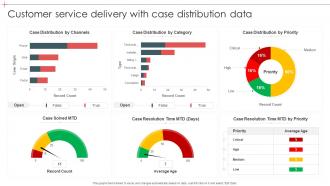 Customer Service Delivery With Case Distribution Data
Introducing our Customer Service Delivery With Case Distribution Data set of slides. The topics discussed in these slides are Customer Service Delivery, Case Distribution Data. This is an immediately available PowerPoint presentation that can be conveniently customized. Download it and convince your audience.
-
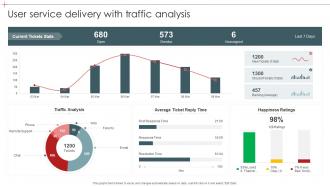 User Service Delivery With Traffic Analysis
Presenting our well-structured User Service Delivery With Traffic Analysis. The topics discussed in this slide are User Service Delivery, Traffic Analysis. This is an instantly available PowerPoint presentation that can be edited conveniently. Download it right away and captivate your audience.
-
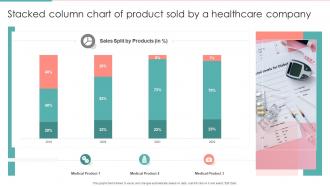 Stacked Column Chart Of Product Sold By A Healthcare Company
Presenting our well-structured Stacked Column Chart Of Product Sold By A Healthcare Company. The topics discussed in this slide are Stacked Column Chart, Product Sold, Healthcare Company. This is an instantly available PowerPoint presentation that can be edited conveniently. Download it right away and captivate your audience.
-
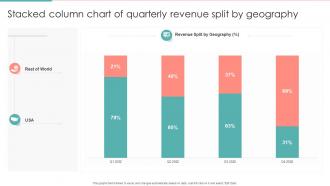 Stacked Column Chart Of Quarterly Revenue Split By Geography
Introducing our Stacked Column Chart Of Quarterly Revenue Split By Geography set of slides. The topics discussed in these slides are Stacked Column Chart, Quarterly Revenue Split, Geography. This is an immediately available PowerPoint presentation that can be conveniently customized. Download it and convince your audience.
-
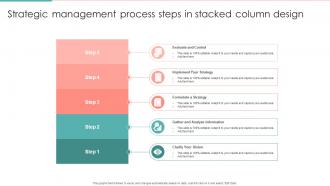 Strategic Management Process Steps In Stacked Column Design
Presenting our well-structured Strategic Management Process Steps In Stacked Column Design. The topics discussed in this slide are Evaluate Control, Implement Strategy, Formulate A Strategy, Clarify Vision. This is an instantly available PowerPoint presentation that can be edited conveniently. Download it right away and captivate your audience.
-
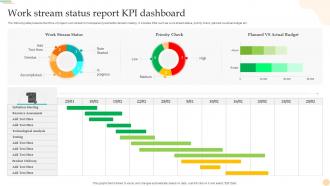 Work Stream Status Report KPI Dashboard
The following slide presents the KPAs of project work stream for transparency and better decision making. It includes KPIs such as work stream status, priority check, planned vs actual budget etc. Introducing our Work Stream Status Report KPI Dashboard set of slides. The topics discussed in these slides are Work Stream Status, Report, KPI Dashboard. This is an immediately available PowerPoint presentation that can be conveniently customized. Download it and convince your audience.


