Charts, Graphs PowerPoint Designs, Presentation Charts Designs & PPT Graphics
- Sub Categories
-
- Arrows and Targets
- Bullet and Text Slides
- Charts and Graphs
- Circular Cycle Diagrams
- Concepts and Shapes
- Custom Flat Designs
- Dashboards and Measuring
- Flow Process
- Funnels
- Gears
- Growth
- Harvey Balls
- Idea Innovation and Light Bulbs
- Leadership
- Linear Process Diagrams
- Magnifying Glass
- Misc Other Graphics
- Opportunity and Handshake
- Organization Charts
- Puzzles
- Pyramids
- Roadmaps and Timelines
- Silhouettes
- Steps
- Strategic Planning Analysis
- SWOT Analysis
- Tables and Matrix
- Teamwork
- Technology and Communication
- Venn Diagrams
- Visuals and Illustrations
-
 Clustered bar presentation examples
Presenting this set of slides with name - Clustered Bar Presentation Examples. This is a three stage process. The stages in this process are Business, Marketing, Finance, Unit Count, Graph.
-
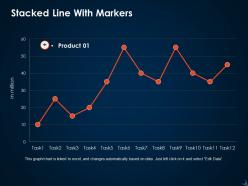 Stacked line with markers ppt icon guidelines
Presenting this set of slides with name - Stacked Line With Markers Ppt Icon Guidelines. This is a one stage process. The stages in this process are Business, Marketing, In Million, Finance, Graph.
-
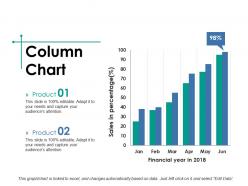 Column chart ppt professional graphics template
Presenting this set of slides with name - Column Chart Ppt Professional Graphics Template. This is a two stage process. The stages in this process are Product, Sales In Percentage, Financial Years In.
-
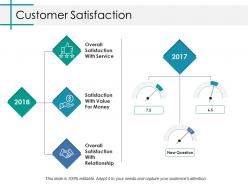 Customer satisfaction ppt slides inspiration
Presenting this set of slides with name - Customer Satisfaction Ppt Slides Inspiration. This is a three stage process. The stages in this process are New Question, Satisfaction With Value For Money, Overall Satisfaction With Service.
-
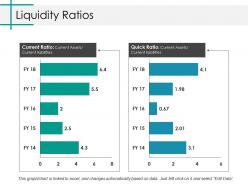 Liquidity ratios ppt slides elements
Presenting this set of slides with name - Liquidity Ratios Ppt Slides Elements. This is a ten stage process. The stages in this process are Current Ratio, Quick Ratio, Current Assets.
-
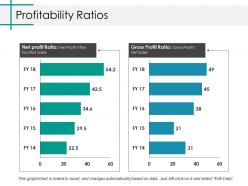 Profitability ratios ppt inspiration rules
Presenting this set of slides with name - Profitability Ratios Ppt Inspiration Rules. This is a ten stage process. The stages in this process are Net Profit Ratio, Gross Profit Ratio, Gross Profit.
-
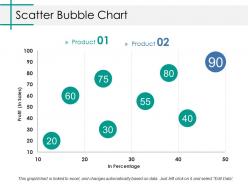 Scatter bubble chart ppt visual aids pictures
Presenting this set of slides with name - Scatter Bubble Chart Ppt Visual Aids Pictures. This is a two stage process. The stages in this process are Product, Profit, In Percentage.
-
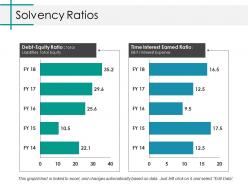 Solvency ratios ppt outline microsoft
Presenting this set of slides with name - Solvency Ratios Ppt Outline Microsoft. This is a ten stage process. The stages in this process are Debt Equity Ratio, Time Interest Earned Ratio, Interest Expense.
-
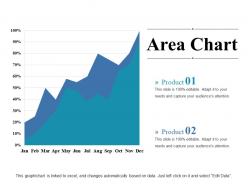 Area chart ppt background images
Presenting area chart PPT background images PowerPoint template. Useful for marketing and sales people, business analysts, market researchers. Brilliant picture quality as pixels doesn’t break on both standard and widescreen view. Presentation slide is accepted with Google slides and can be merged as required. PowerPoint design comes with access to modify the content with enterprise details. Similar designs are accessible with different nodes and stages as required. Rapid download and can be delivered into other software formats such as JPG and PDF.
-
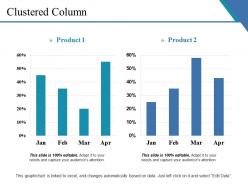 Clustered column ppt infographic template
Pre-designed clustered column PPT infographic PPT template. Presentation template adapts well with Google slides. PPT design comes with access to add the trade details. Superlative picture quality as pixels doesn’t break on both standard and widescreen view. Fast download and can be converted into other formats such as JPG and PDF. Similar designs are easy to get with different nodes and stages. PPT graphic can be edited as per your preference.
-
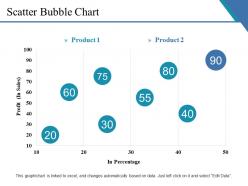 Scatter bubble chart ppt summary demonstration
Presenting this set of slides with name - Scatter Bubble Chart Ppt Summary Demonstration. This is a two stage process. The stages in this process are Business, Profit, In Percentage, Chart, Finance .
-
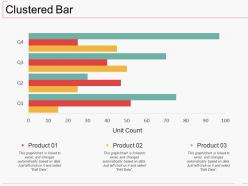 Clustered bar ppt inspiration examples
Presenting this set of slides with name - Clustered Bar Ppt Inspiration Examples. This is a three stage process. The stages in this process are Product, Unit Count, Clustered Bar, Business, Marketing.
-
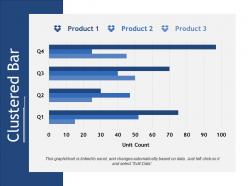 Clustered bar ppt summary outfit
Presenting this set of slides with name - Clustered Bar Ppt Summary Outfit. This is a three stage process. The stages in this process are Product, Unit Count, Clustered Bar, Business, Marketing.
-
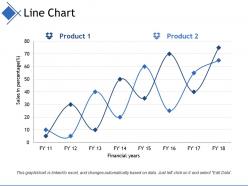 Line chart ppt ideas templates
Presenting this set of slides with name - Line Chart Ppt Ideas Templates. This is a two stage process. The stages in this process are Sales In Percentage, Financial Years, Product.
-
 Radar chart ppt infographics show
Presenting this set of slides with name - Radar Chart Ppt Infographics Show. This is a two stage process. The stages in this process are Product, Finance, Shape, Radar Chart, Business.
-
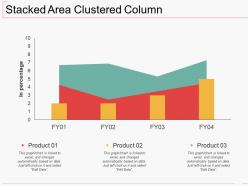 Stacked area clustered column ppt icon slide portrait
Presenting this set of slides with name - Stacked Area Clustered Column Ppt Icon Slide Portrait. This is a two stage process. The stages in this process are In Percentage, Product, Bar Graph.
-
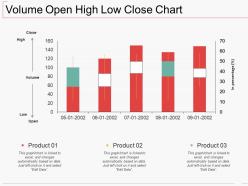 Volume open high low close chart ppt show background image
Presenting this set of slides with name - Volume Open High Low Close Chart Ppt Show Background Image. This is a three stage process. The stages in this process are Close, Volume, Open, High, Low.
-
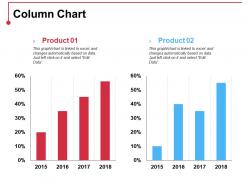 Column chart ppt inspiration clipart
Presenting this set of slides with name - Column Chart Ppt Inspiration Clipart. This is a two stage process. The stages in this process are Product, Years, Percentage, Finance, Bar Graph.
-
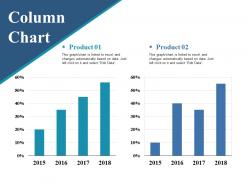 Column chart ppt pictures vector
Presenting this set of slides with name - Column Chart Ppt Pictures Vector. This is a two stage process. The stages in this process are Product, Years, Percentage, Finance, Bar Graph.
-
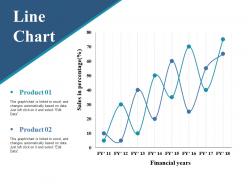 Line chart ppt ideas slide download
Presenting this set of slides with name - Line Chart Ppt Ideas Slide Download. This is a two stage process. The stages in this process are Product, Financial Years, Sales In Percentage.
-
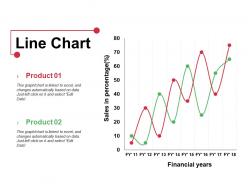 Line chart ppt layouts graphics
Presenting this set of slides with name - Line Chart Ppt Layouts Graphics. This is a two stage process. The stages in this process are Product, Financial Years, Sales In Percentage.
-
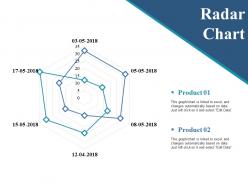 Radar chart ppt summary smartart
These are thoroughly percent editable slides available along with the editing instructions for your ease. Once downloaded, you may save the PPT in the desired format of your choice. The best part is the PPT is compatible with numerous Microsoft software and Google slides. Also there is no fear of image pixilation, when the presentation is to be given on big screens, since the visuals are of high resolutions. Such PPT is used by business owners, marketing analysts, auditors and students.
-
 Area chart ppt sample presentations
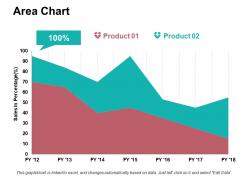
Presenting a PowerPoint slide named Area chart PPT sample presentations. Create an effective presentation with this PPT diagram which is both professional and editable. Customize colors, choose font styles and size. You can choose from a wide variety of icons. Resize and scale the icons to fit any content. The PPT slide is compatible with Google slides and can be fetched at once. You can save it as both PDF and JPG formats .It has easy drag and drop features and amazing library of graphic elements. This PPT slide is data driven can be linked to Excel sheet. Download this area chart PowerPoint slide now.
-
 Column chart ppt sample file
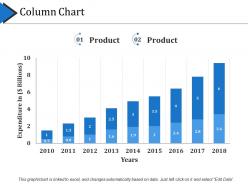
Presenting this set of slides with name - Column Chart Ppt Sample File. This is a two stage process. The stages in this process are Business, Expenditure In, Years Column Chart, Marketing, Finance.
-
 Financial powerpoint slide
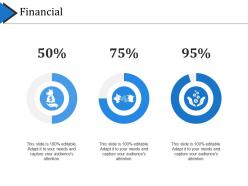
Presenting this set of slides with name - Financial Powerpoint Slide. This is a three stage process. The stages in this process are Business, Marketing, Percentage, Financial, Process.
-
 Liquidity ratios ppt examples slides
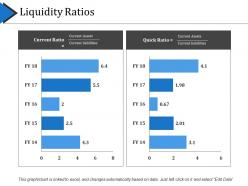
Presenting this set of slides with name - Liquidity Ratios Ppt Examples Slides. This is a two stage process. The stages in this process are Business, Marketing, Current Ratio, Quick Ratio, Finance.
-
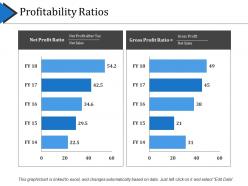 Profitability ratios powerpoint slides design
Presenting this set of slides with name - Profitability Ratios Powerpoint Slides Design. This is a two stage process. The stages in this process are Business, Net Profit Ratio, Gross Profit Ratio, Marketing.
-
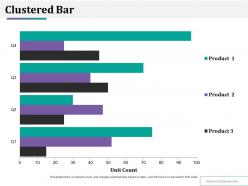 Clustered bar ppt styles slides
Presenting the clustered bar PPT style PowerPoint slide. Fully modifiable presentation slide as editing is possible. Presentable and easy to comprehend visual graphics. Beneficial for business professionals, managers, marketing executives, and sales people. Downloaded and saved in any desired format. It is available in both widescreen size and standard screen size. You can change the font type, font size, font style, icons and background color of the slide as per your requirement. Easy and quick download at the click of a button. This slide can be used with Google Slides.
-
 Clustered column ppt layouts display
Presenting the clustered column PPT layout presentation slide. Completely modifiable presentation slide. You have the access to transform the high-quality graphics in the PPT design. Beneficial for business professionals, managers, executives, researchers, sales people, etc. This PowerPoint template can be downloaded and saved in any desired format. Downloading is hassle-free and can be easily shared. You can insert your company name and logo in the slide. Replace the dummy content in text placeholders with your presentation content.
-
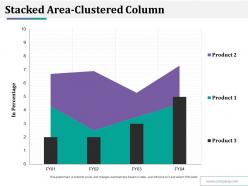 Stacked area clustered column ppt styles themes
Presenting this set of slides with name - Stacked Area Clustered Column Ppt Styles Themes. This is a three stage process. The stages in this process are Area Chart, Product, In Percentage.
-
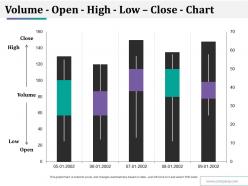 Volume open high low close chart ppt styles ideas
Presenting this set of slides with name - Volume Open High Low Close Chart Ppt Styles Ideas. This is a five stage process. The stages in this process are Close, High, Volume, Low, Open.
-
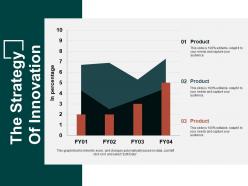 The strategy of innovation template 2 powerpoint slide backgrounds
Presenting this set of slides with name - The Strategy Of Innovation Template 2 Powerpoint Slide Backgrounds. This is a three stage process. The stages in this process are Area Chart, Marketing, Strategy, Finance, Business.
-
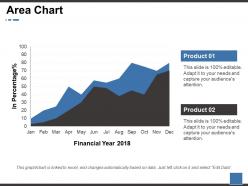 Area chart ppt layouts format ideas
Grab an opportunity to explore the area chart PowerPoint presentation slide. This presentation has been designed under the keen supervision of professionals and is fully editable. You can have access to change the font size, font type, colors, and even the background. This Template is agreeable with Google Slide and can be saved in JPG or PDF format without any fuss created during the process. Fast download at the click of the button shown below.
-
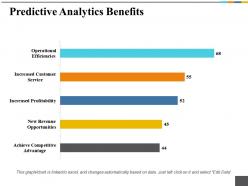 Predictive analytics benefits ppt summary objects
Introducing predictive analytics PowerPoint presentation slide. This presentation has been designed professionally and is fully editable. You can customize font size, font type, colors, and even the background. This Template is disciplinary with Google Slide and can be saved in JPG or PDF format without any resistance created during the process. Fast download at the click of the button.
-
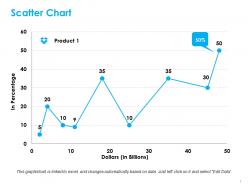 Scatter chart ppt styles graphics tutorials
Presenting this set of slides with name - Scatter Chart Ppt Styles Graphics Tutorials. This is a one stage process. The stages in this process are Scatter Chart, Finance, Marketing, Strategy, Business.
-
 Stacked area clustered column ppt summary smartart
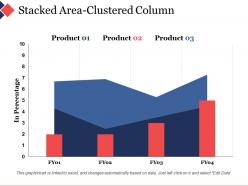
Presenting this set of slides with name - Stacked Area Clustered Column Ppt Summary Smartart. This is a three stage process. The stages in this process are Stacked Area, Clustered Column, Finance, Marketing, Strategy, Business.
-
 Area chart powerpoint slide design templates
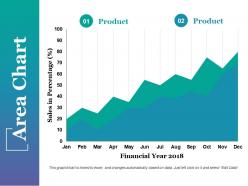
Introducing, area chart PowerPoint Presentation Slide. This Presentation has been designed professionally and is fully editable. You can remodel the font size, font type, colors, and even the background. This Template is disciplinary with Google Slide and can be saved in JPG or PDF format without any real time difficulty. Fast download at the click of the button.
-
 Stacked line chart ppt pictures example topics
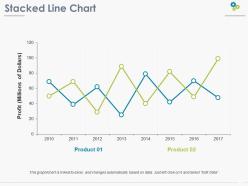
Presenting this set of slides with name - Stacked Line Chart Ppt Pictures Example Topics. This is a two stage process. The stages in this process are Profit, Line Chart, Years, Business, Marketing.
-
 Stacked line with markers ppt pictures graphics design
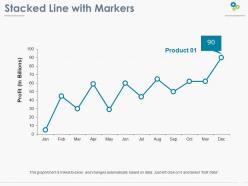
Presenting this set of slides with name - Stacked Line With Markers Ppt Pictures Graphics Design. This is a one stage process. The stages in this process are Profit, Years, Business, Marketing, Strategy.
-
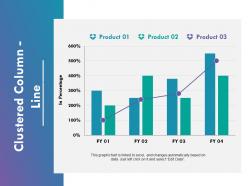 Clustered column line powerpoint slide design ideas powerpoint slide show
Presenting clustered column line PowerPoint slide design. Presentation template adapts well with Google slides. PPT design comes with access to add the trade details. Superlative picture quality as pixels doesn’t break on both standard and widescreen view. Fast download and can be converted into other formats such as JPG and PDF. Similar designs are easy to get with different nodes and stages. PPT graphic can be edited as per your preference.
-
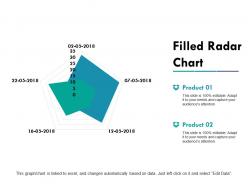 Filled radar chart presentation backgrounds powerpoint presentation examples
Introducing filled radar chart PowerPoint design. High quality PPT slide comes with modification options as color, text and font can be altered at any stage as required. Preference to deliver presentation graphic in standard and widescreen display. Swift download and easy to adapt with other softwares such as JPG and PDF. PowerPoint visual can be downloaded with different nodes and stages. Customize the design with company name, icon, image and even tagline.
-
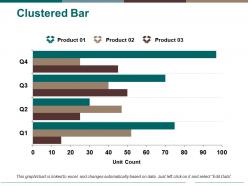 Clustered bar ppt summary background designs
Presenting the clustered bar PPT template. This creative presentation slide is designed by professionals and is fully editable in PowerPoint. It is easy to edit the objects like font color and font size in this template and save it in JPG or PDF file format. This template design is fully compatible with Google Slide. Download this fast at the click of the button.
-
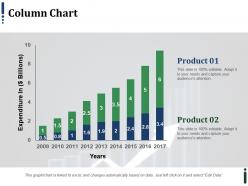 Column chart ppt infographics master slide
Presenting this set of slides with name - Column Chart Ppt Infographics Master Slide. This is a two stage process. The stages in this process are Bar Chart, Marketing, Strategy, Planning, Finance.
-
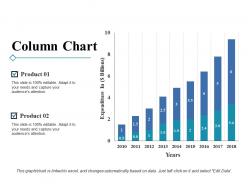 Column chart ppt styles display
Presenting this set of slides with name - Column Chart Ppt Styles Display. This is a two stage process. The stages in this process are Bar Chart, Marketing, Strategy, Planning, Finance.
-
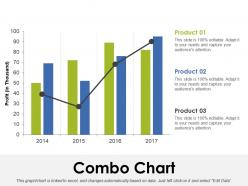 Combo chart ppt inspiration professional
Presenting this set of slides with name - Combo Chart Ppt Inspiration Professional. This is a four stage process. The stages in this process are Bar Chart, Marketing, Strategy, Planning, Finance.
-
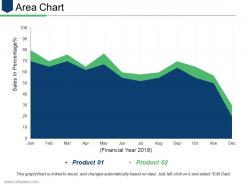 Area chart ppt infographic template shapes
Presenting area chart PPT infographic template shapes PPT slide. The area chart infographic PowerPoint template designed professionally by the team of SlideTeam to describe the usage of graphic visual representations of information, data, and knowledge. The infographic area chart slide value gets edited as a user can link this slide with the Excel. The area graph summary slide is customizable in PowerPoint as well as compatible with Google Slide. A user can edit the area chart slide such as font size, font type, color and dimensions to show the desired comparison between two things.
-
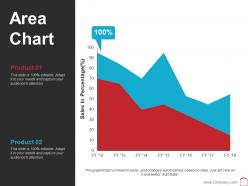 Area chart ppt summary slide portrait
Presenting area chart PPT summary slide portrait PPT slide. The area chart summary PowerPoint template designed professionally by the team of SlideTeam to describe the comparison between two products or project progress. The portrait area chart slide value gets edited as a presenter can link this slide with the Excel Sheet. The area graph summary slide is customizable in PowerPoint. The sale summary graph template is also compatible with Google Slide. A user can do alteration in the red blue area chart slide such as font size, font type, color and dimensions to present the desired comparison between two things.
-
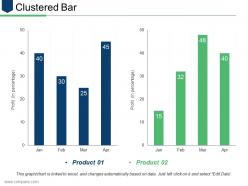 Clustered bar ppt outline backgrounds
Grab an opportunity to go through, clustered bar outline PowerPoint Presentation Slide. This Presentation has been designed under the keen sight of professionals and is fully editable. You can have access to change the font size, font type, colors, and even the background. This Template is practicable with Google Slide and can be saved in JPG or PDF format without any resistance created. Fast download at the click of the button provided below.
-
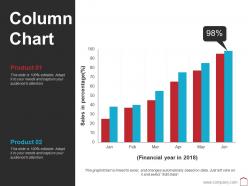 Column chart ppt visual aids deck
Grab an opportunity to see, column chart PowerPoint Presentation Slide. This Presentation has been designed under the strict supervision of professionals and is fully editable. You can reshape the font size, font type, colors, and even the background. This Template is achievable with Google Slide and can be saved in JPG or PDF format without any nuisance created. Fast download at the click of the button provided below.
-
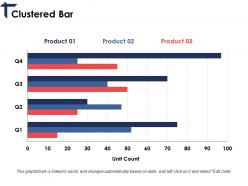 Clustered bar ppt slides topics
Sharing clustered bar PPT slides topics. Totally adaptable design as works well with Google slides. Presentation diagram can be downloaded in standard and widescreen view. Easy to edit as color, text and font are editable. PowerPoint template is available with different nodes and stages. PPT graphic is easy to save into JPG and PDF format. Great to use for business information as pixels don’t break even when shared on widescreen.
-
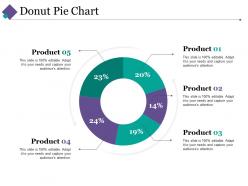 Donut pie chart ppt professional shapes
Delivering donut pie chart PPT professional shapes design. Presentation layout is compliant with number of software like JPG and PDF. PPT slide is easy to download and save. Awesome picture quality design comes with high resolution picture as pixels never break even on wide screen. PowerPoint slide merge well with Google slides. Preference to add commerce details such as name, logo and tagline. Fully modifiable presentation visual comes with e options as some elements can be edited.
-
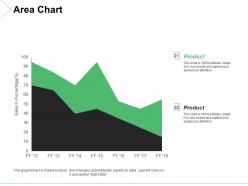 Area chart ppt outline designs download
Presenting this set of slides with name - Area Chart Ppt Outline Designs Download. This is a two stage process. The stages in this process are Area Chart, Finance, Marketing, Strategy, Business.
-
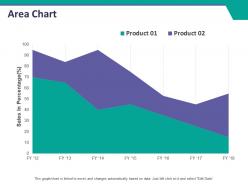 Area chart ppt summary design inspiration
Presenting this set of slides with name - Area Chart Ppt Summary Design Inspiration. This is a two stage process. The stages in this process are Area Chart, Finance, Marketing, Strategy, Business.
-
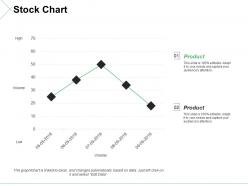 Stock chart ppt styles introduction
Presenting, our stock chart ppt styles introduction PPT template. This is a one-stage method which can be picked by managers, employees, and organizations for the stock chart representation. This is a thoroughly editable PowerPoint template which is simple to comprehend. Edit the color schemes and icons practiced here. Edit the text boxes and images used here as per the need. You can include your company logo and name in the template for a valid experience. Use this template with Google Slides and outline to a widescreen. Use in full screen 16:9 version for a great experience.
-
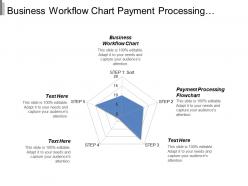 Business workflow chart payment processing flowchart change management cpb
Presenting this set of slides with name - Business Workflow Chart Payment Processing Flowchart Change Management Cpb. This is an editable five stages graphic that deals with topics like Business Workflow Chart, Payment Processing Flowchart, Change Management to help convey your message better graphically. This product is a premium product available for immediate download, and is 100 percent editable in Powerpoint. Download this now and use it in your presentations to impress your audience.
-
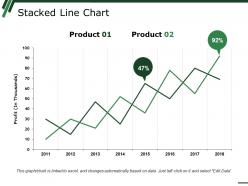 Stacked line chart ppt slides example introduction
Presenting Stacked Line Chart PPT Slides Example Introduction PPT slide. The Stacked Line PowerPoint template designed by the professional team of SlideTeam to discuss the collected data for a business which further helps in achieving the target. The line chart in the slide is customizable in PowerPoint and can help you in explaining the statistics importance. The line graph slide is compatible with Google Slide which makes easy for a user to share. You can change the font size, font type, color and design of icon to present the statistics data. You can insert text in placeholder.
-
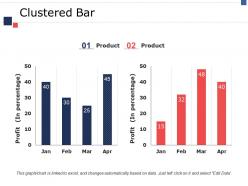 Clustered bar ppt model visuals
Presenting this set of slides with name - Clustered Bar Ppt Model Visuals. This is a two stage process. The stages in this process are Product, Profit, Bar Graph.
-
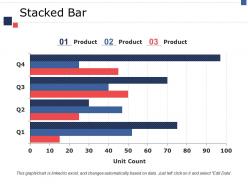 Stacked bar ppt show diagrams
Presenting this set of slides with name - Stacked Bar Ppt Show Diagrams. This is a three stage process. The stages in this process are Unit Count, Product, Stacked Bar.
-
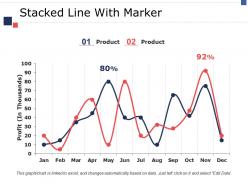 Stacked line with marker ppt model format
Presenting this set of slides with name - Stacked Line With Marker Ppt Model Format. This is a two stage process. The stages in this process are Product, Profit, Line Chart.
-
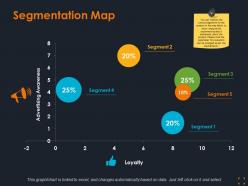 Segmentation map ppt summary example introduction
Presenting this set of slides with name - Segmentation Map Ppt Summary Example Introduction. This is a five stage process. The stages in this process are Business, Management, Finance, Marketing, Strategy.


