Graphique à secteurs coloré avec un design Powerpoint plat de graphiques de pourcentage
Contrôle à partir de la base avec notre graphique à secteurs coloré avec un design Powerpoint plat de graphiques de pourcentage. Livrez des marchandises n'importe où sur terre.
Contrôle à partir de la base avec notre graphique à secteurs coloré avec un design Powerpoint plat de graphiques de pource..
- Google Slides is a new FREE Presentation software from Google.
- All our content is 100% compatible with Google Slides.
- Just download our designs, and upload them to Google Slides and they will work automatically.
- Amaze your audience with SlideTeam and Google Slides.
-
Want Changes to This PPT Slide? Check out our Presentation Design Services
- WideScreen Aspect ratio is becoming a very popular format. When you download this product, the downloaded ZIP will contain this product in both standard and widescreen format.
-

- Some older products that we have may only be in standard format, but they can easily be converted to widescreen.
- To do this, please open the SlideTeam product in Powerpoint, and go to
- Design ( On the top bar) -> Page Setup -> and select "On-screen Show (16:9)” in the drop down for "Slides Sized for".
- The slide or theme will change to widescreen, and all graphics will adjust automatically. You can similarly convert our content to any other desired screen aspect ratio.
Compatible With Google Slides

Get This In WideScreen
You must be logged in to download this presentation.
Caractéristiques de ces diapositives de présentation PowerPoint :
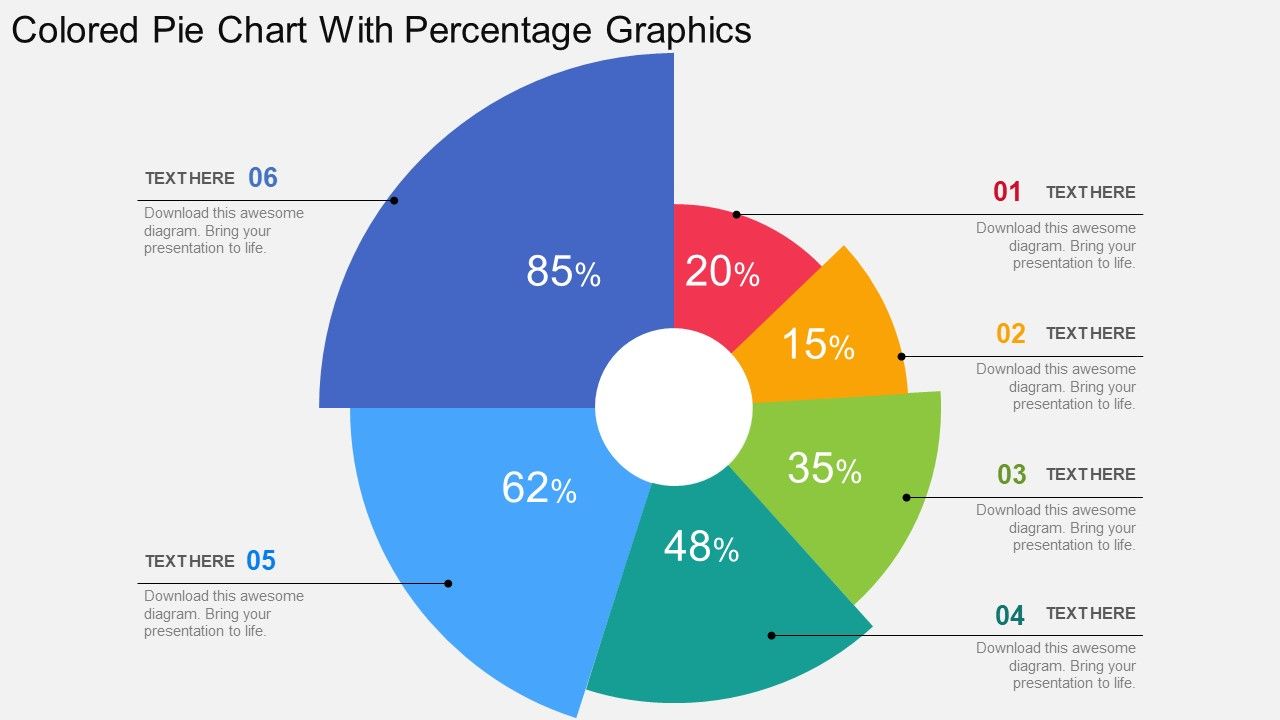
Nous sommes fiers de présenter notre graphique à secteurs coloré avec une conception PowerPoint à plat de graphiques en pourcentage. Le graphique du camembert coloré a été utilisé pour créer ce diagramme de modèle PowerPoint. Ce diagramme PPT contient le concept d'analyse financière. Utilisez ce diagramme PPT pour les présentations liées aux affaires et à la finance.
People who downloaded this PowerPoint presentation also viewed the following :
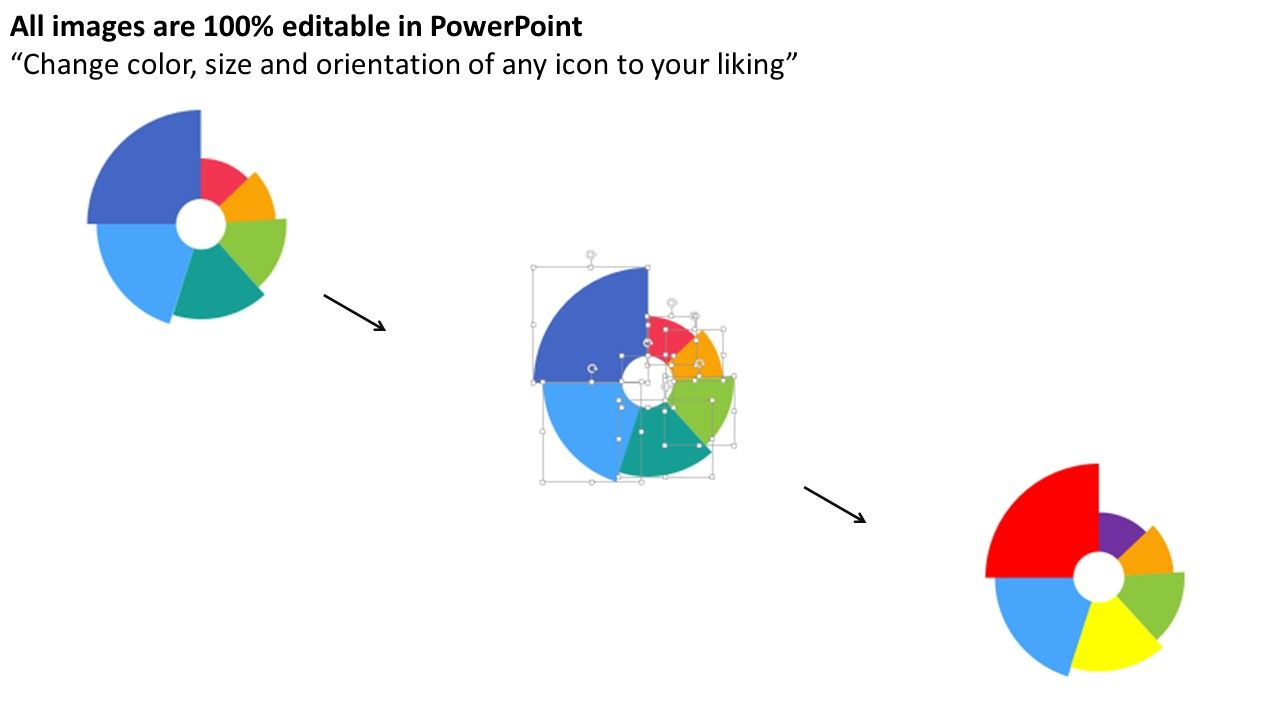
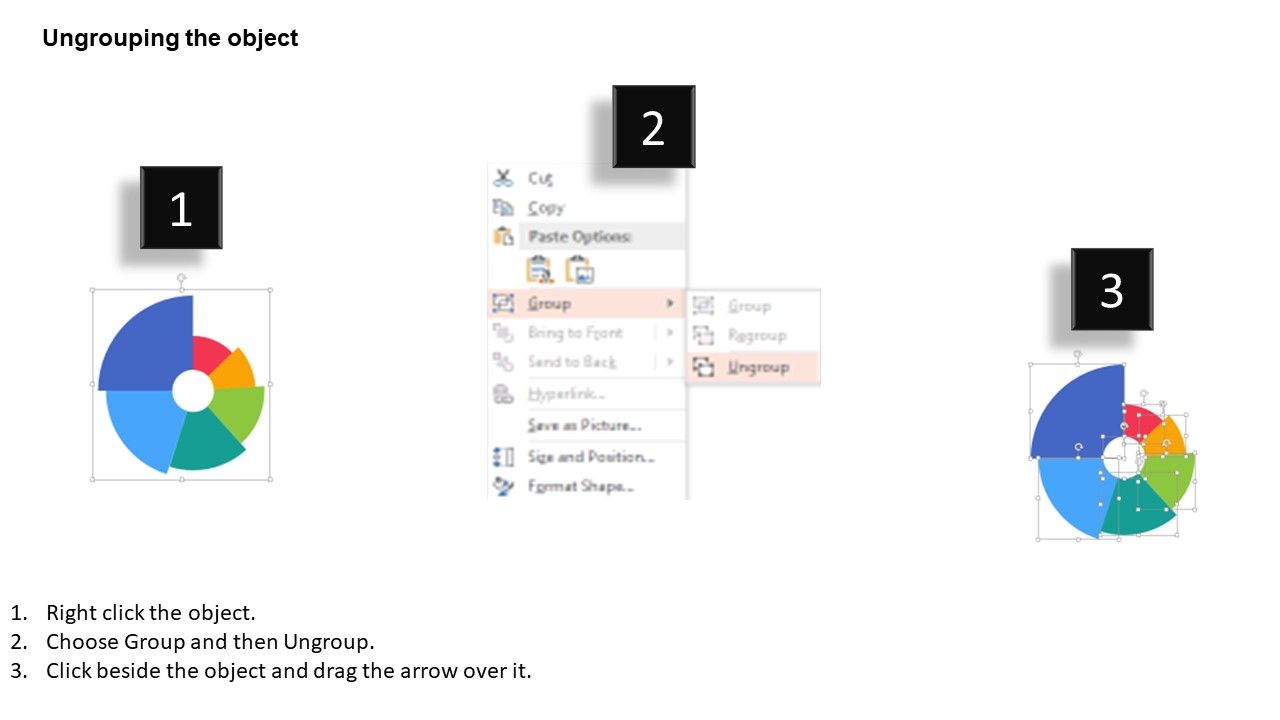
Camembert coloré avec graphique en pourcentage Conception Powerpoint plate avec les 4 diapositives :
Améliorez votre jeu avec notre graphique à secteurs coloré avec un design Powerpoint plat de graphiques en pourcentage. Ils ajoutent à votre agilité.
-
Awesome presentation, really professional and easy to edit.
-
Excellent products for quick understanding.


