Powerpoint Templates and Google slides for Percentages
Save Your Time and attract your audience with our fully editable PPT Templates and Slides.
-
 Percentage circle powerpoint ppt template bundles
Introduce your topic and host expert discussion sessions with this Percentage Circle Powerpoint Ppt Template Bundles. This template is designed using high-quality visuals, images, graphics, etc, that can be used to showcase your expertise. Different topics can be tackled using the thirteen slides included in this template. You can present each topic on a different slide to help your audience interpret the information more effectively. Apart from this, this PPT slideshow is available in two screen sizes, standard and widescreen making its delivery more impactful. This will not only help in presenting a birds-eye view of the topic but also keep your audience engaged. Since this PPT slideshow utilizes well-researched content, it induces strategic thinking and helps you convey your message in the best possible manner. The biggest feature of this design is that it comes with a host of editable features like color, font, background, etc. So, grab it now to deliver a unique presentation every time.
-
 Survey Result Percentage Powerpoint Ppt Template Bundles
Engage buyer personas and boost brand awareness by pitching yourself using this prefabricated set. This Survey Result Percentage Powerpoint Ppt Template Bundles is a great tool to connect with your audience as it contains high-quality content and graphics. This helps in conveying your thoughts in a well-structured manner. It also helps you attain a competitive advantage because of its unique design and aesthetics. In addition to this, you can use this PPT design to portray information and educate your audience on various topics. With fourteen slides, this is a great design to use for your upcoming presentations. Not only is it cost-effective but also easily pliable depending on your needs and requirements. As such color, font, or any other design component can be altered. It is also available for immediate download in different formats such as PNG, JPG, etc. So, without any further ado, download it now.
-
 Percentage Powerpoint Ppt Template Bundles
Deliver a lucid presentation by utilizing this Percentage Powerpoint Ppt Template Bundles. Use it to present an overview of the topic with the right visuals, themes, shapes, and graphics. This is an expertly designed complete deck that reinforces positive thoughts and actions. Use it to provide visual cues to your audience and help them make informed decisions. A wide variety of discussion topics can be covered with this creative bundle such as Ratio Analysis, Accounting,Discount. All the twalve slides are available for immediate download and use. They can be edited and modified to add a personal touch to the presentation. This helps in creating a unique presentation every time. Not only that, with a host of editable features, this presentation can be used by any industry or business vertical depending on their needs and requirements. The compatibility with Google Slides is another feature to look out for in the PPT slideshow.
-
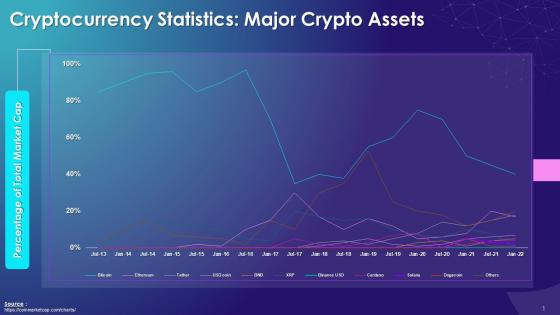 Major Crypto Assets By Percentage Of Total Market Capitalization Training Ppt
Presenting Major Crypto Assets By Percentage of Total Market Capitalization. This PPT presentation is thoroughly researched by the experts, and every slide consists of appropriate content. All slides are customizable. You can add or delete the content as per your need. Download this professionally designed business presentation, add your content, and present it with confidence.
-
 Percentage circle powerpoint ppt template bundles
Deliver a lucid presentation by utilizing this Percentage Circle Powerpoint Ppt Template Bundles. Use it to present an overview of the topic with the right visuals, themes, shapes, and graphics. This is an expertly designed complete deck that reinforces positive thoughts and actions. Use it to provide visual cues to your audience and help them make informed decisions. A wide variety of discussion topics can be covered with this creative bundle such as System Development Progress Circle, Percentage Circle Of Product Sales, Percentage Circle Of Project Management Process, Percentage Circle Of Project Team Performance. All the ten slides are available for immediate download and use. They can be edited and modified to add a personal touch to the presentation. This helps in creating a unique presentation every time. Not only that, with a host of editable features, this presentation can be used by any industry or business vertical depending on their needs and requirements. The compatibility with Google Slides is another feature to look out for in the PPT slideshow.
-
 Complete icon percentage arrow checklist document storage employee
Deliver a lucid presentation by utilizing this Complete Icon Percentage Arrow Checklist Document Storage Employee. Use it to present an overview of the topic with the right visuals, themes, shapes, and graphics. This is an expertly designed complete deck that reinforces positive thoughts and actions. Use it to provide visual cues to your audience and help them make informed decisions. A wide variety of discussion topics can be covered with this creative bundle such as Complete Icon, Percentage, Arrow, Checklist, Document. All the thirteen slides are available for immediate download and use. They can be edited and modified to add a personal touch to the presentation. This helps in creating a unique presentation every time. Not only that, with a host of editable features, this presentation can be used by any industry or business vertical depending on their needs and requirements. The compatibility with Google Slides is another feature to look out for in the PPT slideshow.
-
 Online Sales Icon Marketing Computer Percentage Dollar Website
This complete deck covers various topics and highlights important concepts. It has PPT slides which cater to your business needs. This complete deck presentation emphasizes Online Sales Icon Marketing Computer Percentage Dollar Website and has templates with professional background images and relevant content. This deck consists of total of twelve slides. Our designers have created customizable templates, keeping your convenience in mind. You can edit the colour, text and font size with ease. Not just this, you can also add or delete the content if needed. Get access to this fully editable complete presentation by clicking the download button below.
-
 Rebate Dollar Percentage Circle Arrow Coin Icon Monitor
This complete presentation has PPT slides on wide range of topics highlighting the core areas of your business needs. It has professionally designed templates with relevant visuals and subject driven content. This presentation deck has total of twelve slides. Get access to the customizable templates. Our designers have created editable templates for your convenience. You can edit the colour, text and font size as per your need. You can add or delete the content if required. You are just a click to away to have this ready-made presentation. Click the download button now.
-
 Business Segments Product Pyramid Financial Services Formation Cross Shape Percentage
It has PPT slides covering wide range of topics showcasing all the core areas of your business needs. This complete deck focuses on Business Segments Product Pyramid Financial Services Formation Cross Shape Percentage and consists of professionally designed templates with suitable graphics and appropriate content. This deck has total of twelve slides. Our designers have created customizable templates for your convenience. You can make the required changes in the templates like colour, text and font size. Other than this, content can be added or deleted from the slide as per the requirement. Get access to this professionally designed complete deck PPT presentation by clicking the download button below.
-
 4 Product Comparison Measure Requirements Manufacturing Experience Percentage
If you require a professional template with great design, then this 4 Product Comparison Measure Requirements Manufacturing Experience Percentage is an ideal fit for you. Deploy it to enthrall your audience and increase your presentation threshold with the right graphics, images, and structure. Portray your ideas and vision using twelve slides included in this complete deck. This template is suitable for expert discussion meetings presenting your views on the topic. With a variety of slides having the same thematic representation, this template can be regarded as a complete package. It employs some of the best design practices, so everything is well-structured. Not only this, it responds to all your needs and requirements by quickly adapting itself to the changes you make. This PPT slideshow is available for immediate download in PNG, JPG, and PDF formats, further enhancing its usability. Grab it by clicking the download button.
-
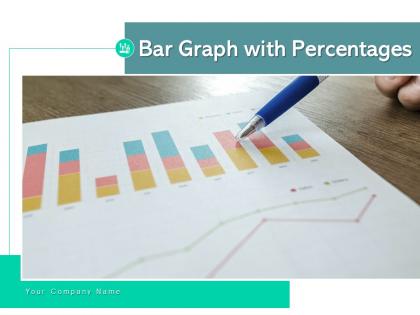 Bar graph with percentages budget allocation representing annual variance weekly product
Deliver a credible and compelling presentation by deploying this Bar Graph With Percentages Budget Allocation Representing Annual Variance Weekly Product. Intensify your message with the right graphics, images, icons, etc. presented in this complete deck. This PPT template is a great starting point to convey your messages and build a good collaboration. The twelve slides added to this PowerPoint slideshow helps you present a thorough explanation of the topic. You can use it to study and present various kinds of information in the form of stats, figures, data charts, and many more. This Bar Graph With Percentages Budget Allocation Representing Annual Variance Weekly Product PPT slideshow is available for use in standard and widescreen aspects ratios. So, you can use it as per your convenience. Apart from this, it can be downloaded in PNG, JPG, and PDF formats, all completely editable and modifiable. The most profound feature of this PPT design is that it is fully compatible with Google Slides making it suitable for every industry and business domain.
-
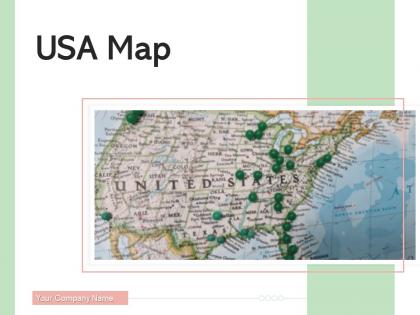 Usa map digitally created state division locations percentages
Deliver a credible and compelling presentation by deploying this USA Map Digitally Created State Division Locations Percentages. Intensify your message with the right graphics, images, icons, etc. presented in this complete deck. This PPT template is a great starting point to convey your messages and build a good collaboration. The twelve slides added to this PowerPoint slideshow helps you present a thorough explanation of the topic. You can use it to study and present various kinds of information in the form of stats, figures, data charts, and many more. This USA Map Digitally Created State Division Locations Percentages PPT slideshow is available for use in standard and widescreen aspects ratios. So, you can use it as per your convenience. Apart from this, it can be downloaded in PNG, JPG, and PDF formats, all completely editable and modifiable. The most profound feature of this PPT design is that it is fully compatible with Google Slides making it suitable for every industry and business domain.
-
 Conversion Rate Percentage Significance Product Conversion Growth Funnel Dollar
This complete deck covers various topics and highlights important concepts. It has PPT slides which cater to your business needs. This complete deck presentation emphasizes Conversion Rate Percentage Significance Product Conversion Growth Funnel Dollar and has templates with professional background images and relevant content. This deck consists of total of eleven slides. Our designers have created customizable templates, keeping your convenience in mind. You can edit the colour, text and font size with ease. Not just this, you can also add or delete the content if needed. Get access to this fully editable complete presentation by clicking the download button below.
-
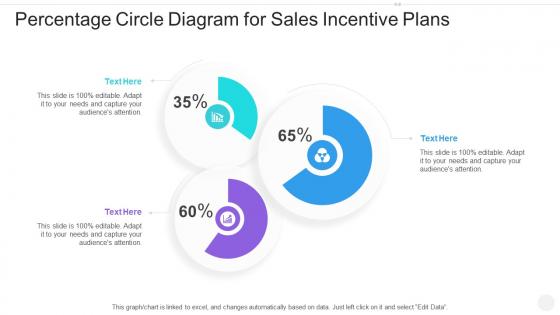 Percentage circle diagram for sales incentive plans infographic template
This is a single slide titled Percentage Circle Diagram For Sales Incentive Plans Infographic Template. It is crafted using high quality vector based visuals that are 100 percent editable and available for immediate download in standard and widescreen aspect ratios.
-
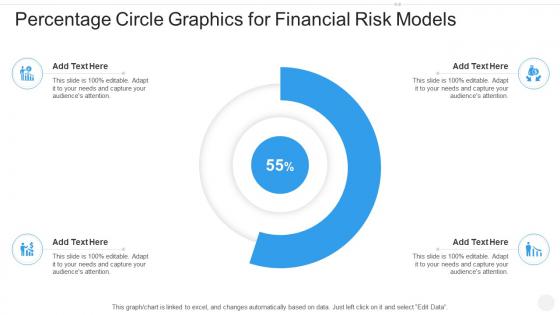 Percentage circle graphics for financial risk models infographic template
This is our Percentage Circle Graphics For Financial Risk Models Infographic Template designed in PowerPoint, however, you can also access it in Google Slides. It comes in two aspect ratios standard and widescreen, with fully editable visual content.
-
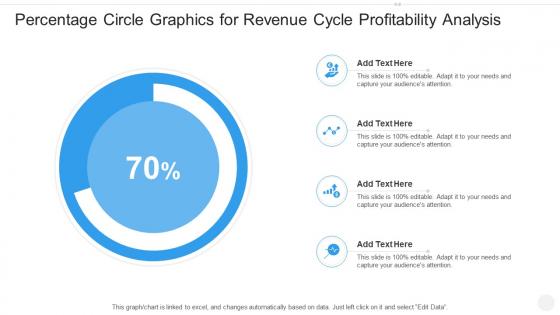 Percentage circle graphics for revenue cycle profitability analysis infographic template
Deploy our Percentage Circle Graphics For Revenue Cycle Profitability Analysis Infographic Template to present high quality presentations. It is designed in PowerPoint and is available for immediate download in standard and widescreen sizes. Not only this, but this layout is also 100 percent editable, giving you full control over its applications.
-
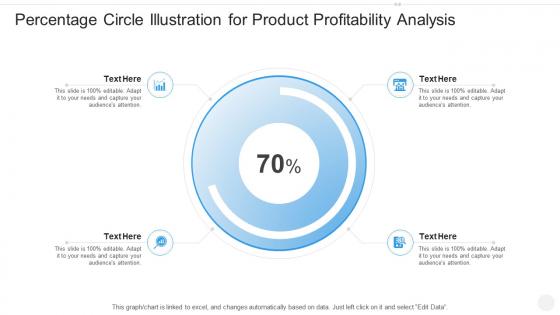 Percentage circle illustration for product profitability analysis infographic template
This is a single slide titled Percentage Circle Illustration For Product Profitability Analysis Infographic Template. It is crafted using high quality vector based visuals that are 100 percent editable and available for immediate download in standard and widescreen aspect ratios.
-
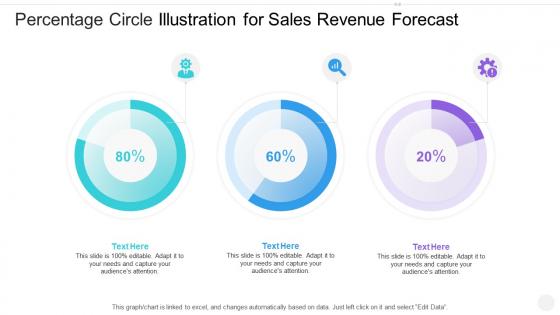 Percentage circle illustration for sales revenue forecast infographic template
This is our Percentage Circle Illustration For Sales Revenue Forecast Infographic Template designed in PowerPoint, however, you can also access it in Google Slides. It comes in two aspect ratios standard and widescreen, with fully editable visual content.
-
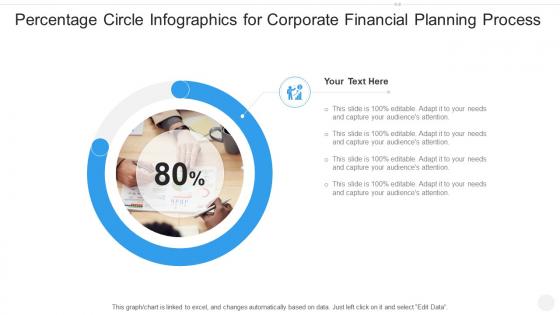 Percentage circle infographics for corporate financial planning process template
Deploy our Percentage Circle Infographics For Corporate Financial Planning Process Template to present high quality presentations. It is designed in PowerPoint and is available for immediate download in standard and widescreen sizes. Not only this, but this layout is also 100 percent editable, giving you full control over its applications.
-
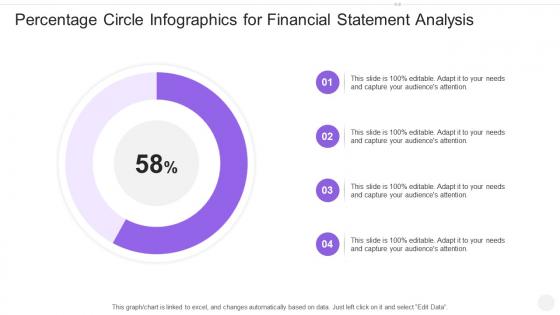 Percentage circle infographics for financial statement analysis template
This is a single slide titled Percentage Circle Infographics For Financial Statement Analysis Template. It is crafted using high quality vector based visuals that are 100 percent editable and available for immediate download in standard and widescreen aspect ratios.
-
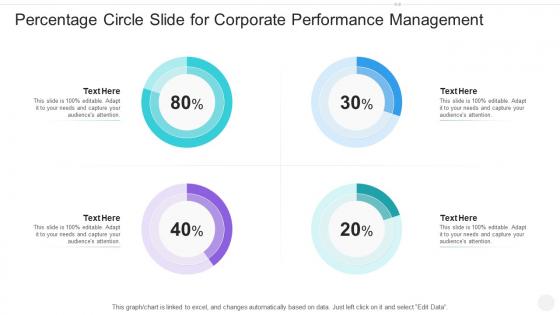 Percentage circle slide for corporate performance management infographic template
This is our Percentage Circle Slide For Corporate Performance Management Infographic Template designed in PowerPoint, however, you can also access it in Google Slides. It comes in two aspect ratios standard and widescreen, with fully editable visual content.
-
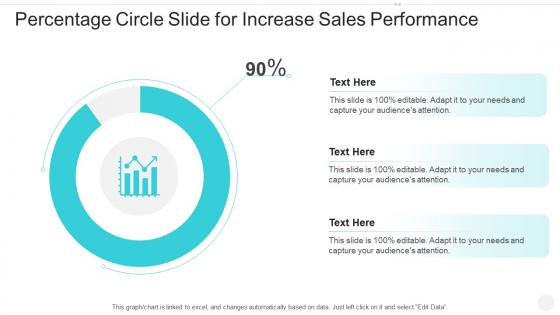 Percentage circle slide for increase sales performance infographic template
Deploy our Percentage Circle Slide For Increase Sales Performance Infographic Template to present high quality presentations. It is designed in PowerPoint and is available for immediate download in standard and widescreen sizes. Not only this, but this layout is also 100 percent editable, giving you full control over its applications.
-
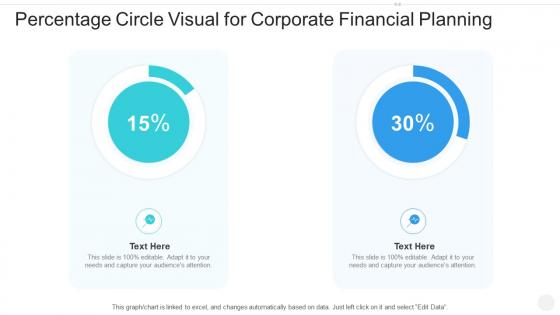 Percentage circle visual for corporate financial planning infographic template
This is a single slide titled Percentage Circle Visual For Corporate Financial Planning Infographic Template. It is crafted using high quality vector based visuals that are 100 percent editable and available for immediate download in standard and widescreen aspect ratios.
-
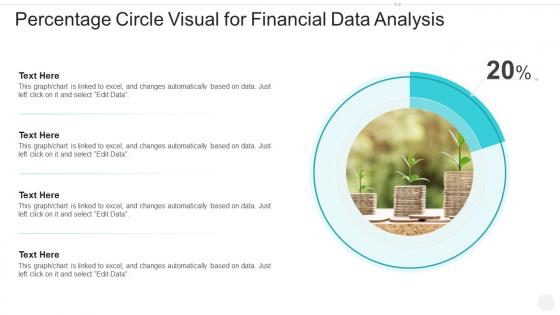 Percentage circle visual for financial data analysis infographic template
This is our Percentage Circle Visual For Financial Data Analysis Infographic Template designed in PowerPoint, however, you can also access it in Google Slides. It comes in two aspect ratios standard and widescreen, with fully editable visual content.
-
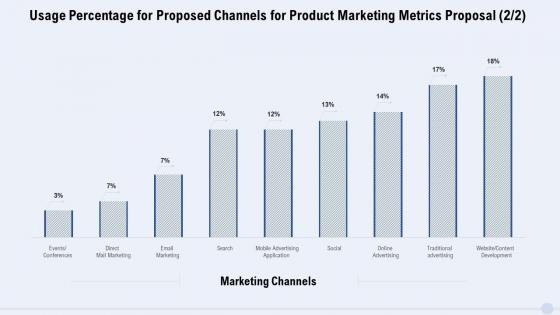 Usage percentage for proposed channels for product marketing metrics proposal
Deliver an outstanding presentation on the topic using this Usage Percentage For Proposed Channels For Product Marketing Metrics Proposal. Dispense information and present a thorough explanation of Marketing Channels, Events, Conferences, Direct Mail Marketing, Email Marketing, Search, Mobile Advertising, Application Online using the slides given. This template can be altered and personalized to fit your needs. It is also available for immediate download. So grab it now.
-
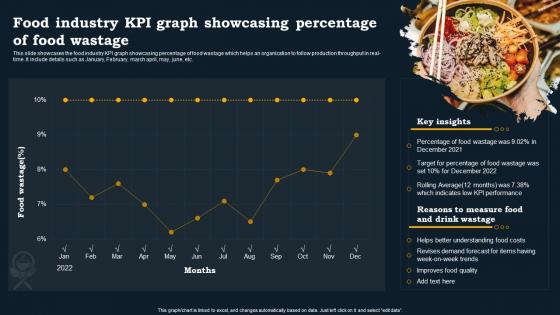 Food Industry KPI Graph Showcasing Percentage Of Food Wastage
This slide showcases the food industry KPI graph showcasing percentage of food wastage which helps an organization to follow production throughput in real time. It include details such as January, February, march april, may, june, etc. Presenting our well structured Food Industry KPI Graph Showcasing Percentage Of Food Wastage. The topics discussed in this slide are Industry, Percentage, Graph. This is an instantly available PowerPoint presentation that can be edited conveniently. Download it right away and captivate your audience.
-
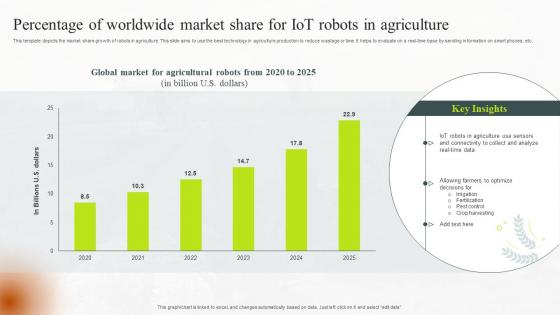 Percentage Of Worldwide Market Share For IoT Robots In Agriculture
This template depicts the market share growth of robots in agriculture. This slide aims to use the best technology in agriculture production to reduce wastage or time. It helps to evaluate on a real time base by sending information on smart phones, etc.Introducing our Percentage Of Worldwide Market Share For IoT Robots In Agriculture set of slides. The topics discussed in these slides are Agriculture Sensors, Global Market, Sensors Connectivity. This is an immediately available PowerPoint presentation that can be conveniently customized. Download it and convince your audience.
-
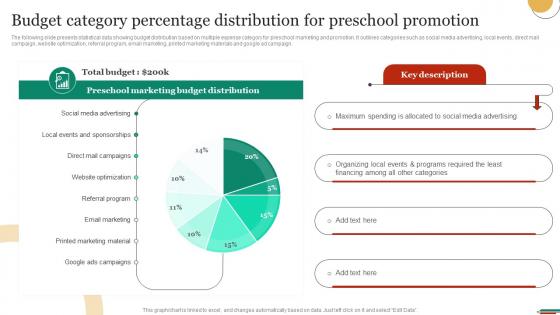 Budget Category Percentage Distribution For Marketing Strategies To Promote Strategy SS V
The following slide presents statistical data showing budget distribution based on multiple expense category for preschool marketing and promotion. It outlines categories such as social media advertising, local events, direct mail campaign, website optimization, referral program, email marketing, printed marketing materials and google ad campaign. Deliver an outstanding presentation on the topic using this Budget Category Percentage Distribution For Marketing Strategies To Promote Strategy SS V. Dispense information and present a thorough explanation of Budget, Category, Distribution using the slides given. This template can be altered and personalized to fit your needs. It is also available for immediate download. So grab it now.
-
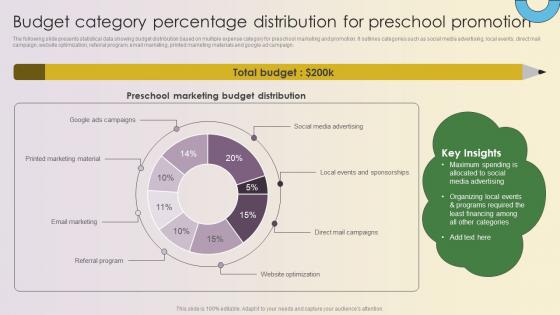 Key Strategies For Montessori Daycare Budget Category Percentage Distribution Strategy SS V
The following slide presents statistical data showing budget distribution based on multiple expense category for preschool marketing and promotion. It outlines categories such as social media advertising, local events, direct mail campaign, website optimization, referral program, email marketing, printed marketing materials and google ad campaign. Deliver an outstanding presentation on the topic using this Key Strategies For Montessori Daycare Budget Category Percentage Distribution Strategy SS V. Dispense information and present a thorough explanation of Preschool Marketing, Budget Distribution using the slides given. This template can be altered and personalized to fit your needs. It is also available for immediate download. So grab it now.
-
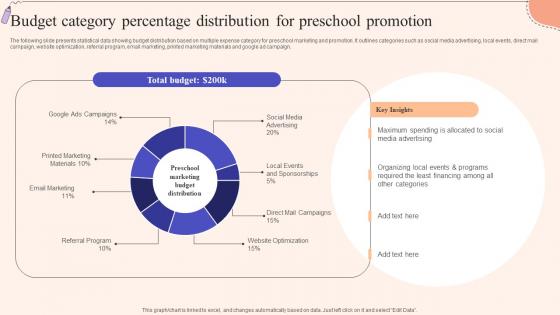 Budget Category Percentage Strategic Guide To Promote Early Childhood Strategy SS V
The following slide presents statistical data showing budget distribution based on multiple expense category for preschool marketing and promotion. It outlines categories such as social media advertising, local events, direct mail campaign, website optimization, referral program, email marketing, printed marketing materials and google ad campaign. Deliver an outstanding presentation on the topic using this Budget Category Percentage Strategic Guide To Promote Early Childhood Strategy SS V. Dispense information and present a thorough explanation of Category, Distribution, Promotion using the slides given. This template can be altered and personalized to fit your needs. It is also available for immediate download. So grab it now.
-
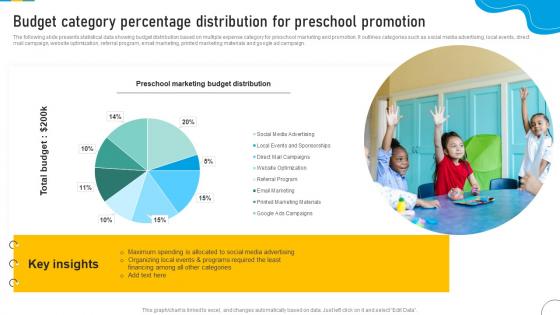 Budget Category Percentage Distribution Marketing Strategic Plan To Develop Brand Strategy SS V
The following slide presents statistical data showing budget distribution based on multiple expense category for preschool marketing and promotion. It outlines categories such as social media advertising, local events, direct mail campaign, website optimization, referral program, email marketing, printed marketing materials and google ad campaign. Deliver an outstanding presentation on the topic using this Budget Category Percentage Distribution Marketing Strategic Plan To Develop Brand Strategy SS V. Dispense information and present a thorough explanation of Preschool Marketing, Budget Distribution using the slides given. This template can be altered and personalized to fit your needs. It is also available for immediate download. So grab it now.
-
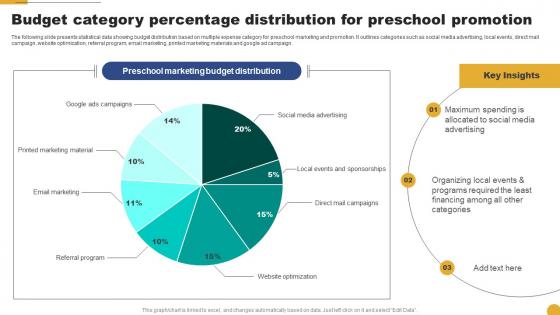 Budget Category Percentage Distribution For Preschool Kids School Promotion Plan Strategy SS V
The following slide presents statistical data showing budget distribution based on multiple expense category for preschool marketing and promotion. It outlines categories such as social media advertising, local events, direct mail campaign, website optimization, referral program, email marketing, printed marketing materials and google ad campaign. Present the topic in a bit more detail with this Budget Category Percentage Distribution For Preschool Kids School Promotion Plan Strategy SS V. Use it as a tool for discussion and navigation on Preschool Marketing, Budget Distribution. This template is free to edit as deemed fit for your organization. Therefore download it now.
-
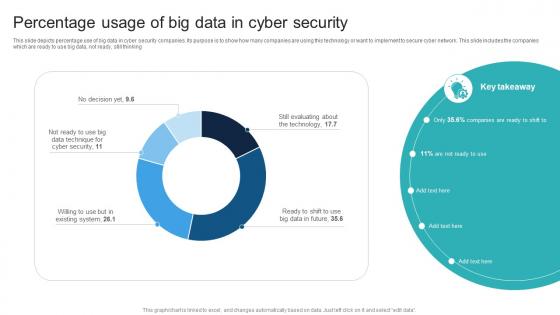 Percentage Usage Of Big Data In Cyber Security
This slide depicts percentage use of big data in cyber security companies. Its purpose is to show how many companies are using this technology or want to implement to secure cyber network. This slide includes the companies which are ready to use big data, not ready, still thinking Introducing our Percentage Usage Of Big Data In Cyber Security set of slides. The topics discussed in these slides are Security, Cyber, Percentage. This is an immediately available PowerPoint presentation that can be conveniently customized. Download it and convince your audience.
-
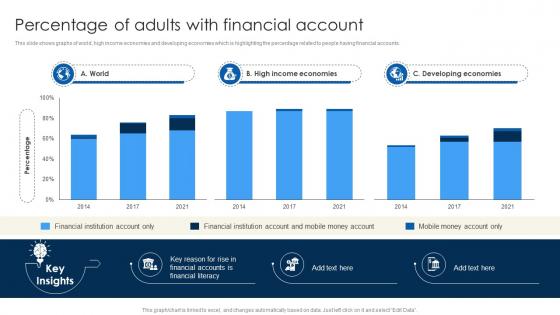 Percentage Of Adults Financial Inclusion To Promote Economic Fin SS
This slide shows graphs of world, high income economies and developing economies which is highlighting the percentage related to people having financial accounts. Deliver an outstanding presentation on the topic using this Percentage Of Adults Financial Inclusion To Promote Economic Fin SS. Dispense information and present a thorough explanation of Key Reason, Financial Accounts, Financial Literacy using the slides given. This template can be altered and personalized to fit your needs. It is also available for immediate download. So grab it now.
-
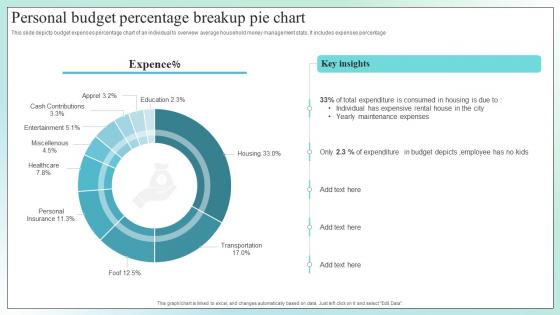 Personal Budget Percentage Breakup Pie Chart
This slide depicts budget expenses percentage chart of an individual to overview average household money management stats. It includes expenses percentage. Introducing our Personal Budget Percentage Breakup Pie Chart set of slides. The topics discussed in these slides are Expenditure In Budget Depicts, Maintenance Expenses, Expenditure Is Consumed This is an immediately available PowerPoint presentation that can be conveniently customized. Download it and convince your audience.
-
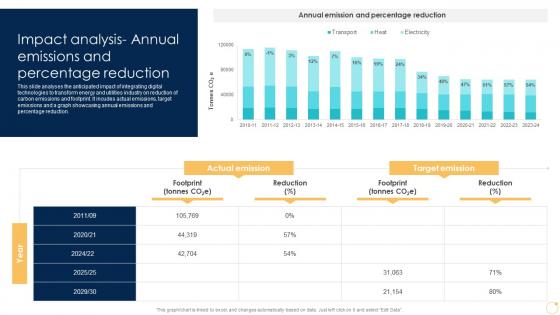 Impact Analysis Annual Emissions And Percentage Reduction Enabling Growth Centric DT SS
This slide analyses the anticipated impact of integrating digital technologies to transform energy and utilities industry on reduction of carbon emissions and footprint. It incudes actual emissions, target emissions and a graph showcasing annual emissions and percentage reduction. Present the topic in a bit more detail with this Impact Analysis Annual Emissions And Percentage Reduction Enabling Growth Centric DT SS Use it as a tool for discussion and navigation on Actual Emission, Target Emission, Footprint This template is free to edit as deemed fit for your organization. Therefore download it now.
-
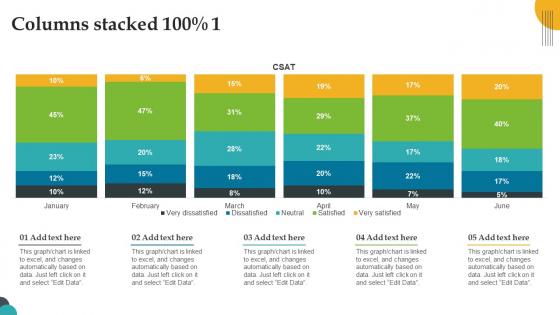 Columns Stacked 100 Percentage 1 PU Chart SS
Presenting our well structured Columns Stacked 100 Percentage 1 PU Chart SS. The topics discussed in this slide are Columns Stacked 100 Percentage 1. This is an instantly available PowerPoint presentation that can be edited conveniently. Download it right away and captivate your audience.
-
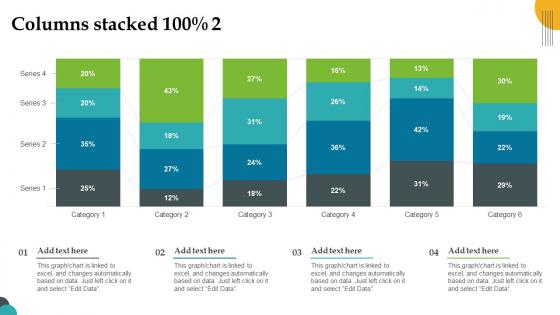 Columns Stacked 100 Percentage 2 PU Chart SS
Introducing our Columns Stacked 100 Percentage 2 PU Chart SS set of slides. The topics discussed in these slides are Columns Stacked 100 Percentage 2. This is an immediately available PowerPoint presentation that can be conveniently customized. Download it and convince your audience.
-
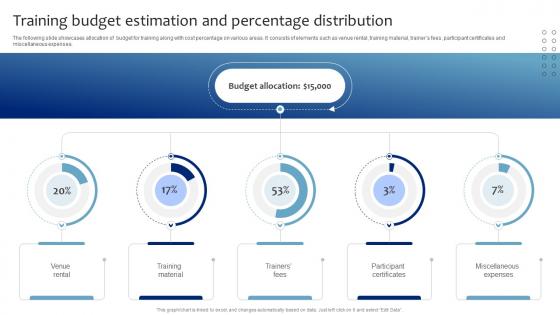 Training Budget Estimation And Percentage Strategic Presentation Skills Enhancement DTE SS
The following slide showcases allocation of budget for training along with cost percentage on various areas. It consists of elements such as venue rental, training material, trainers fees, participant certificates and miscellaneous expenses. Present the topic in a bit more detail with this Training Budget Estimation And Percentage Strategic Presentation Skills Enhancement DTE SS. Use it as a tool for discussion and navigation on Budget Allocation, Training Material, Participant Certificates. This template is free to edit as deemed fit for your organization. Therefore download it now.
-
 Annual percentage rate charge ppt powerpoint presentation professional templates cpb
Presenting our Annual Percentage Rate Charge Ppt Powerpoint Presentation Professional Templates Cpb PowerPoint template design. This PowerPoint slide showcases three stages. It is useful to share insightful information on Annual Percentage Rate Charge This PPT slide can be easily accessed in standard screen and widescreen aspect ratios. It is also available in various formats like PDF, PNG, and JPG. Not only this, the PowerPoint slideshow is completely editable and you can effortlessly modify the font size, font type, and shapes according to your wish. Our PPT layout is compatible with Google Slides as well, so download and edit it as per your knowledge.
-
 Calculate investment percentage ppt powerpoint presentation ideas designs cpb
Presenting Calculate Investment Percentage Ppt Powerpoint Presentation Ideas Designs Cpb slide which is completely adaptable. The graphics in this PowerPoint slide showcase four stages that will help you succinctly convey the information. In addition, you can alternate the color, font size, font type, and shapes of this PPT layout according to your content. This PPT presentation can be accessed with Google Slides and is available in both standard screen and widescreen aspect ratios. It is also a useful set to elucidate topics like Calculate Investment Percentage. This well structured design can be downloaded in different formats like PDF, JPG, and PNG. So, without any delay, click on the download button now.
-
 Annual percentage rate example ppt powerpoint presentation layouts model cpb
Presenting Annual Percentage Rate Example Ppt Powerpoint Presentation Layouts Model Cpb slide which is completely adaptable. The graphics in this PowerPoint slide showcase four stages that will help you succinctly convey the information. In addition, you can alternate the color, font size, font type, and shapes of this PPT layout according to your content. This PPT presentation can be accessed with Google Slides and is available in both standard screen and widescreen aspect ratios. It is also a useful set to elucidate topics like Annual Percentage Rate Example. This well structured design can be downloaded in different formats like PDF, JPG, and PNG. So, without any delay, click on the download button now.
-
 Achievement percentage powerpoint ppt template bundles
If you require a professional template with great design, then this Achievement Percentage Powerpoint Ppt Template Bundles is an ideal fit for you. Deploy it to enthrall your audience and increase your presentation threshold with the right graphics, images, and structure. Portray your ideas and vision using twelve slides included in this complete deck. This template is suitable for expert discussion meetings presenting your views on the topic. With a variety of slides having the same thematic representation, this template can be regarded as a complete package. It employs some of the best design practices, so everything is well-structured. Not only this, it responds to all your needs and requirements by quickly adapting itself to the changes you make. This PPT slideshow is available for immediate download in PNG, JPG, and PDF formats, further enhancing its usability. Grab it by clicking the download button.
-
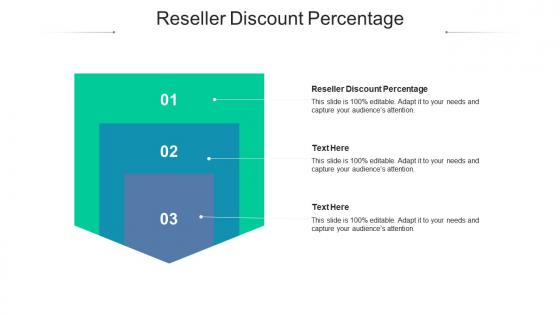 Reseller discount percentage ppt powerpoint presentation file templates cpb
Presenting Reseller Discount Percentage Ppt Powerpoint Presentation File Templates Cpb slide which is completely adaptable. The graphics in this PowerPoint slide showcase three stages that will help you succinctly convey the information. In addition, you can alternate the color, font size, font type, and shapes of this PPT layout according to your content. This PPT presentation can be accessed with Google Slides and is available in both standard screen and widescreen aspect ratios. It is also a useful set to elucidate topics like Reseller Discount Percentage. This well-structured design can be downloaded in different formats like PDF, JPG, and PNG. So, without any delay, click on the download button now.
-
 Cost revenue percentage ppt powerpoint presentation ideas graphic images cpb
Presenting Cost Revenue Percentage Ppt Powerpoint Presentation Ideas Graphic Images Cpb slide which is completely adaptable. The graphics in this PowerPoint slide showcase four stages that will help you succinctly convey the information. In addition, you can alternate the color, font size, font type, and shapes of this PPT layout according to your content. This PPT presentation can be accessed with Google Slides and is available in both standard screen and widescreen aspect ratios. It is also a useful set to elucidate topics like Cost Revenue Percentage. This well-structured design can be downloaded in different formats like PDF, JPG, and PNG. So, without any delay, click on the download button now.
-
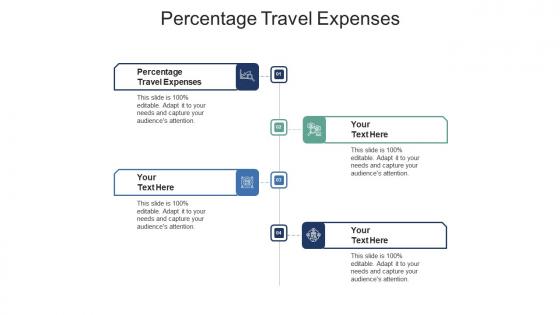 Percentage travel expenses ppt powerpoint presentation layouts background designs cpb
Presenting our Percentage Travel Expenses Ppt Powerpoint Presentation Layouts Background Designs Cpb PowerPoint template design. This PowerPoint slide showcases four stages. It is useful to share insightful information on Percentage Travel Expenses This PPT slide can be easily accessed in standard screen and widescreen aspect ratios. It is also available in various formats like PDF, PNG, and JPG. Not only this, the PowerPoint slideshow is completely editable and you can effortlessly modify the font size, font type, and shapes according to your wish. Our PPT layout is compatible with Google Slides as well, so download and edit it as per your knowledge.
-
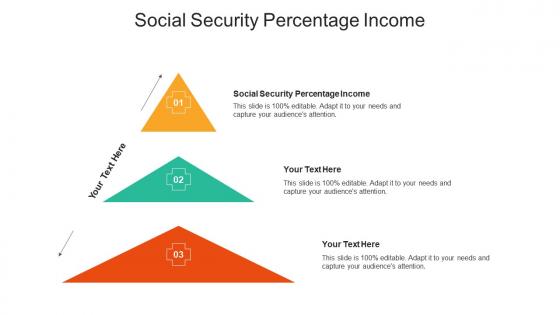 Social security percentage income ppt powerpoint presentation ideas show cpb
Presenting Social Security Percentage Income Ppt Powerpoint Presentation Ideas Show Cpb slide which is completely adaptable. The graphics in this PowerPoint slide showcase three stages that will help you succinctly convey the information. In addition, you can alternate the color, font size, font type, and shapes of this PPT layout according to your content. This PPT presentation can be accessed with Google Slides and is available in both standard screen and widescreen aspect ratios. It is also a useful set to elucidate topics like Social Security Percentage Income. This well structured design can be downloaded in different formats like PDF, JPG, and PNG. So, without any delay, click on the download button now.
-
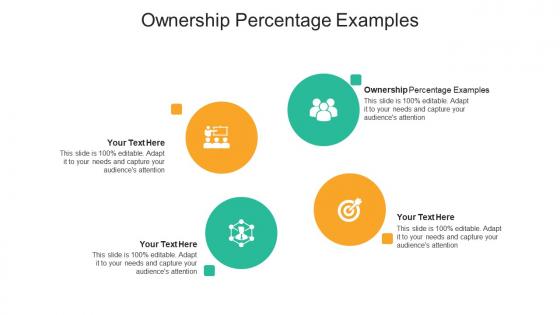 Ownership percentage examples ppt powerpoint presentation infographics design ideas cpb
Presenting Ownership Percentage Examples Ppt Powerpoint Presentation Infographics Design Ideas Cpb slide which is completely adaptable. The graphics in this PowerPoint slide showcase four stages that will help you succinctly convey the information. In addition, you can alternate the color, font size, font type, and shapes of this PPT layout according to your content. This PPT presentation can be accessed with Google Slides and is available in both standard screen and widescreen aspect ratios. It is also a useful set to elucidate topics like Ownership Percentage Examples. This well structured design can be downloaded in different formats like PDF, JPG, and PNG. So, without any delay, click on the download button now.
-
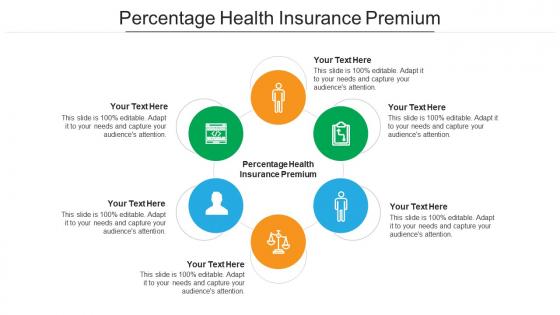 Percentage health insurance premium ppt powerpoint presentation pictures layout cpb
Presenting Percentage Health Insurance Premium Ppt Powerpoint Presentation Pictures Layout Cpb slide which is completely adaptable. The graphics in this PowerPoint slide showcase six stages that will help you succinctly convey the information. In addition, you can alternate the color, font size, font type, and shapes of this PPT layout according to your content. This PPT presentation can be accessed with Google Slides and is available in both standard screen and widescreen aspect ratios. It is also a useful set to elucidate topics like Percentage Health Insurance Premium. This well structured design can be downloaded in different formats like PDF, JPG, and PNG. So, without any delay, click on the download button now.
-
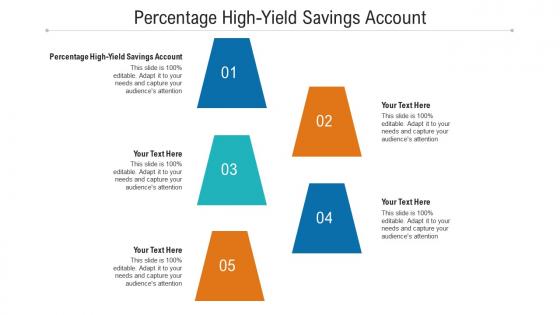 Percentage high yield savings account ppt powerpoint presentation show example file cpb
Presenting our Percentage High Yield Savings Account Ppt Powerpoint Presentation Show Example File Cpb PowerPoint template design. This PowerPoint slide showcases five stages. It is useful to share insightful information on Percentage High Yield Savings Account This PPT slide can be easily accessed in standard screen and widescreen aspect ratios. It is also available in various formats like PDF, PNG, and JPG. Not only this, the PowerPoint slideshow is completely editable and you can effortlessly modify the font size, font type, and shapes according to your wish. Our PPT layout is compatible with Google Slides as well, so download and edit it as per your knowledge.
-
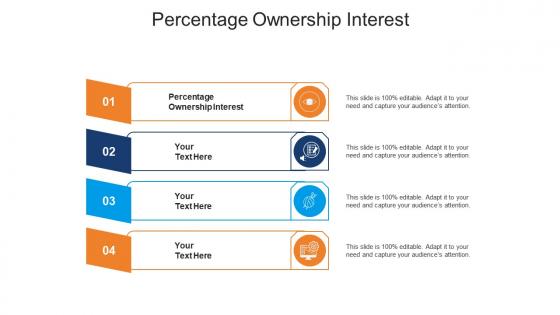 Percentage ownership interest ppt powerpoint presentation visual aids files cpb
Presenting Percentage Ownership Interest Ppt Powerpoint Presentation Visual Aids Files Cpb slide which is completely adaptable. The graphics in this PowerPoint slide showcase four stages that will help you succinctly convey the information. In addition, you can alternate the color, font size, font type, and shapes of this PPT layout according to your content. This PPT presentation can be accessed with Google Slides and is available in both standard screen and widescreen aspect ratios. It is also a useful set to elucidate topics like Percentage Ownership Interest. This well structured design can be downloaded in different formats like PDF, JPG, and PNG. So, without any delay, click on the download button now.
-
 Profit sharing bonus percentage ppt powerpoint presentation model designs download cpb
Presenting Profit Sharing Bonus Percentage Ppt Powerpoint Presentation Model Designs Download Cpb slide which is completely adaptable. The graphics in this PowerPoint slide showcase four stages that will help you succinctly convey the information. In addition, you can alternate the color, font size, font type, and shapes of this PPT layout according to your content. This PPT presentation can be accessed with Google Slides and is available in both standard screen and widescreen aspect ratios. It is also a useful set to elucidate topics like Profit Sharing Bonus Percentage. This well structured design can be downloaded in different formats like PDF, JPG, and PNG. So, without any delay, click on the download button now.
-
 Percentage labor cost ppt powerpoint presentation portfolio skills cpb
Presenting our Percentage Labor Cost Ppt Powerpoint Presentation Portfolio Skills Cpb PowerPoint template design. This PowerPoint slide showcases three stages. It is useful to share insightful information on Percentage Labor Cost This PPT slide can be easily accessed in standard screen and widescreen aspect ratios. It is also available in various formats like PDF, PNG, and JPG. Not only this, the PowerPoint slideshow is completely editable and you can effortlessly modify the font size, font type, and shapes according to your wish. Our PPT layout is compatible with Google Slides as well, so download and edit it as per your knowledge.
-
 Social security tax percentage ppt powerpoint presentation professional layouts cpb
Presenting Social Security Tax Percentage Ppt Powerpoint Presentation Professional Layouts Cpb slide which is completely adaptable. The graphics in this PowerPoint slide showcase six stages that will help you succinctly convey the information. In addition, you can alternate the color, font size, font type, and shapes of this PPT layout according to your content. This PPT presentation can be accessed with Google Slides and is available in both standard screen and widescreen aspect ratios. It is also a useful set to elucidate topics like Social Security Tax Percentage. This well structured design can be downloaded in different formats like PDF, JPG, and PNG. So, without any delay, click on the download button now.
-
 Percentage Interest Icon On Business Debt Raising Requirements
Presenting our set of slides with Percentage Interest Icon On Business Debt Raising Requirements. This exhibits information on three stages of the process. This is an easy to edit and innovatively designed PowerPoint template. So download immediately and highlight information on Percentage Interest Business, Debt Raising Requirements.
-
 Average Annual Percentage Rate In Powerpoint And Google Slides Cpb
Presenting our Average Annual Percentage Rate In Powerpoint And Google Slides Cpb PowerPoint template design. This PowerPoint slide showcases five stages. It is useful to share insightful information on Average Annual Percentage Rate. This PPT slide can be easily accessed in standard screen and widescreen aspect ratios. It is also available in various formats like PDF, PNG, and JPG. Not only this, the PowerPoint slideshow is completely editable and you can effortlessly modify the font size, font type, and shapes according to your wish. Our PPT layout is compatible with Google Slides as well, so download and edit it as per your knowledge.
-
 Stock Percentage Change Chart In Powerpoint And Google Slides Cpb
Presenting our Stock Percentage Change Chart In Powerpoint And Google Slides Cpb PowerPoint template design. This PowerPoint slide showcases five stages. It is useful to share insightful information on Stock Percentage Change Chart. This PPT slide can be easily accessed in standard screen and widescreen aspect ratios. It is also available in various formats like PDF, PNG, and JPG. Not only this, the PowerPoint slideshow is completely editable and you can effortlessly modify the font size, font type, and shapes according to your wish. Our PPT layout is compatible with Google Slides as well, so download and edit it as per your knowledge.
-
 Portfolio Diversification Percentages In Powerpoint And Google Slides Cpb
Presenting Portfolio Diversification Percentages In Powerpoint And Google Slides Cpb slide which is completely adaptable. The graphics in this PowerPoint slide showcase three stages that will help you succinctly convey the information. In addition, you can alternate the color, font size, font type, and shapes of this PPT layout according to your content. This PPT presentation can be accessed with Google Slides and is available in both standard screen and widescreen aspect ratios. It is also a useful set to elucidate topics like Portfolio Diversification. This well structured design can be downloaded in different formats like PDF, JPG, and PNG. So, without any delay, click on the download button now.
-
 Portfolio Percentage In Powerpoint And Google Slides Cpb
Presenting our Portfolio Percentage In Powerpoint And Google Slides Cpb PowerPoint template design. This PowerPoint slide showcases five stages. It is useful to share insightful information on Portfolio Percentage. This PPT slide can be easily accessed in standard screen and widescreen aspect ratios. It is also available in various formats like PDF, PNG, and JPG. Not only this, the PowerPoint slideshow is completely editable and you can effortlessly modify the font size, font type, and shapes according to your wish. Our PPT layout is compatible with Google Slides as well, so download and edit it as per your knowledge.
-
 Increase Heart Function Percentage In Powerpoint And Google Slides Cpb
Presenting our Increase Heart Function Percentage In Powerpoint And Google Slides Cpb PowerPoint template design. This PowerPoint slide showcases four stages. It is useful to share insightful information on Increase Heart Function Percentage. This PPT slide can be easily accessed in standard screen and widescreen aspect ratios. It is also available in various formats like PDF, PNG, and JPG. Not only this, the PowerPoint slideshow is completely editable and you can effortlessly modify the font size, font type, and shapes according to your wish. Our PPT layout is compatible with Google Slides as well, so download and edit it as per your knowledge.


