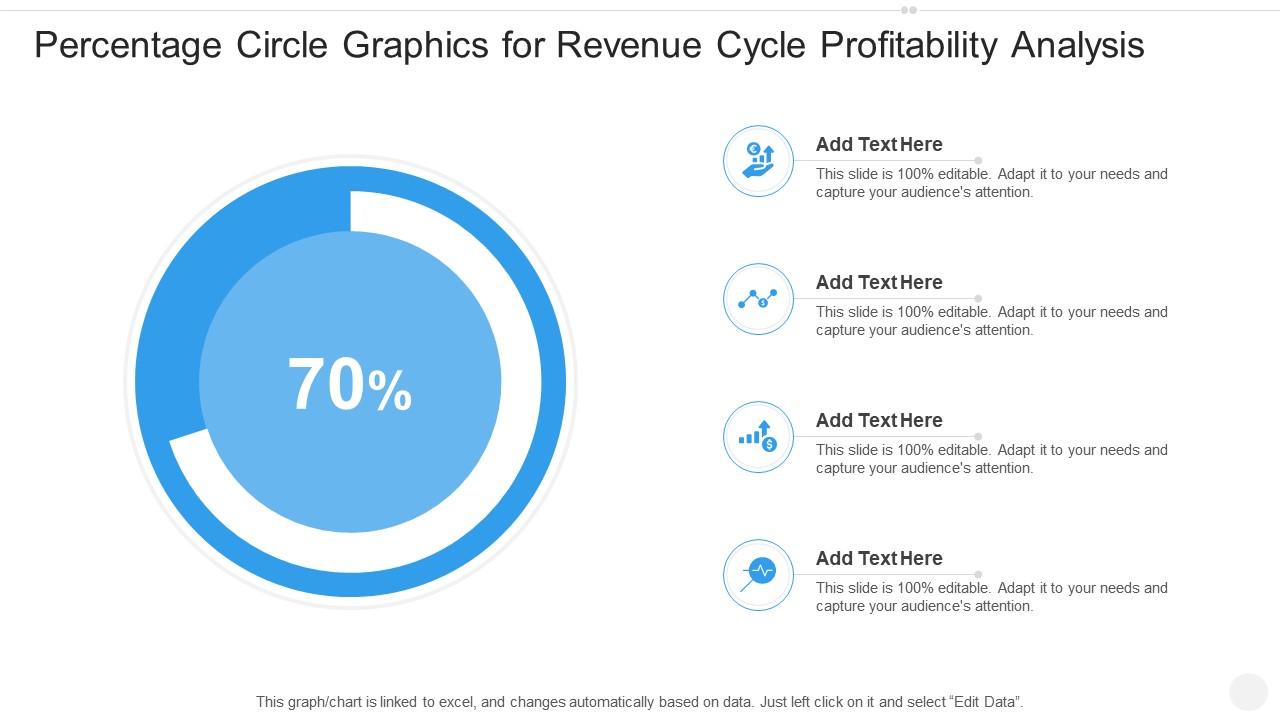
Percentage circle graphics for revenue cycle profitability analysis infographic template
Give your usual presentation a brand new look by enhancing its aesthetics using this Percentage Circle Graphics For Revenue Cycle Profitability Analysis Infographic Template. This PPT slide is drafted using different vector based icons, graphics, and other visual content that can be used by any industry professional. As such, it can be used to display and share information on any topic. With a combination of invaluable information and visual content, this is a great template to use for impressing your viewers, staff, management, or any other individual. This template is designed in such a way that it will not only help you give clarifiers but also reinforce positive actions by your target audience. The feature of in built editable components further adds to the versatility of this slide. Therefore, download it now.
Give your usual presentation a brand new look by enhancing its aesthetics using this Percentage Circle Graphics For Revenue..
- Google Slides is a new FREE Presentation software from Google.
- All our content is 100% compatible with Google Slides.
- Just download our designs, and upload them to Google Slides and they will work automatically.
- Amaze your audience with SlideTeam and Google Slides.
-
Want Changes to This PPT Slide? Check out our Presentation Design Services
- WideScreen Aspect ratio is becoming a very popular format. When you download this product, the downloaded ZIP will contain this product in both standard and widescreen format.
-

- Some older products that we have may only be in standard format, but they can easily be converted to widescreen.
- To do this, please open the SlideTeam product in Powerpoint, and go to
- Design ( On the top bar) -> Page Setup -> and select "On-screen Show (16:9)” in the drop down for "Slides Sized for".
- The slide or theme will change to widescreen, and all graphics will adjust automatically. You can similarly convert our content to any other desired screen aspect ratio.
Compatible With Google Slides

Get This In WideScreen
You must be logged in to download this presentation.
PowerPoint presentation slides
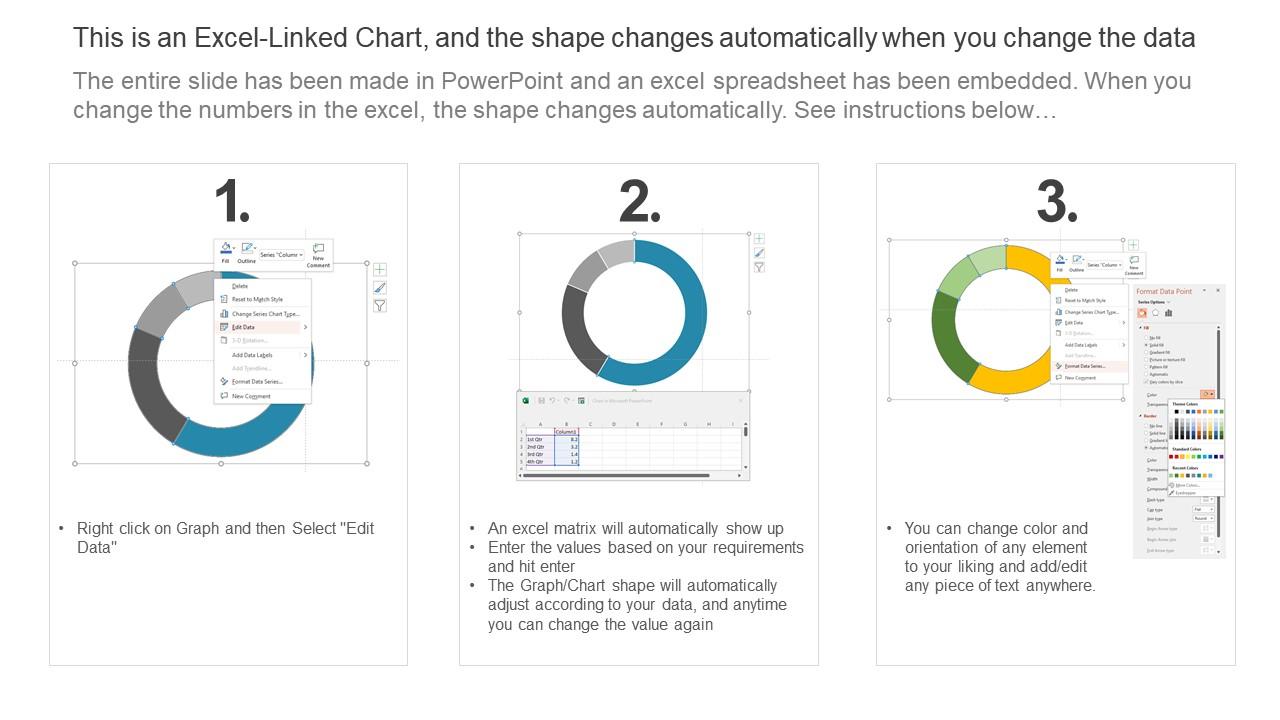
Deploy our Percentage Circle Graphics For Revenue Cycle Profitability Analysis Infographic Template to present high quality presentations. It is designed in PowerPoint and is available for immediate download in standard and widescreen sizes. Not only this, but this layout is also 100 percent editable, giving you full control over its applications.
People who downloaded this PowerPoint presentation also viewed the following :
Percentage circle graphics for revenue cycle profitability analysis infographic template with all 11 slides:
Use our Percentage Circle Graphics For Revenue Cycle Profitability Analysis Infographic Template to effectively help you save your valuable time. They are readymade to fit into any presentation structure.
-
Commendable slides with attractive designs. Extremely pleased with the fact that they are easy to modify. Great work!


