Forecast Demand Using Historical Sales Data Strategies To Order And Maintain Optimum
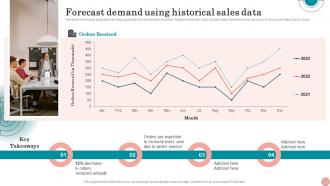
This slide showcases graph that can help organization to forecast the inventory requirement on the basis of sales data of previous financial years. It showcases data of last 3 years.
You must be logged in to download this presentation.
 Impress your
 audience
Editable
of Time
PowerPoint presentation slides
This slide showcases graph that can help organization to forecast the inventory requirement on the basis of sales data of previous financial years. It showcases data of last 3 years. Present the topic in a bit more detail with this Forecast Demand Using Historical Sales Data Strategies To Order And Maintain Optimum. Use it as a tool for discussion and navigation on Sales, Data, Forecast. This template is free to edit as deemed fit for your organization. Therefore download it now.
People who downloaded this PowerPoint presentation also viewed the following :
Forecast Demand Using Historical Sales Data Strategies To Order And Maintain Optimum with all 7 slides:
Use our Forecast Demand Using Historical Sales Data Strategies To Order And Maintain Optimum to effectively help you save your valuable time. They are readymade to fit into any presentation structure.
-
The pricing page of this website is very sorted. I felt no pain while buying the PPTs.
-
It saves your time and decrease your efforts in half.


