Graph Illustrating Big Data Analytics Tools In E Commerce
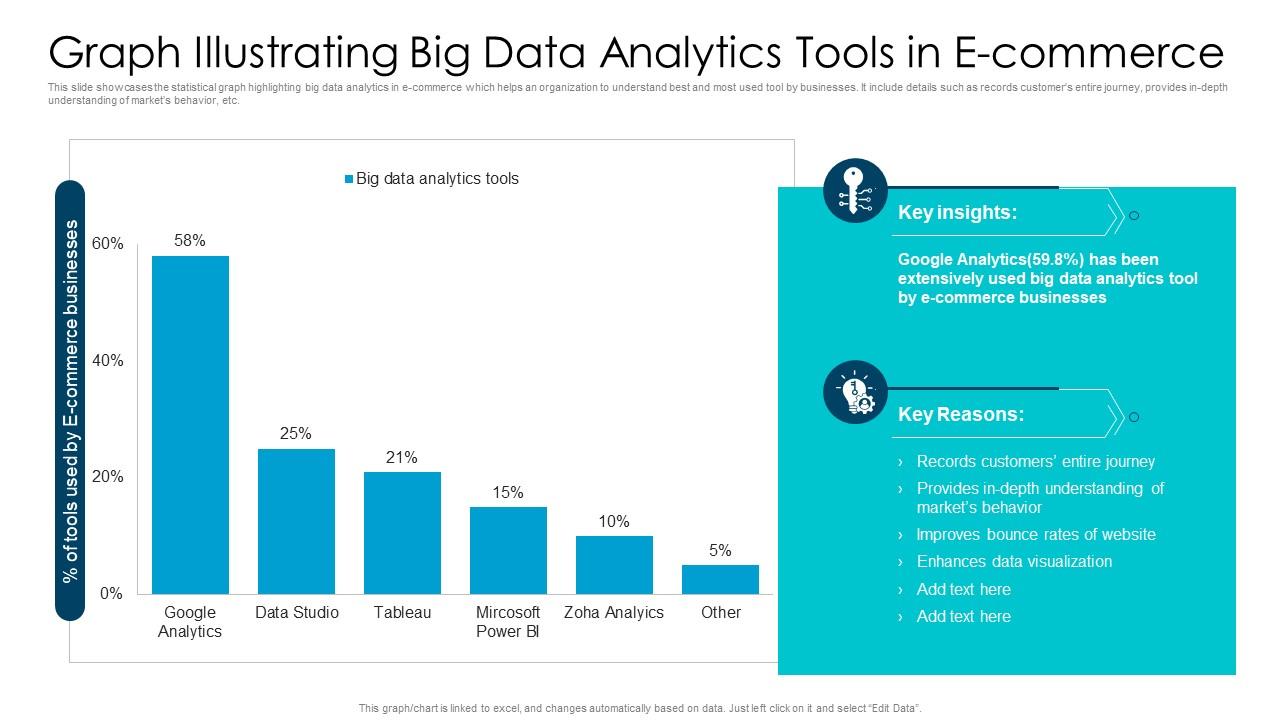
This slide showcases the statistical graph highlighting big data analytics in e-commerce which helps an organization to understand best and most used tool by businesses. It include details such as records customers entire journey, provides in-depth understanding of markets behavior, etc.
This slide showcases the statistical graph highlighting big data analytics in e-commerce which helps an organization to und..
- Google Slides is a new FREE Presentation software from Google.
- All our content is 100% compatible with Google Slides.
- Just download our designs, and upload them to Google Slides and they will work automatically.
- Amaze your audience with SlideTeam and Google Slides.
-
Want Changes to This PPT Slide? Check out our Presentation Design Services
- WideScreen Aspect ratio is becoming a very popular format. When you download this product, the downloaded ZIP will contain this product in both standard and widescreen format.
-

- Some older products that we have may only be in standard format, but they can easily be converted to widescreen.
- To do this, please open the SlideTeam product in Powerpoint, and go to
- Design ( On the top bar) -> Page Setup -> and select "On-screen Show (16:9)” in the drop down for "Slides Sized for".
- The slide or theme will change to widescreen, and all graphics will adjust automatically. You can similarly convert our content to any other desired screen aspect ratio.
Compatible With Google Slides

Get This In WideScreen
You must be logged in to download this presentation.
PowerPoint presentation slides
This slide showcases the statistical graph highlighting big data analytics in e-commerce which helps an organization to understand best and most used tool by businesses. It include details such as records customers entire journey, provides in-depth understanding of markets behavior, etc. Introducing our Graph Illustrating Big Data Analytics Tools In E Commerce set of slides. The topics discussed in these slides are E-Commerce Businesses, Key Insights, Key Reasons. This is an immediately available PowerPoint presentation that can be conveniently customized. Download it and convince your audience.
People who downloaded this PowerPoint presentation also viewed the following :
Graph Illustrating Big Data Analytics Tools In E Commerce with all 11 slides:
Use our Graph Illustrating Big Data Analytics Tools In E Commerce to effectively help you save your valuable time. They are readymade to fit into any presentation structure.
-
“Ample and amazing variety of templates available, really helpful for making professional PPT for day to day workings.”
-
Definitely recommend SlideTeam to all who need help with PowerPoint presentations. Their design team can create anything you need.


