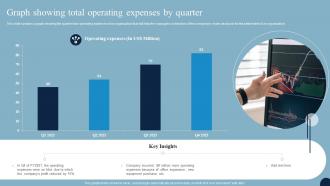
Graph Showing Total Operating Expenses By Quarter
This slide contains a graph showing the quarter wise operating expenses of an organization that will help the managers or directors of the company to make decisions for the betterment of an organization.
You must be logged in to download this presentation.
PowerPoint presentation slides
This slide contains a graph showing the quarter wise operating expenses of an organization that will help the managers or directors of the company to make decisions for the betterment of an organization. Presenting our well structured Graph Showing Total Operating Expenses By Quarter. The topics discussed in this slide are Operating Expenses, Graph Showing, Operating Expenses. This is an instantly available PowerPoint presentation that can be edited conveniently. Download it right away and captivate your audience.
People who downloaded this PowerPoint presentation also viewed the following :
Graph Showing Total Operating Expenses By Quarter with all 7 slides:
Use our Graph Showing Total Operating Expenses By Quarter to effectively help you save your valuable time. They are readymade to fit into any presentation structure.
-
I loved the hassle-free signup process. A few minutes and, I had this giant collection of beautiful designs.
-
Excellent products for quick understanding.


