


Investor Relations Profile Powerpoint Presentation Slides





Try Before you Buy Download Free Sample Product
 Impress Your
 Audience
 100%
100% Editable
 Save Hours
 of Time


Need to present IR PPT presentation? Look no further as our team of expert designers have made content-ready 62 slides Investor Relations Profile Powerpoint Presentation Slides. Our investor profile PowerPoint presentation slides is all that you need. These professionally designed PPT sample presentation file will help you in showcasing numerous topics like company investor update, business model, annual run rate, revenue model, monthly recurring churn, investment deals, production cost, investor scorecard, competitive analysis, market dynamics and budget, value chain, and many more. The best part is that this whole IR PowerPoint sample slides are fully editable. And downloading this PowerPoint sample file will get you exclusive slides like operating excellence, financial highlights, sales performance and revenue dashboards, investment timeline, capital spending graph, distribution growth, adjusted ROCE etc. You can use our IR PPT guide for various topics like angel funding, corporate investment, fundraising, crowdfunding, seed capital, private investment etc. Hurry up! Download Investor Relations Profile Powerpoint Presentation Slides and set yourself on the correct path. Leave a lasting impression on angel investors and target audience. with our professional PowerPoint deck sample file. Force folks to have a gaze with our Investor Relations Profile Powerpoint Presentation Slides. Their eyes get fixed by the brilliance on display.
People who downloaded this PowerPoint presentation also viewed the following :
Content of this Powerpoint Presentation
Slide 1: This slide shows Investor Relations Profile. State Your Company Name and begin.
Slide 2: This slide showcases Agenda. You can put your company agenda.
Slide 3: This slide shows Company Investor Update with these three parameters- Position, Email Address, Name.
Slide 4: This slide presents About Company and these are some the important criterion you can use- Company Founded, No. Of Employees, Funding, Headquarters.
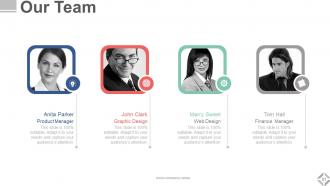
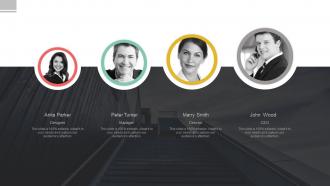
Slide 5: This slide showing about our team. You can put the team names in the space provided.
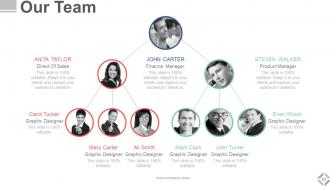
Slide 6: This slide showcases Our Team hierarchy chart. You can use for your company .
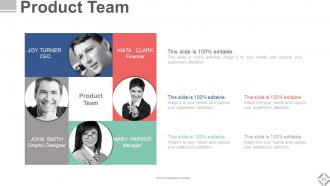
Slide 7: This slide shows product team with that you can add the name of the team members.
Slide 8: This slide presents Growth Team. It includes name of the team members and also you can put pictures.
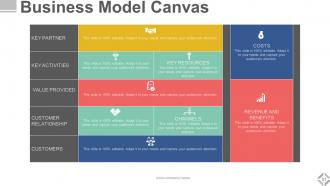
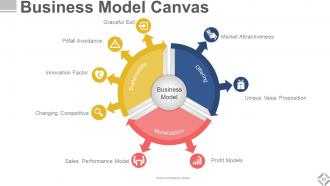
Slide 9: This slide showcases Business Model Canvas. You can add the content as per your requirement.
Slide 10: This slide presents Business Model Canvas and further it is also showing Business Model which further includes- Monetization, Market Attractiveness, Unique Value Proposition, Profit Models, Graceful Exit, Sales Performance Model, Changing Competitive, Innovation Factor, Pitfall Avoidance.
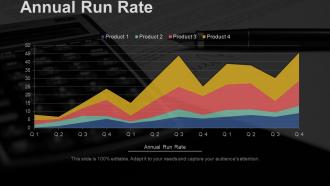
Slide 11: This slide displays Annual Run Rate graph with comparison of the products.
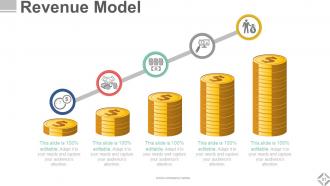
Slide 12: This slide showcases Revenue Model. You can use it as per your requirement.
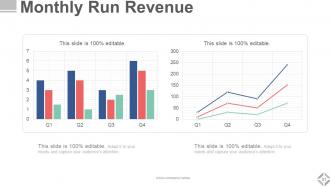
Slide 13: This slide presents Monthly Run Revenue showing with bar chart and line chart.
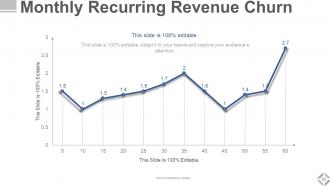
Slide 14: This slide showcases Monthly Recurring Revenue Churn with a line chart.
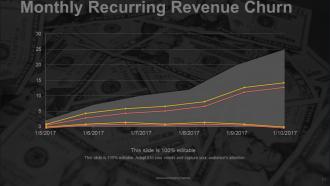
Slide 15: This slide shows Monthly Recurring Revenue Churn with which you can use for different dates and month.
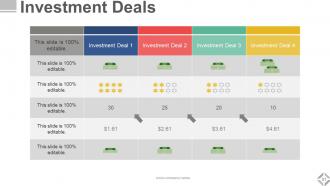
Slide 16: This slide presents Investment Deals table in which you can put the deals.
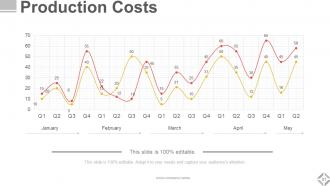
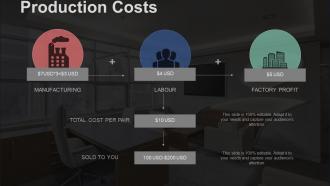
Slide 17: This slide shows Production Costs with the variation of the month and quadrant.
Slide 18: This slide showcases Production Costs with the information or data you can put in order to make usable for your company.
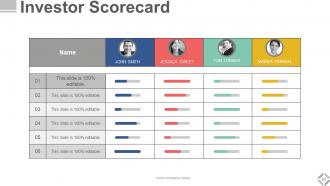
Slide 19: This slide presents Investor Scorecard. You can add your data in the table and use it.
Slide 20: This slide shows Competitive Analysis with which you can analyze and put your company data.
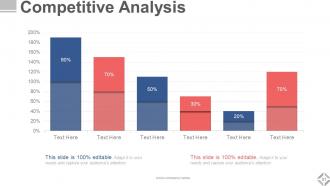
Slide 21: This slide showcases Competitive Analysis with a bar chart. Analyse the competitor with the percentage variation.
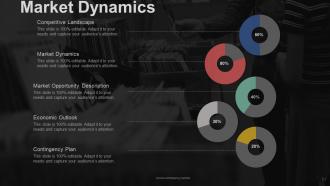
Slide 22: This slide presents Market Dynamics showing different sections that are analyzed- Competitive Landscape, Market Dynamics, Economic Outlook, Market Opportunity Description, Contingency Plan.
Slide 23: This slide showcases Market Dynamics with these important factors- Competitive Landscape, Market Dynamics, Economic Outlook, Market Opportunity Description, Contingency Plan.
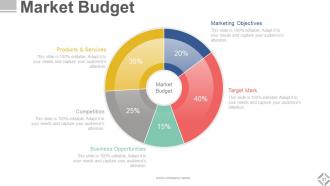
Slide 24: This slide showcases Market Budget, You can use these components which we have listed- Marketing Objectives, Target Mark, Business Opportunities, Competition, Products & Services.
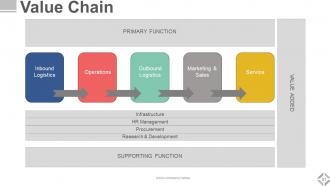
Slide 25: This slide shows Value Chain with these important points you can consider- Infrastructure, HR Management, Research & Development, Procurement, Inbound Logistics, Operations, Outbound Logistics, Marketing & Sales, Service.
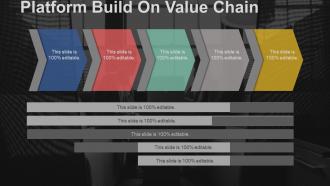
Slide 26: This slide showcases Platform Build On Value Chain. You can add as per you business requirements.
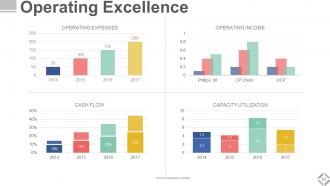
Slide 27: This slide presents Operating Excellence which you can use as per your business requirement- Operating income, Operating expenses, Capacity utilization, Cash flow.
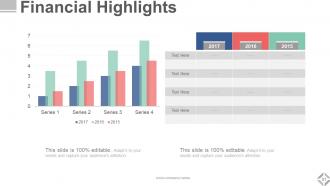
Slide 28: This slide showcases Financial Highlights with a graph and table. You can use it as per your requirement.
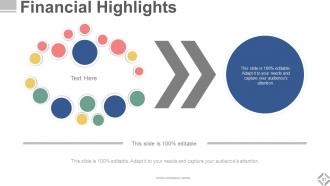
Slide 29: This slide shows Financial Highlights. You can add your data as per your requirement.
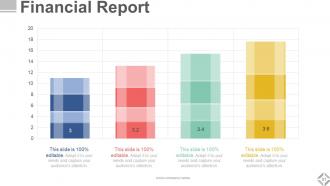
Slide 30: This slide presents Financial Report with a data driven chart.
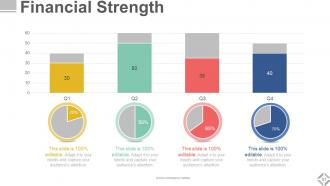
Slide 31: This slide showcases Financial Strength with a graph and pie chart showing the percentage.
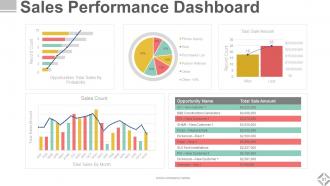
Slide 32: This slide shows Sales Performance Dashboard . You can add the data and use it as per requirement.
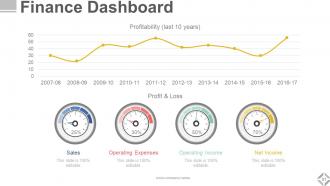
Slide 33: This slide displays Finance Dashboard with graphical representation and meter shaped kpis.
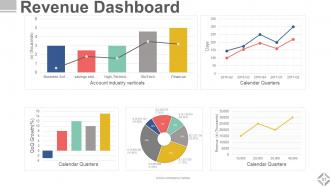
Slide 34: This slide shows Revenue Dashboard. You can use the dashboard as per your requirement.
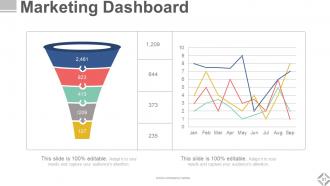
Slide 35: This slide presents Marketing Dashboard with a funnel diagram and graphical representation.
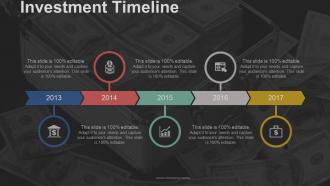
Slide 36: This slide showcases Investment Timeline with yearly variation.
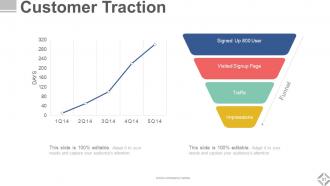
Slide 37: This slide displays Customer Traction. You can add the cutomer data for you website.
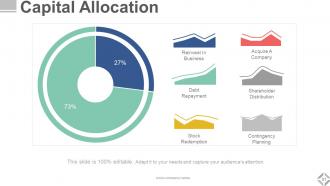
Slide 38: This slide shows Capital allocation with these criterion- Acquire A Company, Shareholder Distribution, Contingency Planning, Stock Redemption, Debt Repayment, Reinvest In Business.
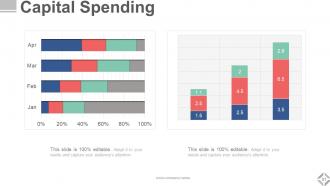
Slide 39: This slide displays Capital Spending. You can add your data and use it accordingly.
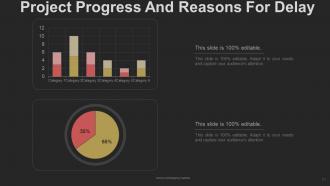
Slide 40: This slide shows Project Progress And Reasons For Delay and use it as per your project requirement.
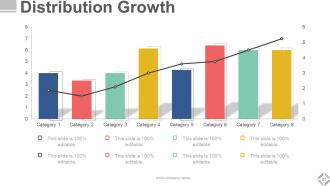
Slide 41: This slide displays Distribution Growth with a graph and shows different category growth chart.
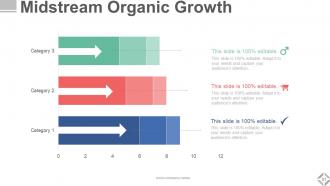
Slide 42: This slide showcases Midstream Organic Growth. You can use it as per your need.
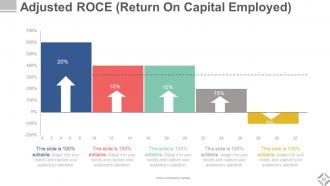
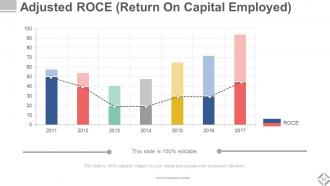
Slide 43: This slide shows Adjusted ROCE (Return On Capital Employed) with which you can analyze the business or company growth.
Slide 44: This slide showcases Adjusted ROCE (Return On Capital Employed). It further includes graph with a bar chart.
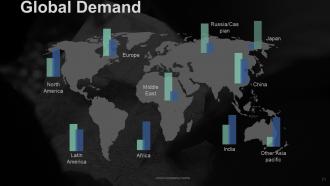
Slide 45: This slide presents Global Demand with these pointed countries- Europe, North America, Russia/Caspian, Japan, Other Asia pacific, India, Africa, Middle East, Latin America, China.
Slide 46: This slide is showing the Diversified Global Portfolio which further representing the global users.
Slide 47: This slide is titled Additional Slides.
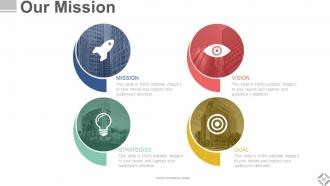
Slide 48: This slide represents Our Mission. State your mission, goals etc.
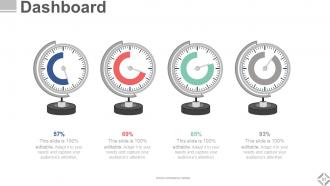
Slide 49: This is a Dashboard slide to show- Strategic System, Success, Goal Process, Sales Review, Communication Study.
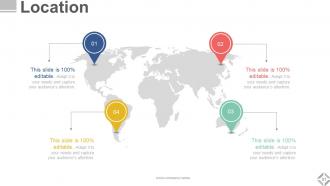
Slide 50: This is a Location slide to show global growth, presence etc. on world map.
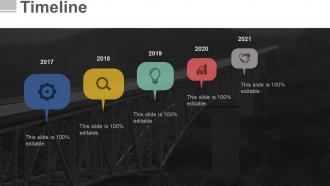
Slide 51: This is a Timelines slide to show- Plan, Budget, Schedule, Review.
Slide 52: This is a Target slide. State your targets here.
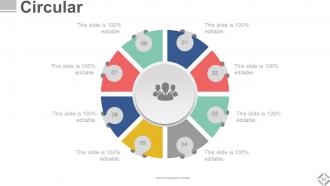
Slide 53: This is a Circular slide to show information, specification etc.
Slide 54: This is a Venn diagram image slide to show information, specifications etc.
Slide 55: This slide shows a Mind map for representing entities.
Slide 56: This is a matrix slide. Put relevant comparing data here.
Slide 57: This is a hierarchy diagram . You can use it for your organisation chart.
Slide 58: This is a Bulb or Idea slide to state a new idea or highlight specifications/information etc.
Slide 59: This slide shows a Magnifying glass with text boxes.
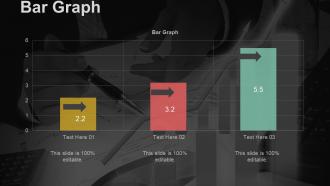
Slide 60: This slide presents a Bar graph in arrow form with text boxes.
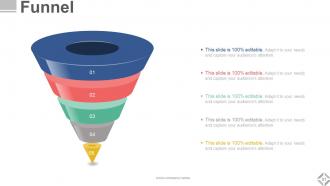
Slide 61: This is a Funnel slide. Showcase the funnel aspect of your team, company, product etc.
Slide 62: This is a Thank You slide with Address# street number, city, state, Contact Number, Email Address.
Investor Relations Profile Powerpoint Presentation Slides with all 60 slides:
Our Investor Relations Profile Powerpoint Presentation Slides will get you into your element. Your thoughts will be in their comfort zone.





FAQs for Investor Relations Profile
Look, it's really about three things: talk to them regularly, be transparent, and keep your messaging tight. Don't overthink it - most companies make this way harder than it needs to be. Set up your earnings calls, quarterly reports, all that standard stuff, but focus on the metrics your investors actually care about. Be available through different channels too. Website, calls, meetings, roadshows when needed. Oh and here's the big one - don't wait for problems to communicate. Map out when you'll update them throughout the year and actually stick to it. Being proactive saves you so much headache later.
Honestly, tech can totally transform how you handle investor relations. Start with automated portals - shareholders love having 24/7 access to reports and data without bugging you constantly. Virtual earnings calls are a game changer too, way cheaper than flying everyone around (plus investors actually show up more). CRM systems help you remember who prefers what kind of communication. Nobody wants generic mass emails anymore. Oh, and social media monitoring catches problems before they blow up. Don't go crazy trying every tool though - pick maybe 2 or 3 that fix your actual headaches first.
Dude, storytelling is everything in these investor pitches. Don't just dump your data on them - weave it into an actual narrative that shows your journey and where you're headed. Like, imagine explaining to someone why your company is going to blow up, but make it flow naturally. Your financial numbers and market opportunity should all build toward that final ask. Honestly, half the battle is just getting your story straight before you even think about making slides. People remember stories way better than spreadsheets anyway.
Track the obvious stuff first - trading volume, analyst coverage, how your valuation stacks up against competitors. But honestly? The relationship side matters way more than people think. Better questions on earnings calls, investors actually picking up when you call, more meeting requests rolling in. Watch how fast your stock bounces back from selloffs compared to peers - that's telling. Also track if institutions bump up positions after roadshows (huge win). Oh and set up some basic monthly dashboard so you're not scrambling to find this stuff later.
Get ahead of it - don't wait for them to start asking questions. Just be straight up about what you know and what you're still figuring out. Honestly, investors appreciate when you don't pretend to have everything sorted immediately. Make sure your whole team's on the same page before anyone talks to outsiders though. Facts only, no guessing. Set up regular check-ins so they know when updates are coming. Oh, and draft up some kind of crisis communication plan now while things are calm - you'll thank yourself later.
Honestly, the SEC runs your whole IR show whether you like it or not. They decide when you talk to investors and exactly how you do it. Your calendar gets built around earnings, annual reports, all that mandatory stuff. Plus selective disclosure rules are such a pain - one wrong move and you're in trouble. But here's the thing: those required touchpoints actually work in your favor since you're guaranteed regular contact with investors. My advice? Map out all your compliance deadlines first, then squeeze in the relationship-building stuff around those dates. Way easier than fighting the system.
So here's what works - LinkedIn's your best bet for quarterly results and reaching institutional investors. Twitter's solid for quick market updates and answering investor questions. Real-time sharing beats traditional channels every time since it's way faster. Honestly, going live during earnings calls is pretty smart - I've watched companies crush it with that approach. Just stay consistent with updates about performance. Investors eat that stuff up. Oh, and don't forget SEC disclosure rules (boring but necessary). Keep everything factual and clear. The transparency thing really pays off in the long run.
Honestly, start with the obvious stuff - stock price and trading volume. But here's what most people miss: check how many analysts are changing their ratings and really listen to the vibe during earnings calls. Are people asking tough questions? Social media's actually huge too - investors complain on Twitter constantly lol. Track downloads of your investor presentations and see who's hitting your IR pages. The best intel comes from those one-on-one meetings though. Just keep a simple monthly log of sentiment patterns. Trust me, you'll catch shifts way earlier than your competitors.
Look, shareholders hate when you dodge questions - they'll see right through it. Hit the big issue head-on first, then show them your actual plan with real dates and numbers they can track. Skip the boring spreadsheets and use charts that actually show where you're headed. Being upfront about problems AND realistic fixes is what matters. Oh, and definitely save time at the end for questions. Some people will want to chat separately about the messier stuff anyway. Trust me, preparation with solid data beats smooth talking every time.
Look, credibility's your biggest hurdle - investors see tons of pitches and you don't have the track record yet. Most founders honestly suck at the sales side when it comes to financials (myself included back in the day). You're juggling complex valuations, legal docs you probably don't get, and different investor expectations with zero resources. Competition's fierce too. But here's the thing - find one solid advocate who truly believes in what you're building. They'll open doors and guide you through the mess way better than trying to figure it all out solo.
Dude, give yourself at least 2-3 weeks to get ready. First thing - gather all your financial numbers and metrics. Then drill your executives on Q&A because analysts will definitely ask the stuff you're dreading. Honestly, the practice rounds are what saved us last time. Build a solid briefing book with competitor data and market updates. Don't forget backup slides for random questions that come out of nowhere. Oh, and have talking points for both wins AND the messy stuff your CEO might get hammered on. Trust me, you can't over-prep for these things.
PowerPoint or Keynote are obvious starting points, but honestly? Canva saves my life for making stuff that doesn't look like everyone else's boring decks. Adobe Creative Suite works too if you're fancy. For charts and data stuff, Tableau makes everything look super clean - though Excel's gotten way better lately. Investors eat that visual trend stuff up. Unsplash is clutch for stock photos that don't make you cringe. And if you're presenting over Zoom, get a remote app so you're not stuck clicking at your laptop like an amateur. Start simple though. Better story beats flashy animations every time.
Dude, this is huge - what works in Silicon Valley will absolutely flop in Tokyo. Americans want you to cut straight to the ROI and bottom line. Europeans? They love diving deep into analysis and long-term strategy. Asian investors often want to build a relationship first before you even mention numbers. I bombed a presentation in Seoul once because I jumped straight into financials without the proper introductions - awkward. Even small stuff matters, like how you make eye contact or handle tough questions. Don't just translate your pitch deck. You've got to completely rethink your approach for each culture. Research their business norms first or you'll look like a total amateur.
Dude, digital stuff has totally flipped investor relations on its head. COVID basically forced everyone into virtual meetings and webcasts overnight - wild how fast that happened. Now you've got AI analyzing investor moods and personalizing outreach automatically. ESG reporting? Yeah, that's not optional anymore - big investors want it upfront. Static PDFs are dead; people expect mobile-friendly, interactive reports. The whole game is about being transparent and accessible now. Honestly, start by looking at your current digital setup and figure out where you can make info more real-time and engaging for investors.
Yeah, good investor relations definitely helps your reputation. Happy investors become your biggest cheerleaders - they're usually connected to tons of other business people and will talk you up at every opportunity. When you're transparent and keep everyone updated (even about the rough patches), it shows you're trustworthy. That reputation spreads beyond just the investment world too. Customers and potential employees pay attention to how well-managed you seem. I've seen companies land great talent just because they had solid IR practices. The trick is staying consistent with your updates and not sugarcoating things when stuff goes sideways.
-
Content of slide is easy to understand and edit.
-
Good research work and creative work done on every template.
-
Great