Level of automation companys production forecasting
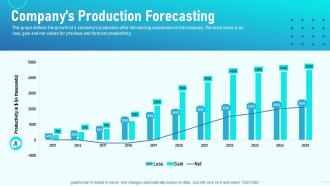
This graph defines the growth of a companys production after introducing automation in the company. The main focus is on loss, gain and net values for previous and forecast productivity.
You must be logged in to download this presentation.
PowerPoint presentation slides
This graph defines the growth of a companys production after introducing automation in the company. The main focus is on loss, gain and net values for previous and forecast productivity. Present the topic in a bit more detail with this Level Of Automation Companys Production Forecasting. Use it as a tool for discussion and navigation on Productivity Dollar, Thousands, Loss, Net, Gain. This template is free to edit as deemed fit for your organization. Therefore download it now.
People who downloaded this PowerPoint presentation also viewed the following :
Level of automation companys production forecasting with all 7 slides:
Use our Level Of Automation Companys Production Forecasting to effectively help you save your valuable time. They are readymade to fit into any presentation structure.
-
Much better than the original! Thanks for the quick turnaround.
-
Excellent work done on template design and graphics.


