Market Analysis Of Information Technology Financial Dashboard To Track Organization Expenses
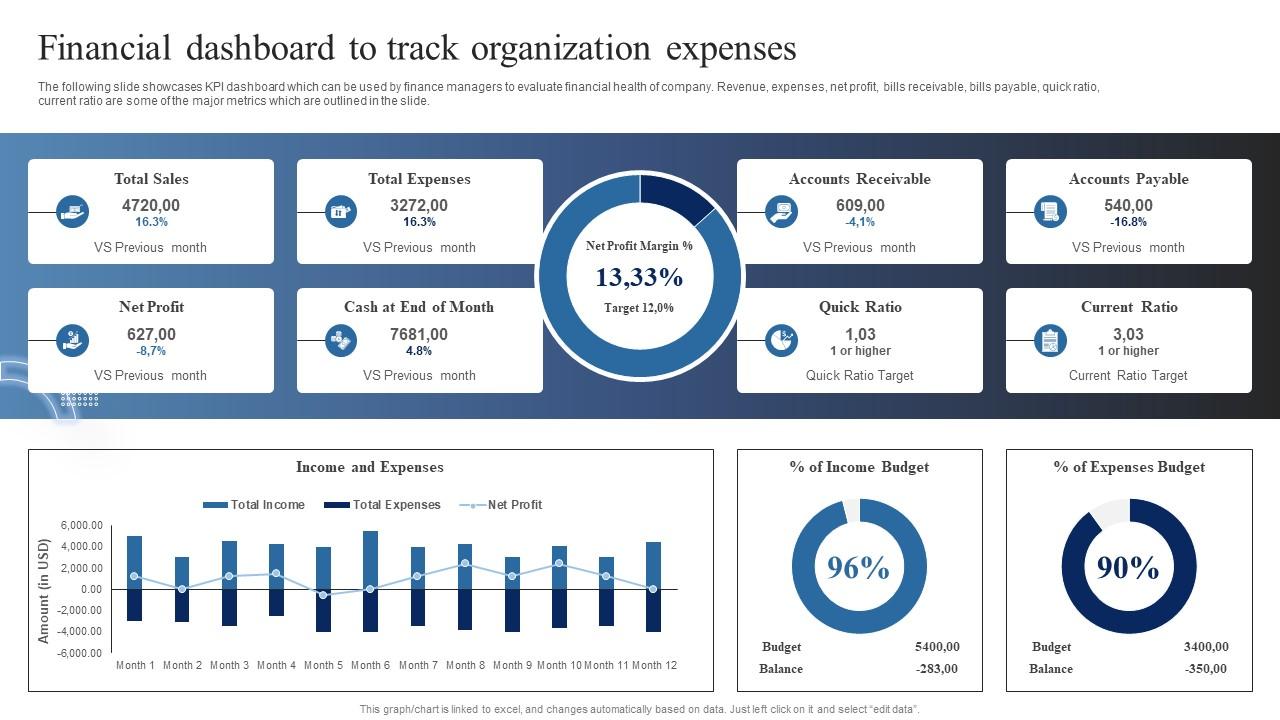
The following slide showcases KPI dashboard which can be used by finance managers to evaluate financial health of company. Revenue, expenses, net profit, bills receivable, bills payable, quick ratio, current ratio are some of the major metrics which are outlined in the slide.
The following slide showcases KPI dashboard which can be used by finance managers to evaluate financial health of company. ..
- Google Slides is a new FREE Presentation software from Google.
- All our content is 100% compatible with Google Slides.
- Just download our designs, and upload them to Google Slides and they will work automatically.
- Amaze your audience with SlideTeam and Google Slides.
-
Want Changes to This PPT Slide? Check out our Presentation Design Services
- WideScreen Aspect ratio is becoming a very popular format. When you download this product, the downloaded ZIP will contain this product in both standard and widescreen format.
-

- Some older products that we have may only be in standard format, but they can easily be converted to widescreen.
- To do this, please open the SlideTeam product in Powerpoint, and go to
- Design ( On the top bar) -> Page Setup -> and select "On-screen Show (16:9)” in the drop down for "Slides Sized for".
- The slide or theme will change to widescreen, and all graphics will adjust automatically. You can similarly convert our content to any other desired screen aspect ratio.
Compatible With Google Slides

Get This In WideScreen
You must be logged in to download this presentation.
PowerPoint presentation slides
The following slide showcases KPI dashboard which can be used by finance managers to evaluate financial health of company. Revenue, expenses, net profit, bills receivable, bills payable, quick ratio, current ratio are some of the major metrics which are outlined in the slide. Present the topic in a bit more detail with this Market Analysis Of Information Technology Financial Dashboard To Track Organization Expenses. Use it as a tool for discussion and navigation on Financial Dashboard, Track Organization Expenses, Expenses Budget. This template is free to edit as deemed fit for your organization. Therefore download it now.
People who downloaded this PowerPoint presentation also viewed the following :
Market Analysis Of Information Technology Financial Dashboard To Track Organization Expenses with all 7 slides:
Use our Market Analysis Of Information Technology Financial Dashboard To Track Organization Expenses to effectively help you save your valuable time. They are readymade to fit into any presentation structure.
-
I have just started downloading templates for my presentations and I must say this is a great design. It helped accelerate my presentation design process and made it more visually appealing.
-
Professionally designed slides with color coordinated themes and icons. Perfect for enhancing the style of the presentations.


