

Marketing Analytics Effectiveness How To Measure Your Marketing Success Complete Deck





Try Before you Buy Download Free Sample Product
 Impress Your
 Audience
 100%
100% Editable
 Save Hours
 of Time


Marketing analytics involves analyzing data to measure the effectiveness and success of marketing activities. Check out our Marketing Analytics Effectiveness How to Measure Your Marketing Success template. It is professionally curated to help brands gain a deep understanding of their consumers. Our Data Analytics ppt offers a brief overview of marketing analytics, including its benefits, elements, types, and top challenges that companies face. It also covers various channels for implementing marketing analytics, such as website analytics, SEO analytics, email analytics, and more. Further, Our Landing page PPT can help companies achieve a higher return on investment by optimizing their marketing objectives. Additionally, the module explains the key performance indicators KPIs that need to be monitored during marketing analytics and the impact and cost effectiveness of each type. Download this 100 percentage editable presentation to access our highly researched and expertly crafted product.
People who downloaded this PowerPoint presentation also viewed the following :
Content of this Powerpoint Presentation
Slide 1: This slide introduces Marketing Analytics Effectiveness - How to Measure Your Marketing Success. Commence by stating Your Company Name.
Slide 2: This slide depicts the Agenda of the presentation.
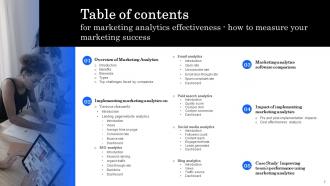
Slide 3: This slide incorporates the Table of contents.
Slide 4: This slide highlights the Title for the Topics to be covered further.
Slide 5: This slide reveals the Introduction to marketing analytics for strategic decision making.
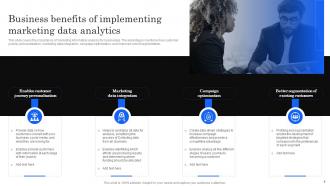
Slide 6: This slide exhibits the Business benefits of implementing marketing data analytics.
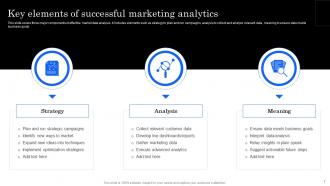
Slide 7: This slide states the Key elements of successful marketing analytics.
Slide 8: This slide highlights the Major types of marketing analytics models.
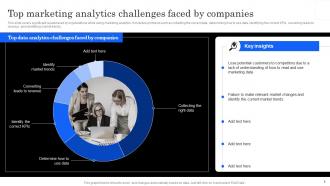
Slide 9: This slide presents the Top marketing analytics challenges faced by companies.
Slide 10: This slide mentions the Heading for the Contents to be discussed further.
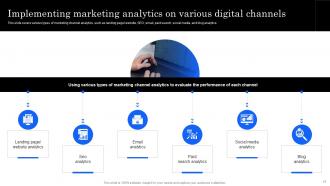
Slide 11: This slide deals with Implementing marketing analytics on various digital channels.
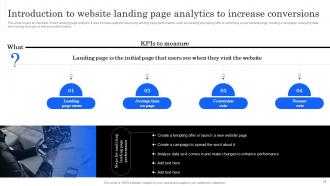
Slide 12: This slide indicates the Introduction to website landing page analytics to increase conversions.
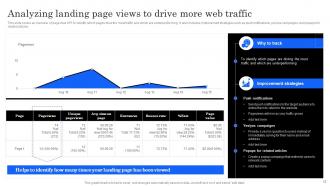
Slide 13: This slide focuses on Analyzing landing page views to drive more web traffic.
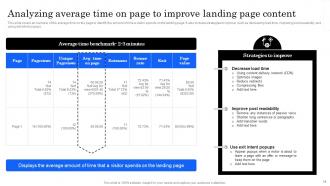
Slide 14: This slide emphasizes on Analyzing average time on page to improve landing page content.
Slide 15: This slide talks about Analyzing website landing page conversion rates to improve user experience.
Slide 16: This slide covers a brief overview of the bounce rate.
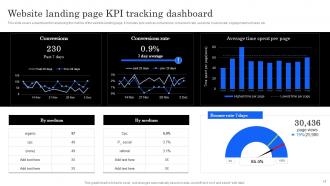
Slide 17: This slide reveals the Website landing page KPI tracking dashboard.
Slide 18: This slide depicts the Title for the Ideas to be covered in the following template.
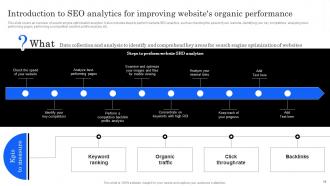
Slide 19: This slide presents the Introduction to SEO analytics for improving website's organic performance.
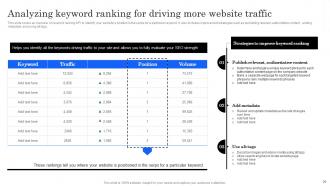
Slide 20: This slide displays Analyzing keyword ranking for driving more website traffic.
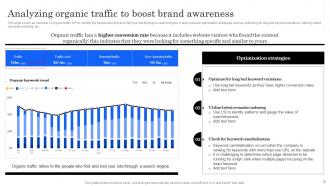
Slide 21: This slide shows an overview of organic traffic KPI to identify the people visiting your site through a search engine.
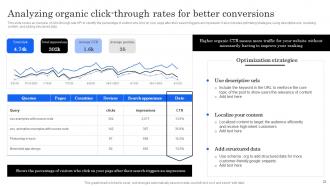
Slide 22: This slide focuses on Analyzing organic click-through rates for better conversions.
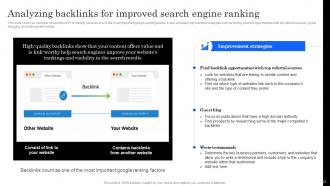
Slide 23: This slide deals with Analyzing backlinks for improved search engine ranking.
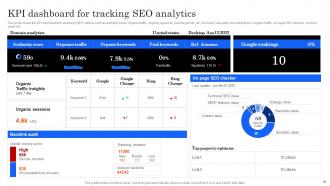
Slide 24: This slide illustrates the KPI dashboard for tracking SEO analytics.
Slide 25: This slide elucidates the Heading for the Ideas to be discussed in the next template.
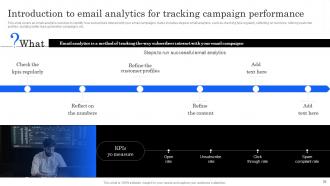
Slide 26: This slide depicts the Introduction to email analytics for tracking campaign performance.
Slide 27: This slide emphasizes on Analyzing open email rate to improve user engagement.
Slide 28: This slide deals with Analyzing email click-through rate for better campaign performance.
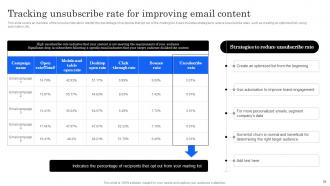
Slide 29: This slide highlights Tracking unsubscribe rate for improving email content.
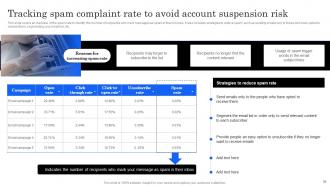
Slide 30: This slide mentions about Tracking spam complaint rate to avoid account suspension risk.
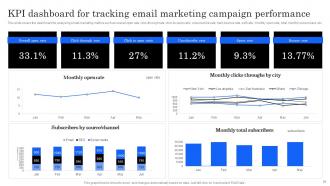
Slide 31: This slide represents the KPI dashboard for tracking email marketing campaign performance.
Slide 32: This slide includes the Title for the Contents to be covered in the following template.
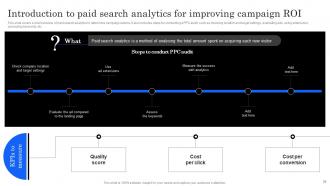
Slide 33: This slide displays the Introduction to paid search analytics for improving campaign ROI.
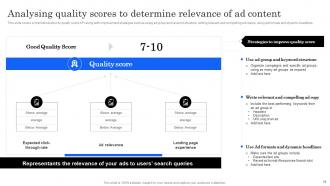
Slide 34: This slide covers a brief introduction to quality score KPI along with improvement strategies.
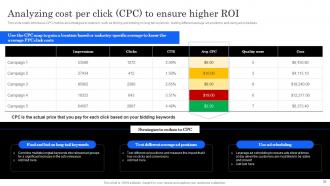
Slide 35: This slide briefly introduces CPC metrics and strategies to reduce it.
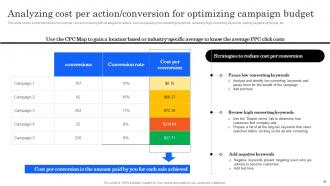
Slide 36: This slide indicates Analyzing cost per action/conversion for optimizing campaign budget.
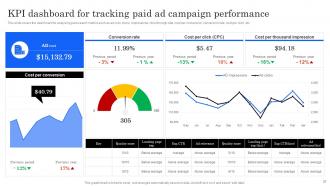
Slide 37: This slide elucidates the KPI dashboard for tracking paid ad campaign performance.
Slide 38: This slide includes the Heading for the Topics to be discussed in the forth-coming template.
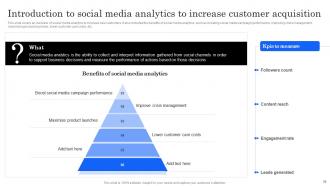
Slide 39: This slide shows the Introduction to social media analytics to increase customer acquisition.
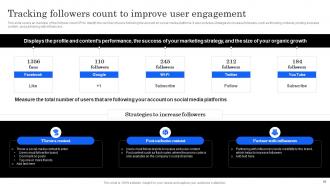
Slide 40: This slide deals with Tracking followers count to improve user engagement.
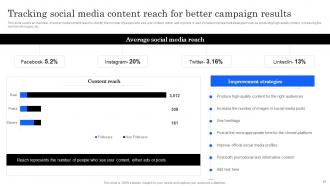
Slide 41: This slide emphasizes on Tracking social media content reach for better campaign results.
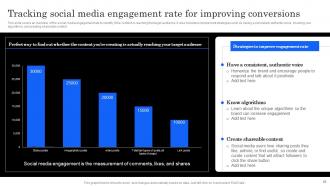
Slide 42: This slide focuses on Tracking social media engagement rate for improving conversions.
Slide 43: This slide covers an overview of social media leads for increasing customer conversion rates.
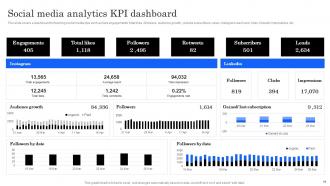
Slide 44: This slide elucidates the Social media analytics KPI dashboard.
Slide 45: This slide displays the Title for the Topics to be covered in the next template.
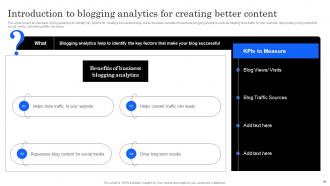
Slide 46: This slide presents the Introduction to blogging analytics for creating better content.
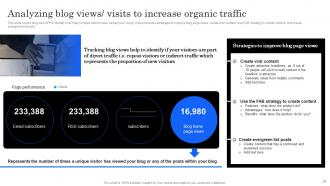
Slide 47: This slide covers blog view KPI to identify how many unique visitors have viewed your blogs.
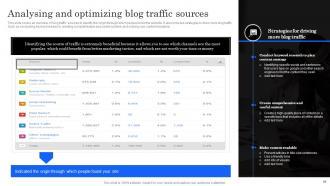
Slide 48: This slide mentions about Analysing and optimizing blog traffic sources.
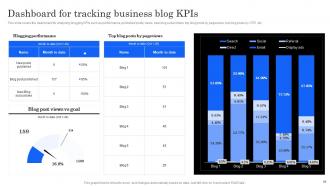
Slide 49: This slide illustrates the Dashboard for tracking business blog KPIs.
Slide 50: This slide depicts the Heading for the Contents to be discussed in the upcoming template.
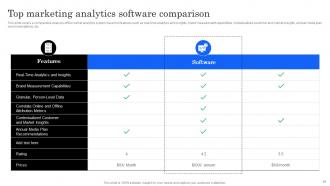
Slide 51: This slide states the Top marketing analytics software comparison.
Slide 52: This slide talks about the Pre and post- market analytics implementation impacts.
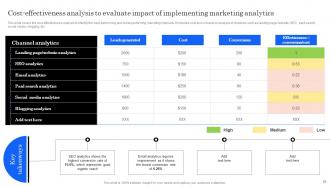
Slide 53: This slide indicates the Cost-effectiveness analysis to evaluate impact of implementing marketing analytics.
Slide 54: This slide covers a case study of a company that improved various business teams’ performance by utilizing marketing analytics.
Slide 55: This is the Icons slide containing all the Icons used in the plan.
Slide 56: This slide is used for representing some Additional information.
Slide 57: This slide showcases the company's mission, vision, and goal.
Slide 58: This is the About us slide. state your organization-related information here.
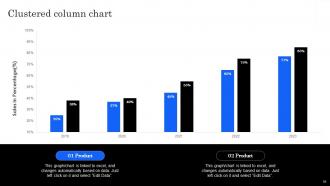
Slide 59: This slide elucidates the Clustered column chart.
Slide 60: This is Our team slide. state your team-related information here.
Slide 61: This slide represents the Roadmap of the firm.
Slide 62: This is Our goal slide. State your company's goals here.
Slide 63: This is the Idea generation slide for encouraging fresh ideas.
Slide 64: This slide showcases information related to the Financial topic.
Slide 65: This slide contains the Post it notes for reminders and deadlines.
Slide 66: This is the Thank you slide for acknowledgement.
Marketing Analytics Effectiveness How To Measure Your Marketing Success Complete Deck with all 71 slides:
Use our Marketing Analytics Effectiveness How To Measure Your Marketing Success Complete Deck to effectively help you save your valuable time. They are readymade to fit into any presentation structure.


























FAQs for Marketing Analytics Effectiveness How To Measure Your Marketing
Marketing analytics key metrics include website traffic, conversion rates, customer acquisition cost, click-through rates, and return on ad spend. These measurements streamline performance evaluation by identifying successful channels, optimizing resource allocation, and enhancing customer experiences, with many financial services firms finding that focused analysis delivers significant cost reductions and increased lead generation.
Customer segmentation data enhances marketing strategies by enabling personalized campaigns, targeted messaging, and optimized resource allocation. While improved customer experiences drive loyalty, it also requires careful data privacy considerations and ongoing analysis. These technologies streamline outreach by identifying key demographics, behavioral patterns, and purchase histories, ultimately delivering increased ROI and competitive advantage with many retailers finding that focused campaigns yield significantly higher conversion rates.
Predictive analytics plays a crucial role in forecasting marketing trends and consumer behavior by leveraging historical data, statistical modeling, and machine learning. These technologies streamline campaign optimization by identifying patterns, anticipating customer needs, and personalizing experiences, with many retailers finding that targeted promotions significantly increase conversion rates. Ultimately delivering enhanced ROI and a competitive advantage in an increasingly data-driven landscape.
A/B testing integrates into marketing analytics by systematically comparing two versions of a marketing asset—like email subject lines or landing pages—to determine which performs better, ultimately revealing data-driven insights for optimization. While requiring careful setup and analysis, it also enables marketers to enhance conversion rates, personalize customer experiences, and streamline resource allocation, with many financial services institutions finding a 10-15% lift in qualified leads.
Marketing analytics relies on tools like Google Analytics, HubSpot, Tableau, and SEMrush, alongside specialized platforms for social listening and A/B testing. These technologies streamline data collection by automating reporting, identifying key performance indicators, and visualizing trends, ultimately delivering actionable insights and enhanced return on investment.
Social media analytics contributes to understanding brand perception and audience engagement by tracking mentions, sentiment, and engagement rates across platforms. While providing valuable insights into public opinion, it also necessitates careful interpretation to avoid skewed results from bot activity. These technologies streamline brand monitoring by analyzing conversations, identifying key influencers, and measuring campaign effectiveness, ultimately delivering enhanced customer experiences and a stronger competitive advantage.
Marketing analytics data integrity relies on robust validation, consistent data governance, and secure access controls, alongside regular data audits and cleansing procedures. These technologies streamline data management by automating checks, standardizing formats, and minimizing human error, with many financial services and healthcare institutions finding that proactive monitoring significantly reduces reporting inaccuracies. Ultimately delivering reliable insights and informed decision-making, ensuring campaigns are optimized for maximum return and sustained competitive advantage.
Marketing analytics optimizes digital advertising spend by tracking key performance indicators, including click-through rates, conversion costs, and return on ad spend, while enabling data-driven decisions regarding budget allocation. With many financial services and retail organizations finding that precise targeting and A/B testing significantly enhance campaign performance, ultimately delivering increased ROI and minimized wasted expenditure.
Consumer data collection for marketing presents both challenges and opportunities, encompassing privacy concerns, data security, and transparency requirements. While personalized marketing enhances customer experiences and boosts campaign effectiveness, it also necessitates responsible data handling practices, including obtaining explicit consent and anonymizing sensitive information. With many organizations finding that building trust through ethical data practices delivers significant competitive advantage and fosters long-term customer loyalty, ultimately streamlining resource allocation and enhancing brand reputation.
Marketing analytics enables organizations to personalize customer experiences by leveraging data on behavior, preferences, and demographics through segmentation, targeted messaging, and dynamic content. While data collection is crucial, it also requires robust privacy protocols, with many institutions finding that ethical data handling builds trust. These technologies streamline customer interactions, enhance engagement, and ultimately deliver increased conversion rates and stronger brand loyalty in an increasingly competitive landscape.
Mobile analytics significantly impacts marketing strategies by tracking user behavior, app usage, and campaign performance on smartphones. While providing granular data on customer journeys, it also necessitates robust data privacy measures and compliance. These technologies streamline segmentation, personalization, and retargeting by location, demographics, and in-app actions, ultimately delivering enhanced customer experiences and improved ROI with many retailers finding a 20% increase in conversion rates.
Marketing analytics integration with CRM systems enhances customer understanding by combining behavioral data, purchase history, and campaign interactions. While this delivers personalized experiences, it also requires robust data governance and security protocols. These technologies streamline segmentation, automate lead scoring, and optimize marketing spend, ultimately delivering improved ROI and stronger customer relationships with many organizations finding that a unified view boosts sales efficiency.
Marketing analytics case studies include Netflix’s personalization engine, Amazon’s recommendation systems, and Coca-Cola’s real-time campaign optimization, alongside Procter & Gamble’s targeted advertising. These approaches streamline resource allocation by identifying high-performing channels, enhancing customer experiences, and ultimately delivering significant revenue growth and competitive advantage, with many retailers finding that data-driven insights boost ROI.
Marketing analytics empowers small businesses by tracking key metrics like website traffic, customer acquisition cost, and conversion rates, even with constrained resources. Utilizing free tools such as Google Analytics and social media insights helps organizations understand customer behavior, optimize campaigns, and refine resource allocation. With many finding that focused analysis delivers significant ROI, streamlining efforts ultimately enhances marketing efficiency and drives sustainable growth in an increasingly competitive landscape.
Marketing analytics implementation presents both challenges and opportunities, including data silos, skill gaps, and integrating insights into action. While robust tools help collect data, it also requires skilled analysts to interpret findings and connect them to strategic campaigns. These technologies streamline reporting by automating data aggregation, visualization, and predictive modeling, ultimately delivering improved ROI and competitive advantage with many organizations finding that cross-departmental collaboration is key to success.
-
What an exhaustive collection of templates you guys have there in slideteam. Impressive!!!
-
The templates are the best in class. Very clear and innovative graphics! I am excited to explore and download more presentations.