New Technology Usage Column Chart
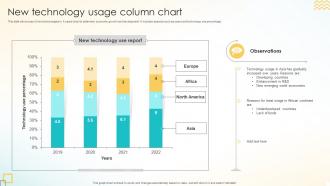
This slide shows use of new technologies in 4 years chart to determine economic growth and development. It Includes aspects such as years and technology use percentage.
You must be logged in to download this presentation.
 Impress your
 audience
Editable
of Time
PowerPoint presentation slides
This slide shows use of new technologies in 4 years chart to determine economic growth and development. It Includes aspects such as years and technology use percentage. Presenting our well-structured New Technology Usage Column Chart. The topics discussed in this slide are New Technology Usage, Column Chart. This is an instantly available PowerPoint presentation that can be edited conveniently. Download it right away and captivate your audience.
People who downloaded this PowerPoint presentation also viewed the following :
New Technology Usage Column Chart with all 7 slides:
Use our New Technology Usage Column Chart to effectively help you save your valuable time. They are readymade to fit into any presentation structure.
-
Thank you for showering me with discounts every time I was reluctant to make the purchase.
-
Editable, diversified, compatible with MS PPT and Google Slides, and on top of that finest graphics!! I mean in the words of the famous Ross Geller, “What more do you want!”


