Non Life Insurance Agent Dashboard With Revenue Chart
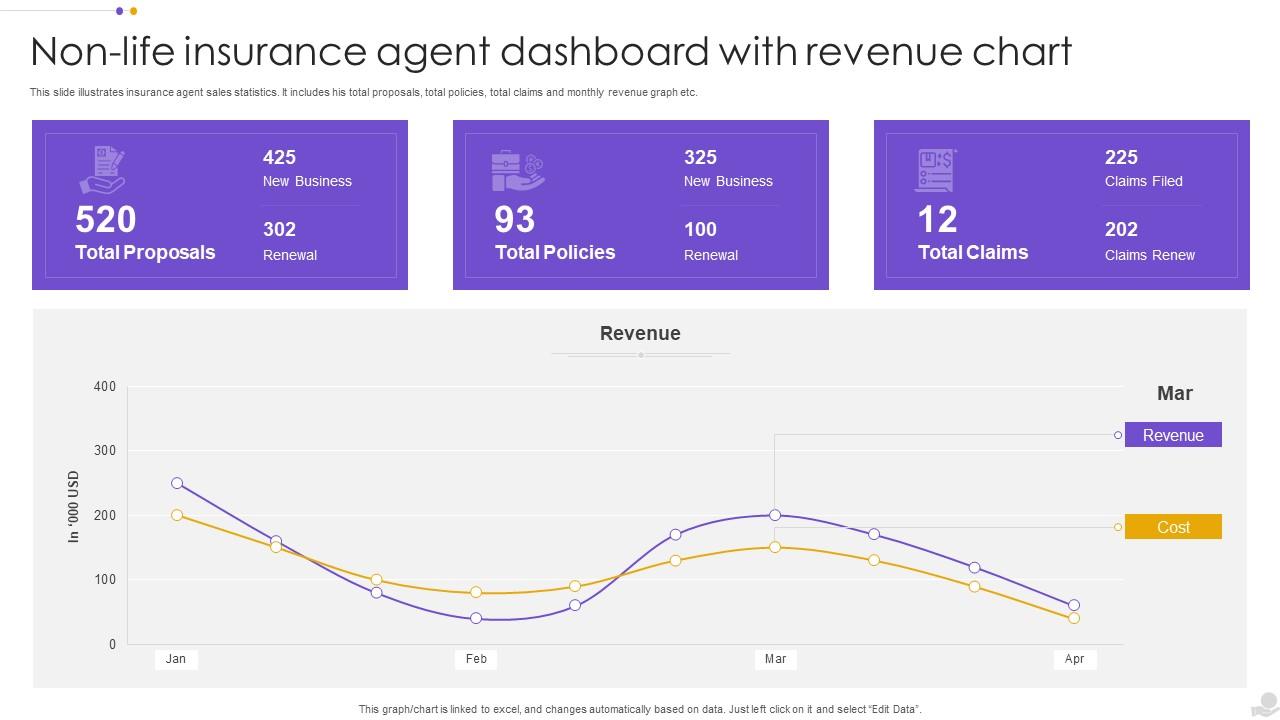
This slide illustrates insurance agent sales statistics. It includes his total proposals, total policies, total claims and monthly revenue graph etc.
This slide illustrates insurance agent sales statistics. It includes his total proposals, total policies, total claims and ..
- Google Slides is a new FREE Presentation software from Google.
- All our content is 100% compatible with Google Slides.
- Just download our designs, and upload them to Google Slides and they will work automatically.
- Amaze your audience with SlideTeam and Google Slides.
-
Want Changes to This PPT Slide? Check out our Presentation Design Services
- WideScreen Aspect ratio is becoming a very popular format. When you download this product, the downloaded ZIP will contain this product in both standard and widescreen format.
-

- Some older products that we have may only be in standard format, but they can easily be converted to widescreen.
- To do this, please open the SlideTeam product in Powerpoint, and go to
- Design ( On the top bar) -> Page Setup -> and select "On-screen Show (16:9)” in the drop down for "Slides Sized for".
- The slide or theme will change to widescreen, and all graphics will adjust automatically. You can similarly convert our content to any other desired screen aspect ratio.
Compatible With Google Slides

Get This In WideScreen
You must be logged in to download this presentation.
PowerPoint presentation slides
This slide illustrates insurance agent sales statistics. It includes his total proposals, total policies, total claims and monthly revenue graph etc. Introducing our Non Life Insurance Agent Dashboard With Revenue Chart set of slides. The topics discussed in these slides are Non Life Insurance, Agent Dashboard, Revenue Chart. This is an immediately available PowerPoint presentation that can be conveniently customized. Download it and convince your audience.
People who downloaded this PowerPoint presentation also viewed the following :
Non Life Insurance Agent Dashboard With Revenue Chart with all 7 slides:
Use our Non Life Insurance Agent Dashboard With Revenue Chart to effectively help you save your valuable time. They are readymade to fit into any presentation structure.
-
I looked at their huge selection of themes and designs. They appeared to be ideal for my profession. I'm sure I'll grab a few of them.
-
I have been using SlideTeam for the past six months. Very happy and satisfied!


