Dashboard PowerPoint Slides, KPi Dashboard PPT Templates
- Sub Categories
-
- 30 60 90 Day Plan
- About Us Company Details
- Action Plan
- Agenda
- Annual Report
- Audit Reports
- Balance Scorecard
- Brand Equity
- Business Case Study
- Business Communication Skills
- Business Plan Development
- Business Problem Solving
- Business Review
- Capital Budgeting
- Career Planning
- Change Management
- Color Palettes
- Communication Process
- Company Location
- Company Vision
- Compare
- Competitive Analysis
- Corporate Governance
- Cost Reduction Strategies
- Custom Business Slides
- Customer Service
- Dashboard
- Data Management
- Decision Making
- Digital Marketing Strategy
- Digital Transformation
- Disaster Management
- Diversity
- Equity Investment
- Financial Analysis
- Financial Services
- Financials
- Growth Hacking Strategy
- Human Resource Management
- Innovation Management
- Interview Process
- Knowledge Management
- Leadership
- Lean Manufacturing
- Legal Law Order
- Management
- Market Segmentation
- Marketing
- Media and Communication
- Meeting Planner
- Mergers and Acquisitions
- Metaverse
- Newspapers
- Operations and Logistics
- Organizational Structure
- Our Goals
- Performance Management
- Pitch Decks
- Pricing Strategies
- Process Management
- Product Development
- Product Launch Ideas
- Product Portfolio
- Project Management
- Purchasing Process
- Quality Assurance
- Quotes and Testimonials
- Real Estate
- Risk Management
- Sales Performance Plan
- Sales Review
- SEO
- Service Offering
- Six Sigma
- Social Media and Network
- Software Development
- Solution Architecture
- Stock Portfolio
- Strategic Management
- Strategic Planning
- Supply Chain Management
- Swimlanes
- System Architecture
- Team Introduction
- Testing and Validation
- Thanks-FAQ
- Time Management
- Timelines Roadmaps
- Value Chain Analysis
- Value Stream Mapping
- Workplace Ethic
-
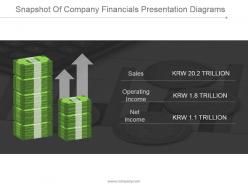 Snapshot of company financials presentation diagrams
Presenting snapshot of company financials presentation diagrams. This is a snapshot of company financials presentation diagrams. This is a two stage process. The stages in this process are sales, operating income, net income.
-
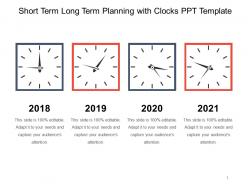 Short term long term planning with clocks ppt template
Presenting short term long term planning with clocks ppt template. This is a short term long term planning with clocks ppt template. This is a four stage process. The stages in this process are short term plan, long term plan, 30 60 90 day plan.
-
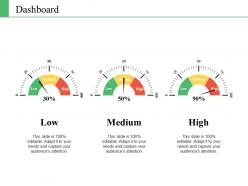 Dashboard Snapshot ppt summary rules
Presenting this set of slides with name - Dashboard Snapshot Ppt Summary Rules. This is a three stage process. The stages in this process are Low, Medium, High, Dashboard, Measurement.
-
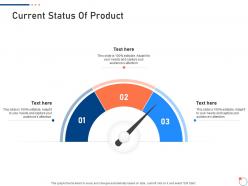 Current status of product investor pitch deck for startup fundraising ppt file skills
Introducing Current Status Of Product Investor Pitch Deck For Startup Fundraising Ppt File Skills to increase your presentation threshold. Encompassed with three stages, this template is a great option to educate and entice your audience. Dispence information on Current Status Of Product, using this template. Grab it now to reap its full benefits.
-
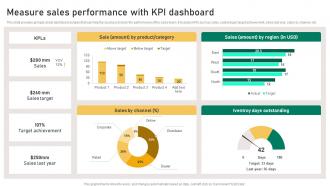 Measure Sales Performance With KPI Dashboard Implementation Guidelines For Sales MKT SS V
This slide provides glimpse about dashboard analysis that can help the business to track the performance of the sales team. It includes KPIs such as sales, sales target, target achievement, sales last year, sales by channel, etc. Deliver an outstanding presentation on the topic using this Measure Sales Performance With KPI Dashboard Implementation Guidelines For Sales MKT SS V. Dispense information and present a thorough explanation of Performance, Sales, Measure using the slides given. This template can be altered and personalized to fit your needs. It is also available for immediate download. So grab it now.
-
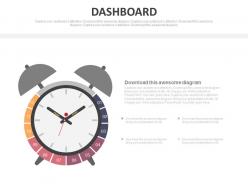 Alarm clock with dashboard for time management powerpoint slides
Presenting alarm clock with dashboard for time management powerpoint slides. This Power Point template slide has been crafted with graphic of alarm clock and dashboard. This PPT slide contains the concept of time management. Use this PPT slide for business and management related presentations.
-
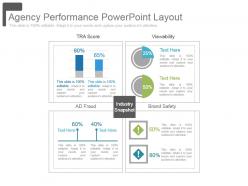 Agency performance powerpoint layout
Presenting agency performance powerpoint layout. This is a agency performance powerpoint layout. This is a four stage process. The stages in this process are tra score, ad fraud, viewability, brand safety, industry snapshot.
-
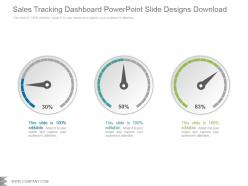 Sales tracking dashboard powerpoint slide designs download
Presenting sales tracking dashboard powerpoint slide designs download. Presenting sales tracking dashboard powerpoint slide designs download. Presenting sales tracking dashboard powerpoint slide designs download. Presenting sales tracking dashboard powerpoint slide designs download. This is a sales tracking dashboard powerpoint slide designs download. This is a three stage process. The stages in this process are business, dashboard, strategy, marketing, management, presentation.
-
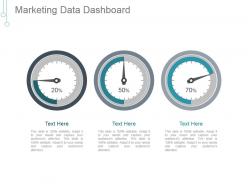 Marketing data dashboard snapshot ppt background graphics
Presenting marketing data dashboard snapshot ppt background graphics. This is a marketing data dashboard ppt background graphics. This is a three stage process. The stages in this process are business, marketing, management, dashboard, finance.
-
 Sales analysis dashboard snapshot ppt design templates
Presenting sales analysis dashboard Snapshot ppt design templates. This is a sales analysis dashboard ppt design templates. This is a three stage process. The stages in this process are analysis, dashboard, business, marketing, strategy, success.
-
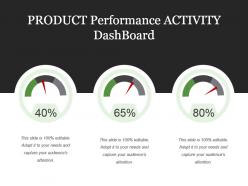 Product performance activity dashboard powerpoint slide influencers
Presenting product performance activity dashboard powerpoint slide influencers. This is a product performance activity dashboard powerpoint slide influencers. This is a three stage process. The stages in this process are business, finance, dashboard, percentage, finance.
-
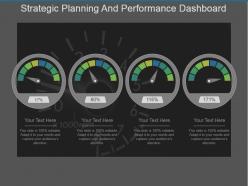 Strategic planning and performance dashboard snapshot ppt slide design
Presenting strategic planning and performance dashboard ppt slide design. This is a strategic planning and performance dashboard ppt slide design. This is a four stage process. The stages in this process are technology, business, marketing, success, communication.
-
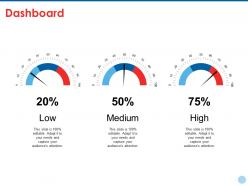 Dashboard snapshot ppt styles maker
Presenting this set of slides with name - Dashboard Snapshot Ppt Styles Maker. This is a three stage process. The stages in this process are Business, Marketing, Dashboard, Low, Medium, High.
-
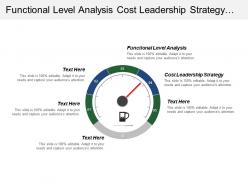 Functional level analysis cost leadership strategy renewal strategy
Presenting this set of slides with name - Functional Level Analysis Cost Leadership Strategy Renewal Strategy. This is an editable five stages graphic that deals with topics like Functional Level Analysis, Cost Leadership Strategy, Renewal Strategy to help convey your message better graphically. This product is a premium product available for immediate download, and is 100 percent editable in Powerpoint. Download this now and use it in your presentations to impress your audience.
-
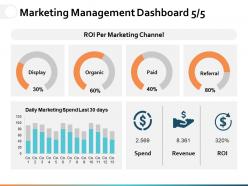 Marketing management dashboard snapshot ppt powerpoint presentation file graphics pictures
Presenting this set of slides with name - Marketing Management Dashboard Snapshot Ppt Powerpoint Presentation File Graphics Pictures. This is a three stage process. The stages in this process are Percentage, Product, Business, Management, Marketing.
-
 Man available 24 hours icon
Presenting this set of slides with name Man Available 24 Hours Icon. This is a three stage process. The stages in this process are Man Available 24 Hours Icon. This is a completely editable PowerPoint presentation and is available for immediate download. Download now and impress your audience.
-
 Man running with hours icon
Presenting this set of slides with name Man Running With Hours Icon. This is a one stage process. The stage in this process is Man Running With Hours Icon. This is a completely editable PowerPoint presentation and is available for immediate download. Download now and impress your audience.
-
 Customer engagement optimization social media engagement performance r779
This slide provides information regarding the dashboard that contains various performance indicators that are measured to determine engagement performance. Presenting this set of slides with name Customer Engagement Optimization Social Media Engagement Performance R779. This is a two stage process. The stages in this process are Social Media Engagement Performance. This is a completely editable PowerPoint presentation and is available for immediate download. Download now and impress your audience.
-
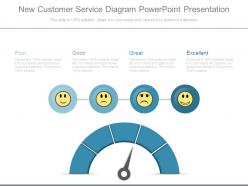 New customer service diagram powerpoint presentation
Presenting new customer service diagram powerpoint presentation. This is a new customer service diagram powerpoint presentation. This is a four stage process. The stages in this process are poor, good, great, excellent.
-
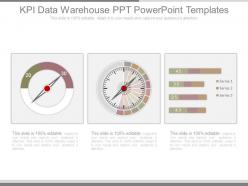 Kpi data warehouse ppt powerpoint templates
Presenting kpi data warehouse ppt powerpoint templates. This is a kpi data warehouse ppt powerpoint templates. This is a three stage process. The stages in this process are dashboard, measure, business, strategy, success.
-
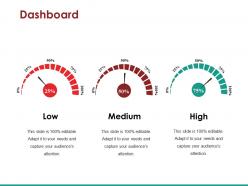 Dashboard snapshot example ppt presentation
Presenting this set of slides with name - Dashboard Snapshot Example Ppt Presentation. This is a three stage process. The stages in this process are Low, Medium, High.
-
 Ticking clock icon with check mark
Presenting this set of slides with name Ticking Clock Icon With Check Mark. This is a three stage process. The stages in this process are Ticking Clock Icon With Check Mark. This is a completely editable PowerPoint presentation and is available for immediate download. Download now and impress your audience.
-
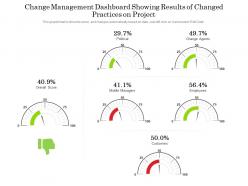 Change management dashboard showing results of changed practices on project
Presenting this set of slides with name Change Management Dashboard Showing Results Of Changed Practices On Project. This is a six stage process. The stages in this process are Employees, Customers, Overall Score. This is a completely editable PowerPoint presentation and is available for immediate download. Download now and impress your audience.
-
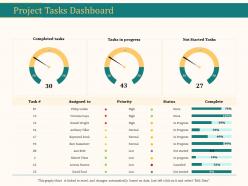 Project tasks dashboard ppt powerpoint presentation icon guide
Presenting this set of slides with name Project Tasks Dashboard Ppt Powerpoint Presentation Icon Guide. This is a three stage process. The stages in this process are Completed Tasks, Tasks In Progress, Not Started Tasks. This is a completely editable PowerPoint presentation and is available for immediate download. Download now and impress your audience.
-
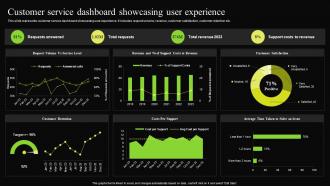 Customer Service Dashboard Showcasing User Digital Transformation Process For Contact Center
This slide represents customer service dashboard showcasing user experience. It includes request volume, revenue, customer satisfaction, customer retention etc. Deliver an outstanding presentation on the topic using this Customer Service Dashboard Showcasing User Digital Transformation Process For Contact Center. Dispense information and present a thorough explanation of Experience, Service, Customer using the slides given. This template can be altered and personalized to fit your needs. It is also available for immediate download. So grab it now.
-
 KPI Dashboard To Analyze Paid Marketing Paid Media Advertising Guide For Small MKT SS V
This slide showcases the parameters that would help the business organization to evaluate paid media marketing performance. It includes metrics such as cost per acquisition CPA, monthly conversion by channel, ad impressions, daily paid social clicks, etc. Deliver an outstanding presentation on the topic using this KPI Dashboard To Analyze Paid Marketing Paid Media Advertising Guide For Small MKT SS V. Dispense information and present a thorough explanation of Analyze, Marketing, Performance using the slides given. This template can be altered and personalized to fit your needs. It is also available for immediate download. So grab it now.
-
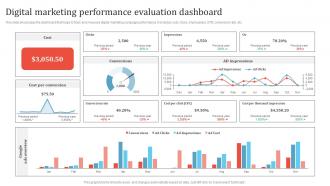 Digital Marketing Performance Evaluation Dashboard Promotion Campaign To Boost Business MKT SS V
This slide showcases the dashboard that helps to track and measure digital marketing campaign performance. It includes cost, clicks, impressions, STR, conversion rate, etc. Present the topic in a bit more detail with this Digital Marketing Performance Evaluation Dashboard Promotion Campaign To Boost Business MKT SS V. Use it as a tool for discussion and navigation on Marketing, Digital, Performance. This template is free to edit as deemed fit for your organization. Therefore download it now.
-
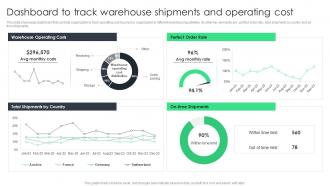 Dashboard To Track Warehouse Shipments And Reducing Inventory Wastage Through Warehouse
This slide showcases dashboard that can help organization to track operating cost incurred by organization in different warehousing activities. Its other key elements are - perfect order rate, total shipments by country and on time shipments. Deliver an outstanding presentation on the topic using this Dashboard To Track Warehouse Shipments And Reducing Inventory Wastage Through Warehouse. Dispense information and present a thorough explanation of Track, Operating, Cost using the slides given. This template can be altered and personalized to fit your needs. It is also available for immediate download. So grab it now.
-
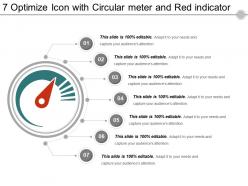 7 optimize icon with circular meter and red indicator
Presenting 7 optimize icon with circular meter and red indicator. This is a 7 optimize icon with circular meter and red indicator. This is a seven stage process. The stages in this process are optimize icon, analyze icon, engineering icon.
-
 Dashboard powerpoint images template 2
Presenting dashboard powerpoint images template 2. This is a dashboard powerpoint images template 2. This is a three stage process. The stages in this process are low, medium, high, dashboard, measurement.
-
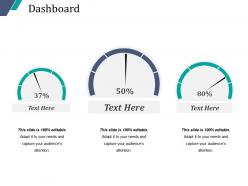 Dashboard snapshot powerpoint shapes
Presenting dashboard snapshot powerpoint shapes. This is a dashboard powerpoint shapes. This is a three stage process. The stages in this process are low, medium, high, dashboard, measurement.
-
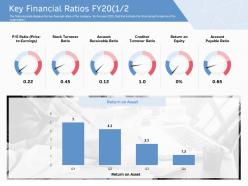 Key financial ratios fy20 account ppt powerpoint presentation show icons
The following slide displays the key financial ratios of the company for the year 2020 that that indicate the financial performance of the organization. Presenting this set of slides with name Key Financial Ratios Fy20 Account Ppt Powerpoint Presentation Show Icons. This is a six stage process. The stages in this process are Stock Turnover Ratio, Account Receivable Ratio, Creditor Turnover Ratio, Return On Equity, Account Payable Ratio. This is a completely editable PowerPoint presentation and is available for immediate download. Download now and impress your audience.
-
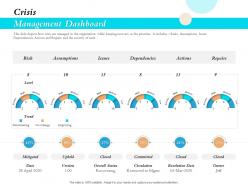 Crisis management dashboard snapshot actions ppt file topics
This slide depicts how crisis are managed in the organization while keeping recovery as the priorities. It includes Risks Assumptions Issues Dependencies Actions and Repairs and the severity of each. Presenting this set of slides with name Crisis Management Dashboard Snapshot Actions Ppt File Topics. This is a six stage process. The stages in this process are Risk, Assumptions, Issues, Dependencies, Actions. This is a completely editable PowerPoint presentation and is available for immediate download. Download now and impress your audience.
-
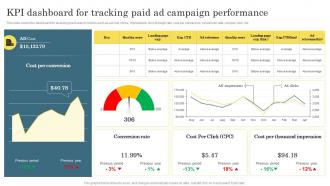 KPI Dashboard For Tracking Paid Ad Campaign Digital Marketing Analytics For Better Business
This slide covers the dashboard for analyzing paid search metrics such as ad cost, clicks, impressions, click-through rate, cost per conversion, conversion rate, cost per click, etc. Deliver an outstanding presentation on the topic using this KPI Dashboard For Tracking Paid Ad Campaign Digital Marketing Analytics For Better Business. Dispense information and present a thorough explanation of Conversion Rate, Cost Per Click, Cost Per Conversion using the slides given. This template can be altered and personalized to fit your needs. It is also available for immediate download. So grab it now.
-
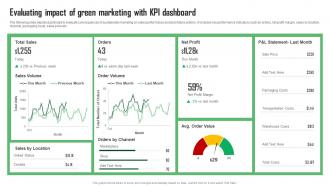 Evaluating Impact Of Green Marketing With KPI Green Marketing Guide For Sustainable Business MKT SS
The following slide depicts dashboard to evaluate consequences of sustainable marketing on sales performance and plan future actions. It includes key performance indicators such as orders, net profit margin, sales by location, channel, packaging costs, sales price etc. Present the topic in a bit more detail with this Evaluating Impact Of Green Marketing With KPI Green Marketing Guide For Sustainable Business MKT SS. Use it as a tool for discussion and navigation on Impact, Marketing, Evaluating. This template is free to edit as deemed fit for your organization. Therefore download it now.
-
 Social dashboard infographics chart powerpoint slides
Presenting social dashboard infographics chart powerpoint slides. This Power Point template slide has been crafted with graphic of social dashboard info graphics. This PPT slide contains the concept of social info management. Use this PPT slide for business and finance related presentations.
-
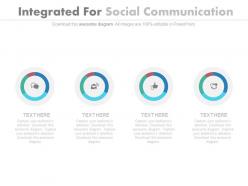 Four integrated for social communication powerpoint slides
Presenting four integrated for social communication powerpoint slides. This Power Point template slide has been crafted with graphic of four integrated. This PPT slide contains the concept of social communication. Use this PPT slide for business and technology related presentations.
-
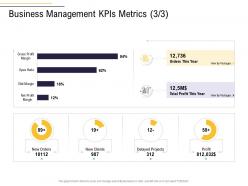 Business management kpis metrics delayed projects business process analysis ppt summary
Present the topic in a bit more detail with this Business Management Kpis Metrics Delayed Projects Business Process Analysis Ppt Summary. Use it as a tool for discussion and navigation on Business Management Kpis Metrics Delayed Projects . This template is free to edit as deemed fit for your organization. Therefore download it now.
-
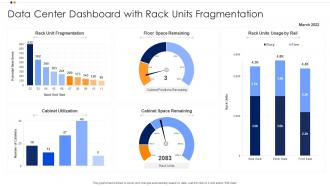 Data Center Dashboard Snapshot With Rack Units Fragmentation
Presenting our well structured Data Center Dashboard Snapshot With Rack Units Fragmentation. The topics discussed in this slide are Data Center Dashboard, Rack Units Fragmentation, Cabinet Utilization. This is an instantly available PowerPoint presentation that can be edited conveniently. Download it right away and captivate your audience.
-
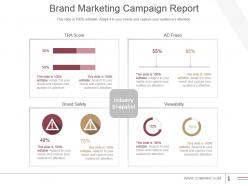 Brand marketing campaign report powerpoint guide
Presenting brand marketing campaign report powerpoint guide. This is a brand marketing campaign report powerpoint guide. This is a four stage process. The stages in this process are brand safety, industry snapshot, viewability, tra score, ad fraud.
-
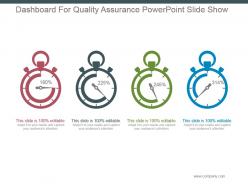 Dashboard for quality assurance powerpoint slide show
Presenting dashboard for quality assurance powerpoint slide show. This is a dashboard for quality assurance powerpoint slide show. This is a four stage process. The stages in this process are dashboard, management, business, marketing, speedometer.
-
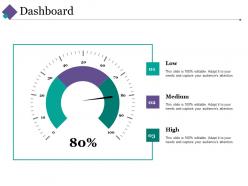 Dashboard Snapshot ppt gallery inspiration
Introducing dashboard snapshot PPT gallery inspiration design. Innovatively designed PowerPoint template is well-known with Google slides. Flexible as can be alter into PDF or JPEG formats. Ready to share and easy to download presentation slide you save time and effort. PPT design is accessible in standard and widescreen view. Color, text and font can be amended as the presentation visual is entirely adaptable. Easy to download and save into the system for later use.
-
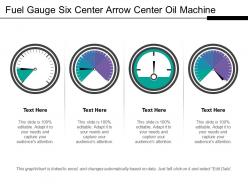 Fuel gauge six center arrow center oil machine 1
Presenting this set of slides with name - Fuel Gauge Six Center Arrow Center Oil Machine 1. This is a four stage process. The stages in this process are Fuel Gauge, Gas Gauge, Fuel Containers.
-
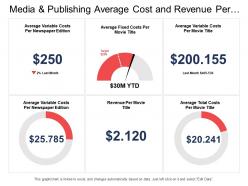 Media and publishing average cost and revenue per movie title dashboard
Presenting this set of slides with name - Media And Publishing Average Cost And Revenue Per Movie Title Dashboard. This is a six stage process. The stages in this process are Media And Publishing, Media Communication.
-
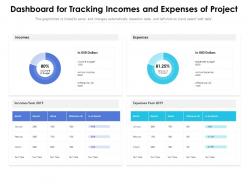 Dashboard for tracking incomes and expenses of project
Presenting this set of slides with name Dashboard For Tracking Incomes And Expenses Of Project. The topics discussed in these slides are Incomes, Year, Expenses, Dollars, Budget. This is a completely editable PowerPoint presentation and is available for immediate download. Download now and impress your audience.
-
 Trust meter icon for business partnership
Presenting this set of slides with name Trust Meter Icon For Business Partnership. This is a three stage process. The stages in this process are Trust Meter Icon For Business Partnership. This is a completely editable PowerPoint presentation and is available for immediate download. Download now and impress your audience.
-
 Car or bike dashboard petrol meter
Presenting this set of slides with name Car Or Bike Dashboard Petrol Meter. This is a three stage process. The stages in this process are Car Or Bike Dashboard Petrol Meter. This is a completely editable PowerPoint presentation and is available for immediate download. Download now and impress your audience.
-
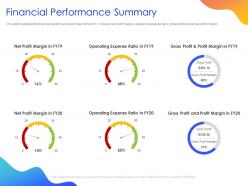 Financial performance summary ppt powerpoint presentation pictures influencers
This slide illustrates the financial performance summary of the firm. It covers net profit margin, operating expense ratio, gross profit and gross profit margin. Presenting this set of slides with name Financial Performance Summary Ppt Powerpoint Presentation Pictures Influencers. This is a six stage process. The stages in this process are Profit Margin, Operating Expense, Gross Profit. This is a completely editable PowerPoint presentation and is available for immediate download. Download now and impress your audience.
-
 Employee performance optimization using speedometer
Presenting this set of slides with name Employee Performance Optimization Using Speedometer. This is a four stage process. The stages in this process are Employee Performance Optimization Using Speedometer. This is a completely editable PowerPoint presentation and is available for immediate download. Download now and impress your audience.
-
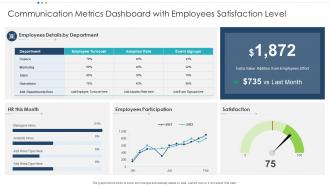 Communication Metrics Dashboard with Employees Satisfaction Level
Presenting our well structured Communication Metrics Dashboard with Employees Satisfaction Level. The topics discussed in this slide are Employees Participation, Satisfaction, HR. This is an instantly available PowerPoint presentation that can be edited conveniently. Download it right away and captivate your audience.
-
 Dashboard Snapshot ppt slides
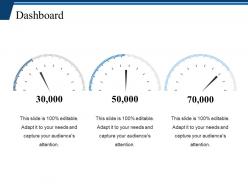
Presenting this set of slides with name - Dashboard Snapshot Ppt Slides. This is a three stage process. The stages in this process are Dashboard, Marketing, Management, Business, Strategy.
-
 Dashboard snapshot ppt inspiration
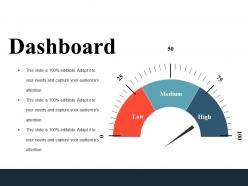
Presenting this set of slides with name - Dashboard Snapshot Ppt Inspiration. This is a one stage process. The stages in this process are Dashboard, Business, Marketing, Planning, Management.
-
 Dashboard snapshot ppt model
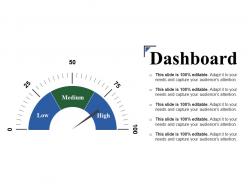
Presenting this set of slides with name - Dashboard Snapshot Ppt Model. This is a three stage process. The stages in this process are dashboard, finance, speed, meter, business.
-
 Dashboard snapshot ppt file designs
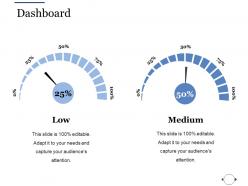
Presenting this set of slides with name - Dashboard Snapshot Ppt File Designs. This is a two stage process. The stages in this process are Low, Medium, High, Dashboard, Measurement.
-
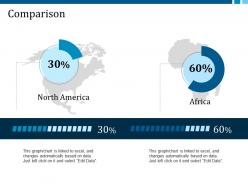 Comparison ppt model format ideas
Presenting this set of slides with name - Comparison Ppt Model Format Ideas. This is a two stage process. The stages in this process are Financial, North America, Africa, Business, Percentage.
-
 Kpi icon showing magnifying glass bar graph and pie chart
Presenting this set of slides with name - Kpi Icon Showing Magnifying Glass Bar Graph And Pie Chart. This is a four stage process. The stages in this process are Kpi Icon, Metircs Icon, Dashboard Icon.
-
 Kpi icon showing pie chart and bar graph in monitor
Presenting this set of slides with name - Kpi Icon Showing Pie Chart And Bar Graph In Monitor. This is a four stage process. The stages in this process are Kpi Icon, Metircs Icon, Dashboard Icon.
-
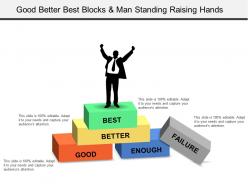 Good better best blocks and man standing raising hands
Presenting this set of slides with name - Good Better Best Blocks And Man Standing Raising Hands. This is a five stage process. The stages in this process are Good Better Best, Good Great Superb, Good Great Excellent.
-
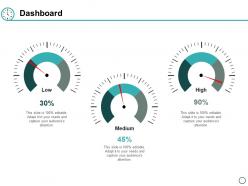 Dashboard measuring ppt powerpoint presentation layouts example file
Presenting this set of slides with name - Dashboard Measuring Ppt Powerpoint Presentation Layouts Example File. This is a three stages process. The stages in this process are Dashboard, Business, Marketing, Management, Planning.
-
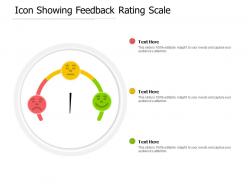 Icon showing feedback rating scale
Presenting this set of slides with name Icon Showing Feedback Rating Scale. This is a three stage process. The stages in this process are Product Improvement, Rating Scale, Product Quality. This is a completely editable PowerPoint presentation and is available for immediate download. Download now and impress your audience.


