Dashboard PowerPoint Slides, KPi Dashboard PPT Templates
- Sub Categories
-
- 30 60 90 Day Plan
- About Us Company Details
- Action Plan
- Agenda
- Annual Report
- Audit Reports
- Balance Scorecard
- Brand Equity
- Business Case Study
- Business Communication Skills
- Business Plan Development
- Business Problem Solving
- Business Review
- Capital Budgeting
- Career Planning
- Change Management
- Color Palettes
- Communication Process
- Company Location
- Company Vision
- Compare
- Competitive Analysis
- Corporate Governance
- Cost Reduction Strategies
- Custom Business Slides
- Customer Service
- Dashboard
- Data Management
- Decision Making
- Digital Marketing Strategy
- Digital Transformation
- Disaster Management
- Diversity
- Equity Investment
- Financial Analysis
- Financial Services
- Financials
- Growth Hacking Strategy
- Human Resource Management
- Innovation Management
- Interview Process
- Knowledge Management
- Leadership
- Lean Manufacturing
- Legal Law Order
- Management
- Market Segmentation
- Marketing
- Media and Communication
- Meeting Planner
- Mergers and Acquisitions
- Metaverse
- Newspapers
- Operations and Logistics
- Organizational Structure
- Our Goals
- Performance Management
- Pitch Decks
- Pricing Strategies
- Process Management
- Product Development
- Product Launch Ideas
- Product Portfolio
- Project Management
- Purchasing Process
- Quality Assurance
- Quotes and Testimonials
- Real Estate
- Risk Management
- Sales Performance Plan
- Sales Review
- SEO
- Service Offering
- Six Sigma
- Social Media and Network
- Software Development
- Solution Architecture
- Stock Portfolio
- Strategic Management
- Strategic Planning
- Supply Chain Management
- Swimlanes
- System Architecture
- Team Introduction
- Testing and Validation
- Thanks-FAQ
- Time Management
- Timelines Roadmaps
- Value Chain Analysis
- Value Stream Mapping
- Workplace Ethic
-
 Alarm clock with icons for time management powerpoint slides
Presenting alarm clock with icons for time management powerpoint slides. This Power Point template slide has been crafted with graphic of alarm clock and icons. This PPT slide contains the concept of time management. Use this PPT slide for business and finance related presentations.
-
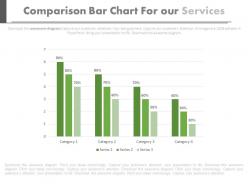 Comparision bar chart for our services powerpoint slides
Presenting comparision bar chart for our services powerpoint slides. This Power Point template slide has been crafted with graphic of comparison bar chart. This PPT slide contains the concept of business services representation. Use this PPT slide for business and finance related presentations.
-
 0614 business consulting diagram layout of volume control powerpoint slide template
Easy to download. Easy to save in format of one’s choice. Compatible with numerous online and offline software options. Thoroughly editable slide design visual. Ease of addition and deletion of content at sole discretion. Ease of personalization with company specific name and logo or trademark. High resolution visuals. No fear of image pixilation when projected on wide screen. Used by large number of business analysts, strategists, entrepreneurs, students and teachers.
-
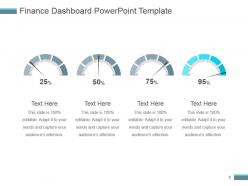 Finance dashboard snapshot powerpoint template
Presenting finance dashboard powerpoint template. This is a finance dashboard snapshot powerpoint template. This is a four stage process. The stages in this process are dashboard, finance, percentage, business, marketing.
-
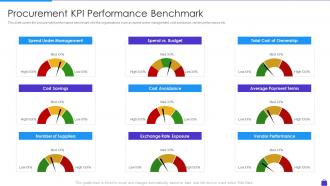 Procurement KPI Performance Benchmark Purchasing Analytics Tools And Techniques
This slide covers the procurement performance benchmarks for the organizations such as spend under management, cost avoidance, vender performance etc. Deliver an outstanding presentation on the topic using this Procurement KPI Performance Benchmark Purchasing Analytics Tools And Techniques. Dispense information and present a thorough explanation of Cost Savings, Vendor Performance, Spend Vs Budget using the slides given. This template can be altered and personalized to fit your needs. It is also available for immediate download. So grab it now.
-
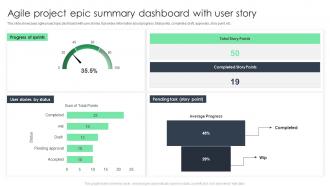 Agile Project Epic Summary Dashboard With User Story
This slide showcases agile project epic dashboard with user stories. It provides information about progress, total points, completed, draft, approvals, story point, etc. Introducing our Agile Project Epic Summary Dashboard With User Story set of slides. The topics discussed in these slides are Progress Of Sprints, Dashboard. This is an immediately available PowerPoint presentation that can be conveniently customized. Download it and convince your audience.
-
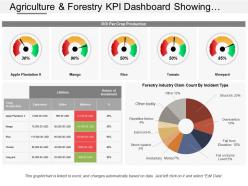 Agriculture and forestry kpi dashboard showing roi per crop production and industry claim count
Presenting agriculture and forestry KPI dashboard showing ROI per crop production and industry claim count PowerPoint slide. Unaffected high-resolution PowerPoint slide. Include or exclude slide content as per your individual need. Personalize the presentation with individual company name and logo. Beneficial for industry professionals, managers, executives, researchers, sales people, etc. This template is available in both Standard and Widescreen slide size. Easy and quick downloading process. Flexible option for conversion in PDF or JPG formats. Compatible with Google slides.
-
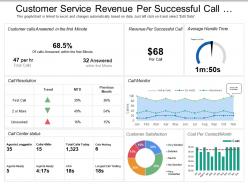 Customer service revenue per successful call dashboard
Presenting this set of slides with name - Customer Service Revenue Per Successful Call Dashboard. This is a three stage process. The stages in this process are Customer Base, Recurring Customers, Customer Services.
-
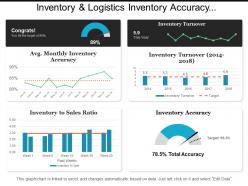 Inventory and logistics inventory accuracy dashboards
Presenting this set of slides with name - Inventory And Logistics Inventory Accuracy Dashboards. This is a four stage process. The stages in this process are Inventory And Logistics, Inventory Management, Warehousing And Inventory Management.
-
 Transportation kpi dashboard snapshot showing fleet delivery status loading time and weight
Presenting transportation KPI dashboard snapshot showing fleet delivery status loading time and weight PPT slide. Simple data input with linked Excel chart, just right click to input values. This PowerPoint theme is fully supported by Google slides. Picture quality of these slides does not change even when project on large screen. Fast downloading speed and formats can be easily changed to JPEG and PDF applications. This template is suitable for marketing, sales persons, business managers and entrepreneurs.
-
 Evaluating Projected Vs Actual Sales Adopting Sales Risks Management Strategies
The following slide depicts the evaluation of existing sales performance to set future standards and determine opportunities for improvement. It mainly includes key performance indicators KPIssuch as pipeline, forecast, attainment, gap etc. Deliver an outstanding presentation on the topic using this Evaluating Projected Vs Actual Sales Adopting Sales Risks Management Strategies. Dispense information and present a thorough explanation of Forecast, Attainment, Gap using the slides given. This template can be altered and personalized to fit your needs. It is also available for immediate download. So grab it now.
-
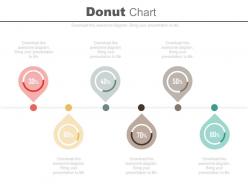 Six staged donut chart percentage timeline diagram powerpoint slides
Presenting six staged donut chart percentage timeline diagram powerpoint slides. This Power Point template slide has been crafted with graphic of six staged donut chart and percentage timeline. This PPT slide contains the concept of financial analysis. Use this PPT slide for business and finance related presentations.
-
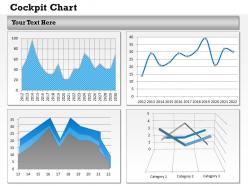 0314 dashboard layout for business
Shapes can be restructured and relevant data can be infused in presentation visual. Presentation slide can be put to use for handling business sales, management and recourse disbursement. Professional theme which can be adjusted with respect to font, color and layout. Striking and appealing color combination provides professional look to PPT layout. Conversion into PDF or JPG formats is totally user friendly. PPT graphic supports and ensures font and text size which can be read from a distance.
-
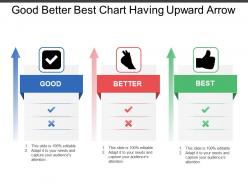 Good better best chart having upward arrow
Presenting this set of slides with name - Good Better Best Chart Having Upward Arrow. This is a three stage process. The stages in this process are Good Better Best, Good Great Superb, Good Great Excellent.
-
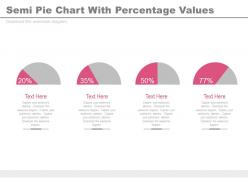 Four semi pie charts with percentage values powerpoint slides
Presenting four semi pie charts with percentage values powerpoint slides. This Power Point template slide has been crafted with graphic of four semi pie charts and percentage icons. This PPT slide contains the concept of financial values analysis. Use this PPT slide for business and finance related presentations.
-
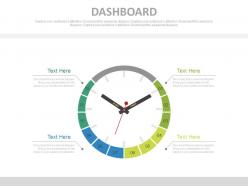 Clock design dashboard for time management powerpoint slides
Presenting clock design dashboard for time management powerpoint slides. This Power Point template slide has been crafted with graphic of clock design dashboard. This PPT slide contains the concept of time management. Use this PPT slide for business and finance related presentations.
-
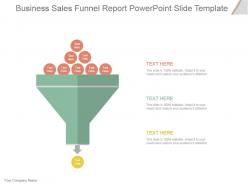 Business sales funnel report powerpoint slide template
Presenting business sales funnel report powerpoint slide template. This is a business sales funnel report powerpoint slide template. This is a three stage process. The stages in this process are business, funnel, strategy, arrow, process.
-
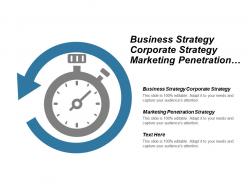 Business strategy corporate strategy marketing penetration strategy project management cpb
Presenting this set of slides with name - Business Strategy Corporate Strategy Marketing Penetration Strategy Project Management Cpb. This is an editable two stages graphic that deals with topics like Business Strategy Corporate Strategy, Marketing Penetration Strategy, Project Management to help convey your message better graphically. This product is a premium product available for immediate download, and is 100 percent editable in Powerpoint. Download this now and use it in your presentations to impress your audience.
-
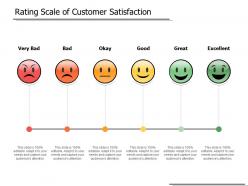 Rating scale of customer satisfaction
Presenting this set of slides with name Rating Scale Of Customer Satisfaction. This is a six stage process. The stages in this process are Product Improvement, Rating Scale, Product Quality. This is a completely editable PowerPoint presentation and is available for immediate download. Download now and impress your audience.
-
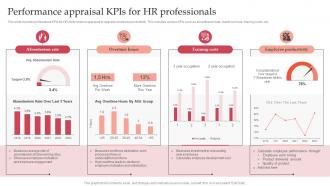 Performance Appraisal KPIs For HR Professionals
This slide includes professional KPIs for HR performance appraisal to upgrade employee productivity. This includes various KPIs such as absenteeism rate, overtime hours, training costs, etc. Presenting our well structured Performance Appraisal KPIs For HR Professionals. The topics discussed in this slide are Performance, Appraisal, Professionals. This is an instantly available PowerPoint presentation that can be edited conveniently. Download it right away and captivate your audience.
-
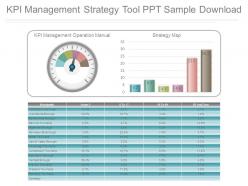 Kpi management strategy tool ppt sample download
Presenting kpi management strategy tool ppt sample download. This is a kpi management strategy tool ppt sample download. This is a two stage process. The stages in this process are kpi management operation manual, strategy map.
-
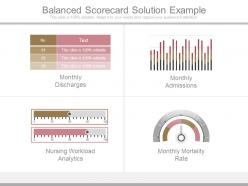 Balanced scorecard solution example
Presenting balanced scorecard solution example. This is a balanced scorecard solution example. This is a four stage process. The stages in this process are monthly discharges, monthly admissions, nursing workload analytics, monthly mortality rate.
-
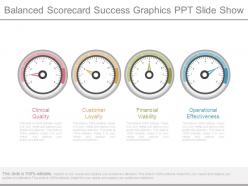 Balanced scorecard success graphics ppt slide show
Presenting balanced scorecard success graphics ppt slide show. This is a balanced scorecard success graphics ppt slide show. This is a four stage process. The stages in this process are clinical quality, customer loyalty, financial viability, operational effectiveness.
-
 Agile icon circles with two arrows and stop watch
Presenting this set of slides with name - Agile Icon Circles With Two Arrows And Stop Watch. This is a one stage process. The stages in this process are Agile Icons, Sprint Icons, Scrum Icons.
-
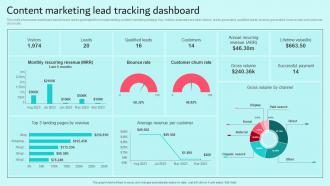 Content Marketing Lead Tracking Dashboard Brand Content Strategy Guide MKT SS V
This slide showcases dashboard used to track leads generated from implementing content marketing strategy. Key metrics evaluated are total visitors, leads generated, qualified leads, revenue generated, bounce rate and customer churn rate. Present the topic in a bit more detail with this Content Marketing Lead Tracking Dashboard Brand Content Strategy Guide MKT SS V. Use it as a tool for discussion and navigation on Customers, Annual, Revenue. This template is free to edit as deemed fit for your organization. Therefore download it now.
-
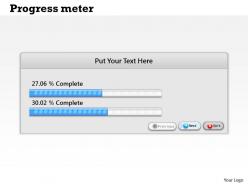 0314 progress meter dashboard design
Visually appealing PowerPoint presentation slides for business progress. Download is quick and can be easily shared. Fully modifiable presentation slide as editing is possible. Access to transform the presentation design into JPG and PDF. High quality images and visuals used in the PPT design. Beneficial for industry professionals, managers, executives, researchers, sales people, etc. The presentation template can be downloaded and saved in any desired format.
-
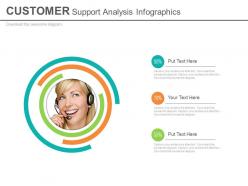 Customer support analysis infographics powerpoint slides
Presenting customer support analysis infographics powerpoint slides. This Power Point template slide has been crafted with graphic of customer support info graphics. This PPT slide contains the concept of customer support analysis representation. Use this PPT slide for business and finance related presentations.
-
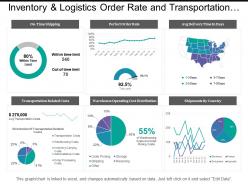 Inventory and logistics order rate and transportation costs dashboards
Presenting this set of slides with name - Inventory And Logistics Order Rate And Transportation Costs Dashboards. This is a three stage process. The stages in this process are Inventory And Logistics, Inventory Management, Warehousing And Inventory Management.
-
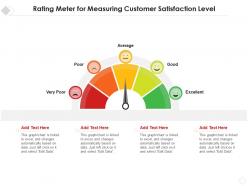 Rating meter for measuring customer satisfaction level
Introducing our premium set of slides with Rating Meter For Measuring Customer Satisfaction Level. Ellicudate the four stages and present information using this PPT slide. This is a completely adaptable PowerPoint template design that can be used to interpret topics like Rating Meter For Measuring Customer Satisfaction Level. So download instantly and tailor it with your information.
-
 Customer Success KPI Dashboard To Measure Support Team Performance Ppt Show
Mentioned slide showcases customer success dashboard that company is currently using to measure its support team performance. KPIs covered in the dashboard are health score, retention cost, churn rate etc. Present the topic in a bit more detail with this Customer Success KPI Dashboard To Measure Support Team Performance Ppt Show. Use it as a tool for discussion and navigation on Customer Success KPI Dashboard To Measure Support Team Performance. This template is free to edit as deemed fit for your organization. Therefore download it now.
-
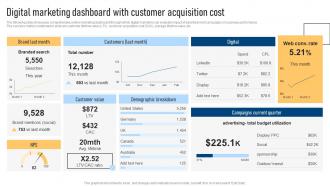 Digital Marketing Dashboard With Effective Marketing Strategies For Bootstrapped Strategy SS V
The following slide showcases comprehensive online marketing dashboard through which digital marketers can evaluate impact of advertisement campaigns on business performance. The success metrics mentioned in slide are customer lifetime value LTV, customer acquisition cost CAC, average lifetime value, etc. Deliver an outstanding presentation on the topic using this Digital Marketing Dashboard With Effective Marketing Strategies For Bootstrapped Strategy SS V. Dispense information and present a thorough explanation of Marketing, Digital, Cost using the slides given. This template can be altered and personalized to fit your needs. It is also available for immediate download. So grab it now.
-
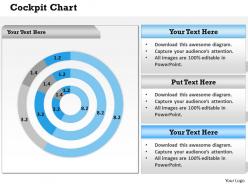 0314 design of business static dashboard
Easily editable presentation layout as color, text and font are editable. PowerPoint designs are totally compatible with Google slides. Effortlessly download and changeable into JPEG and PDF document. Choice of insertion of corporate symbol and image for personalization. Presentable and easy to comprehend info graphic format. PPT slide can be presented in both standard and widescreen view. Excel linked design so you can make changes in the excel sheet and the design will change accordingly.
-
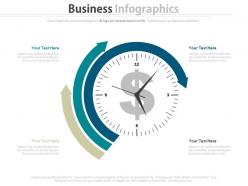 Time management for digital marketing and planning financial growth powerpoint slides
Presenting time management for digital marketing and planning financial growth powerpoint slides. This Power Point template diagram slide has been crafted with graphic of growth. This PPT diagram contains the concept of time management and planning representation. Use this PPT diagram for business and finance related presentations.
-
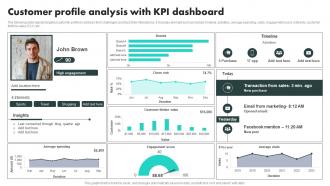 Customer Data Platform Adoption Process Customer Profile Analysis With KPI Dashboard
The following slide depicts targeted customer profile to address their challenges and track their interactions. It includes element such as brands, timeline, activities, average spending, visits, engagement score, interests, customer lifetime value CLV etc. Present the topic in a bit more detail with this Customer Data Platform Adoption Process Customer Profile Analysis With KPI Dashboard. Use it as a tool for discussion and navigation on Connected, Email, Marketing. This template is free to edit as deemed fit for your organization. Therefore download it now.
-
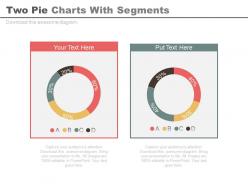 Two pie charts with segments powerpoint slides
Presenting two pie charts with segments powerpoint slides. This Power Point template slide has been crafted with graphic of two pie charts. This PPT slide contains the concept of financial data analysis. Use this PPT slide for business and finance related presentations.
-
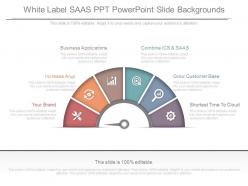 A white label saas ppt powerpoint slide backgrounds
Presenting a white label saas ppt powerpoint slide backgrounds. This is a white label saas ppt powerpoint slide backgrounds. This is a six stage process. The stages in this process are your brand, increase arup, business applications, combine ics and saas, grow customer base, shortest time to cloud.
-
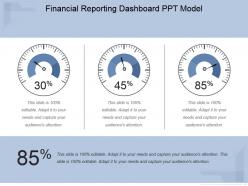 Financial reporting dashboard snapshot ppt model
Presenting financial reporting dashboard ppt model. This is a financial reporting dashboard snapshot ppt model. This is a three stage process. The stages in this process are business, dashboard, financial, measuring, meter.
-
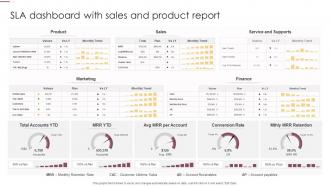 SLA Dashboard Snapshot With Sales And Product Report
Introducing our SLA Dashboard Snapshot With Sales And Product Report set of slides. The topics discussed in these slides are Marketing, Finance, Service And Supports. This is an immediately available PowerPoint presentation that can be conveniently customized. Download it and convince your audience.
-
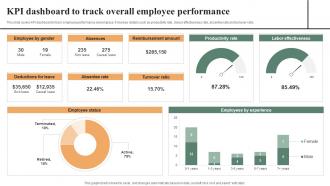 KPI Dashboard To Track Overall Employee Effective Workplace Culture Strategy SS V
This slide covers KPI dashboard to track employee performance at workplace. It involves details such as productivity rate, labour effectiveness rate, absentee rate and turnover ratio. Deliver an outstanding presentation on the topic using this KPI Dashboard To Track Overall Employee Effective Workplace Culture Strategy SS V. Dispense information and present a thorough explanation of Employee, Deductions, Reimbursement using the slides given. This template can be altered and personalized to fit your needs. It is also available for immediate download. So grab it now.
-
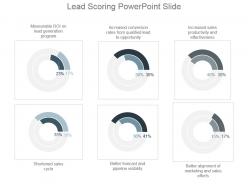 Lead scoring powerpoint slide
Presenting lead scoring powerpoint slide. This is a lead scoring powerpoint slide. This is a six stage process. The stages in this process are measurable roi on lead generation program, increased conversion rates from qualified lead to opportunity, increased sales productivity and effectiveness, shortened sales cycle, better forecast and pipeline visibility, better alignment of marketing and sales efforts.
-
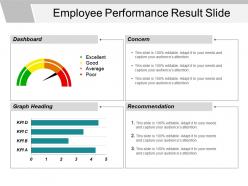 Employee performance result slide powerpoint slide influencers
Presenting Employee Performance Result Slide PowerPoint Slide Influencers. Download this slide and save this in JPG and PDF formats along with the various other formats. A user can display this employee performance result template on either standard or wide screen. The infographic performance slide design is completely compatible with Google Slides and fully customizable in PowerPoint. Sharing of employee performance slide with large segment is easy due to its superb pixel quality. You can modify the color, text, font style & font size and aspect ratio of this infographic employee performance slide.
-
 Fuel gauge six center arrow center oil machine
Presenting this set of slides with name - Fuel Gauge Six Center Arrow Center Oil Machine. This is a one stage process. The stages in this process are Fuel Gauge, Gas Gauge, Fuel Containers.
-
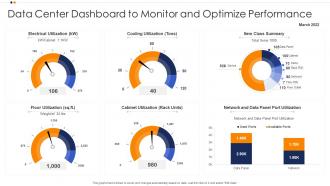 Data Center Dashboard Snapshot To Monitor And Optimize Performance
Presenting our well structured Data Center Dashboard Snapshot To Monitor And Optimize Performance. The topics discussed in this slide are Data Center Dashboard, Monitor And Optimize Performance, Cabinet Utilization. This is an instantly available PowerPoint presentation that can be edited conveniently. Download it right away and captivate your audience.
-
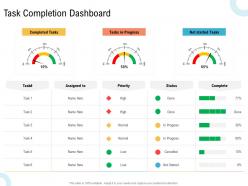 Task completion dashboard creating an effective content planning strategy for website ppt sample
Increase audience engagement and knowledge by dispensing information using Task Completion Dashboard Creating An Effective Content Planning Strategy For Website Ppt Sample. This template helps you present information on three stages. You can also present information on completed tasks, tasks in progress, net started tasksusing this PPT design. This layout is completely editable so personaize it now to meet your audiences expectations.
-
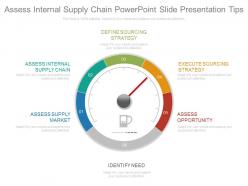 Assess internal supply chain powerpoint slide presentation tips
Presenting assess internal supply chain powerpoint slide presentation tips. Presenting assess internal supply chain powerpoint slide presentation tips. This is a assess internal supply chain powerpoint slide presentation tips. This is a five stage process. The stages in this process are define sourcing strategy, execute sourcing strategy, assess opportunity, assess internal supply chain, assess supply market.
-
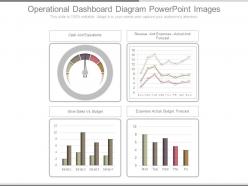 Operational dashboard diagram powerpoint images
Presenting operational dashboard diagram powerpoint images. This is a operational dashboard diagram powerpoint images. This is a four stage process. The stages in this process are cash and equivalents, revenue and expenses actual and forecast, store sales vs budget, expenses actual budget forecast.
-
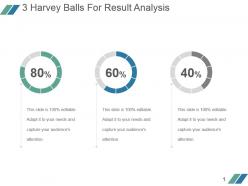 3 harvey balls for result analysis example of ppt
Presenting 3 harvey balls for result analysis example of ppt. This is a 3 harvey balls for result analysis example of ppt. This is a three stage process. The stages in this process are finance, process, business, marketing, percentage.
-
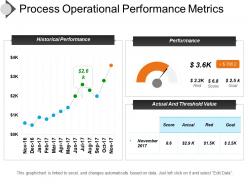 Process operational performance metrics presentation slides
Presenting process operational performance metrics presentation slides. PPT is useful in process performance measurement and improvement related slideshows. You can open the design template with Google Slides and PowerPoint. Images are fully supported on standard and wide screen views. Diagrams are fully editable in PowerPoint. You can change all the design components including font type, color, size, shape, background, images etc.
-
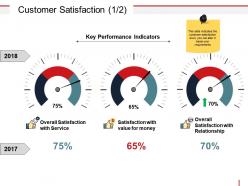 Customer satisfaction powerpoint images
Presenting customer satisfaction powerpoint images. This is a customer satisfaction powerpoint images. This is a three stage process. The stages in this process are key performance indicators, percentage, year, measurement, dashboard.
-
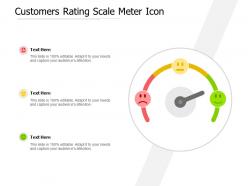 Customers rating scale meter icon
Presenting this set of slides with name Customers Rating Scale Meter Icon. This is a three stage process. The stages in this process are Product Improvement, Rating Scale, Product Quality. This is a completely editable PowerPoint presentation and is available for immediate download. Download now and impress your audience.
-
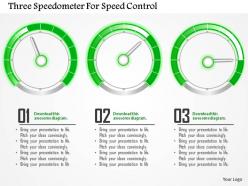 Three speedometer for speed control powerpoint template
We are proud to present our three speedometer for speed control powerpoint template. Graphic of three speedometers has been used to craft this power point template. This PPT diagram contains the concept of speed control. Use this PPT diagram for business and technology related presentations and explain the control related topics.
-
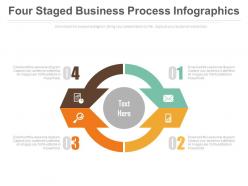 Four staged business process infographics powerpoint slides
Presenting four staged business process infographics powerpoint slides. This Power Point template slide has been crafted with graphic of four staged business info graphics. This PPT slide contains the concept of business process flow. Use this PPT slide for business and finance related presentations.
-
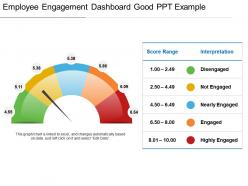 Employee engagement dashboard snapshot good ppt example
Presenting employee engagement dashboard snapshot good PPT example presentation slides. Simple data input like company logo, name or trademark. This PowerPoint template is fully supported by Google Slides. User can edit the data in linked excel sheet and graphs and charts gets customized accordingly. This layout offers fast downloading speed and formats can be easily changed to JPEG and PDF applications. This template is suitable for marketing, sales persons, business managers and entrepreneurs. Adjust PPT layout, font, text and color as per your necessity.
-
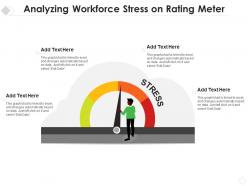 Analyzing workforce stress on rating meter
Presenting our set of slides with Analyzing Workforce Stress On Rating Meter. This exhibits information on four stages of the process. This is an easy to edit and innovatively designed PowerPoint template. So download immediately and highlight information on Analyzing Workforce Stress On Rating Meter.
-
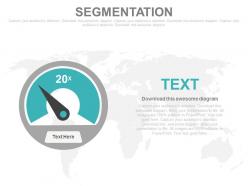 Data segmentation for business analysis powerpoint slides
Presenting data segmentation for business analysis powerpoint slides. This Power Point template slide has been crafted with graphic of dashboard chart. This PPT diagram slide contains the concept of data segmentation for business analysis. Use this PPT slide for business and marketing related presentations.
-
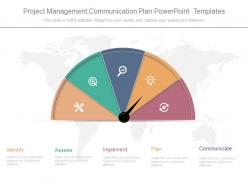 Project management communication plan powerpoint templates
Presenting project management communication plan powerpoint templates. This is a project management communication plan powerpoint templates. This is a five stage process. The stages in this process are identify, assess, implement, plan, communicate.
-
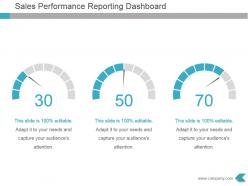 Sales performance reporting dashboard powerpoint template
Presenting sales performance reporting dashboard powerpoint template. This is a sales performance reporting dashboard powerpoint template. This is a three stage process. The stages in this process are dashboard, management, process, strategy, analysis.
-
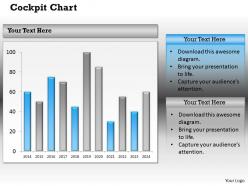 0314 dashboard for executive reports
No risk of graphic pixilation whatever be the size of screen to display. Access to download and use the variety of relevant icons. Attune well with the Google Slides and other offline softwares. Allow instant downloading and saving of the template in variety of formats. 100% customization of the slide icon allowed. Useful for the business presenters, investors, accounts and stock exchange individuals.
-
 PPC Marketing KPI Dashboard To Analyse Strategy MDSS To Improve Campaign Effectiveness MKT SS V
This slide covers PPC marketing dashboard to improve efficiency. It involves total spends, number of clicks, cost per conversion, change in conversion rate and cost per thousand impression. Present the topic in a bit more detail with this PPC Marketing KPI Dashboard To Analyse Strategy MDSS To Improve Campaign Effectiveness MKT SS V. Use it as a tool for discussion and navigation on Marketing, Strategy, Analyse. This template is free to edit as deemed fit for your organization. Therefore download it now.
-
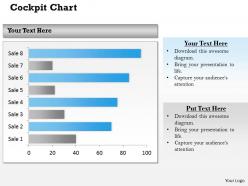 0314 business graph dashboard layout
Each and every object can be customised to propose the most valuable and useful information. Runs smoothly with all the software’s. Allows instant downloading to save your valuable time and efforts. Convertible into JPG and PDF formats. Extremely flexible and compatible PPT presentation diagram. Allows adding business details such as name, trademark, logo etcetera.


