Dashboard PowerPoint Slides, KPi Dashboard PPT Templates
- Sub Categories
-
- 30 60 90 Day Plan
- About Us Company Details
- Action Plan
- Agenda
- Annual Report
- Audit Reports
- Balance Scorecard
- Brand Equity
- Business Case Study
- Business Communication Skills
- Business Plan Development
- Business Problem Solving
- Business Review
- Capital Budgeting
- Career Planning
- Change Management
- Color Palettes
- Communication Process
- Company Location
- Company Vision
- Compare
- Competitive Analysis
- Corporate Governance
- Cost Reduction Strategies
- Custom Business Slides
- Customer Service
- Dashboard
- Data Management
- Decision Making
- Digital Marketing Strategy
- Digital Transformation
- Disaster Management
- Diversity
- Equity Investment
- Financial Analysis
- Financial Services
- Financials
- Growth Hacking Strategy
- Human Resource Management
- Innovation Management
- Interview Process
- Knowledge Management
- Leadership
- Lean Manufacturing
- Legal Law Order
- Management
- Market Segmentation
- Marketing
- Media and Communication
- Meeting Planner
- Mergers and Acquisitions
- Metaverse
- Newspapers
- Operations and Logistics
- Organizational Structure
- Our Goals
- Performance Management
- Pitch Decks
- Pricing Strategies
- Process Management
- Product Development
- Product Launch Ideas
- Product Portfolio
- Project Management
- Purchasing Process
- Quality Assurance
- Quotes and Testimonials
- Real Estate
- Risk Management
- Sales Performance Plan
- Sales Review
- SEO
- Service Offering
- Six Sigma
- Social Media and Network
- Software Development
- Solution Architecture
- Stock Portfolio
- Strategic Management
- Strategic Planning
- Supply Chain Management
- Swimlanes
- System Architecture
- Team Introduction
- Testing and Validation
- Thanks-FAQ
- Time Management
- Timelines Roadmaps
- Value Chain Analysis
- Value Stream Mapping
- Workplace Ethic
-
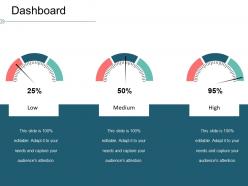 Dashboard snapshot ppt icon
Presenting this set of slides with name - Dashboard Snapshot Ppt Icon. This is a three stage process. The stages in this process are Low, Medium, High, Dashboard, Business, Percentage.
-
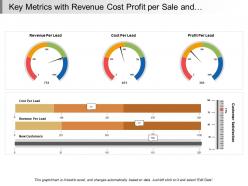 Key metrics with revenue cost profit per sale and customer satisfaction
Presenting this set of slides with name - Key Metrics With Revenue Cost Profit Per Sale And Customer Satisfaction. This is a three stage process. The stages in this process are Key Metrics, Key Performance Indicator, Kpi.
-
 Speed dial meter showing high performance icon
Presenting this set of slides with name Speed Dial Meter Showing High Performance Icon. This is a three stage process. The stages in this process are Speed Dial, Meter Showing, High, Performance Icon. This is a completely editable PowerPoint presentation and is available for immediate download. Download now and impress your audience.
-
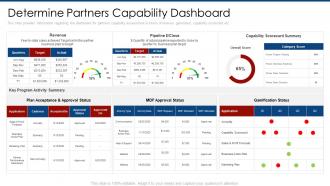 Determine partners capability dashboard partner marketing plan ppt summary
This slide provides information regarding the dashboard for partners capability assessment in terms of revenue generated, capability scorecard etc. Deliver an outstanding presentation on the topic using this Determine Partners Capability Dashboard Partner Marketing Plan Ppt Summary. Dispense information and present a thorough explanation of Revenue, Gamification Status, Approval Status using the slides given. This template can be altered and personalized to fit your needs. It is also available for immediate download. So grab it now.
-
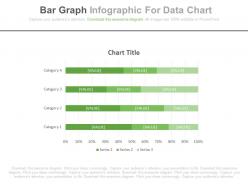 Bar graph infographics for data chart powerpoint slides
Presenting bar graph infographics for data chart powerpoint slides. This Power Point template slide has been crafted with graphic of bar graph info graphics and data chart. This PPT slide contains the concept of financial data analysis. Use this PPT slide for business and finance related presentations.
-
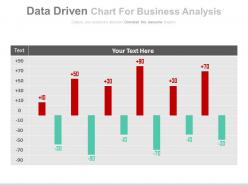 Data driven chart for business analysis powerpoint slides
Presenting data driven chart for business analysis powerpoint slides. This Power Point template slide has been crafted with graphic of data driven chart. This PPT slide contains the concept of business growth analysis. Use this PPT slide for business and finance related presentations.
-
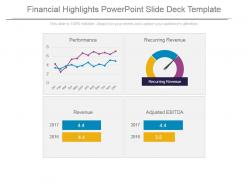 Financial highlights powerpoint slide deck template
Presenting financial highlights powerpoint slide deck template. This is a financial highlights powerpoint slide deck template. This is a four stage process. The stages in this process are performance, recurring revenue, revenue, adjusted ebitda.
-
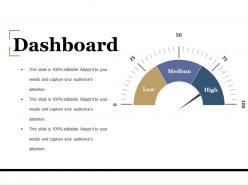 Dashboard powerpoint slide rules
Presenting dashboard powerpoint slide rules. This is a dashboard powerpoint slide rules. This is a three stage process. The stages in this process are business, marketing, strategy, planning, dashboard.
-
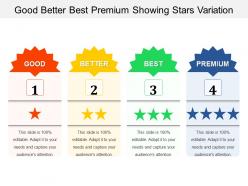 Good better best premium showing stars variation
Presenting this set of slides with name - Good Better Best Premium Showing Stars Variation. This is a four stage process. The stages in this process are Good Better Best, Good Great Superb, Good Great Excellent.
-
 Dashboard presentation examples
Presenting Dashboard Presentation Examples which is completely editable. You can easily download this template into various formats like PDF, PNG, and JPEG. This slide is compatible with Google Slides. You can make as many changes as you want on the slide without any complications. Access this slide in both 4:9 and 16:9 ratio.
-
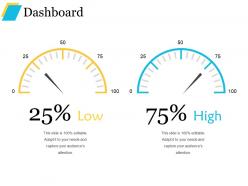 Dashboard powerpoint presentation templates
Presenting dashboard powerpoint presentation templates. This is a dashboard powerpoint presentation templates. This is a two stage process. The stages in this process are low, high, dashboard, technology, business.
-
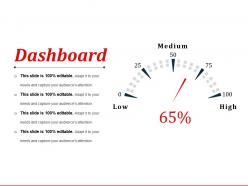 Dashboard powerpoint templates download
Presenting dashboard powerpoint templates download. This is a dashboard powerpoint templates download. This is a one stage process. The stages in this process are medium, low, high, dashboard.
-
 Organizational process performance measurement process transformation strategy performing
Presenting this set of slides with name - Organizational Process Performance Measurement Process Transformation Strategy Performing. This is an editable four stages graphic that deals with topics like Organizational Process, Performance Measurement, Process Transformation, Strategy Performing to help convey your message better graphically. This product is a premium product available for immediate download, and is 100 percent editable in Powerpoint. Download this now and use it in your presentations to impress your audience.
-
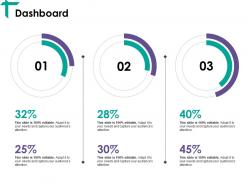 Dashboard Snapshot ppt visual aids gallery
Presenting this set of slides with name - Dashboard Snapshot Ppt Visual Aids Gallery. This is a three stage process. The stages in this process are Business, Marketing, Dashboard, Percentage, Strategy.
-
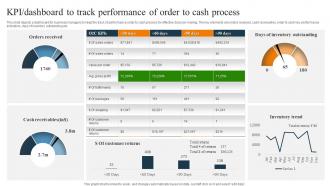 KPI Dashboard To Track Performance Of Order To Cash Process
This slide depicts a dashboard for business managers to keep the track of performance order to cash process for effective decision making. The key elements are orders received, cash receivables, order to cash key performance indicators, days of inventory outstanding etc. Introducing our KPI Dashboard To Track Performance Of Order To Cash Process set of slides. The topics discussed in these slides are Days Of Inventory Outstanding, Inventory Trend, Customer Returns. This is an immediately available PowerPoint presentation that can be conveniently customized. Download it and convince your audience.
-
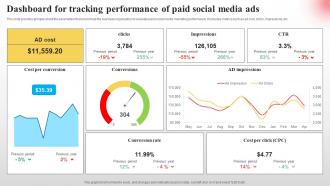 Dashboard For Tracking Performance Implementing Paid Social Media Advertising Strategies
This slide provides glimpse about the parameters that would help the business organization to evaluate paid social media marketing performance. It includes metrics such as ad cost, clicks, impressions, etc. Deliver an outstanding presentation on the topic using this Dashboard For Tracking Performance Implementing Paid Social Media Advertising Strategies. Dispense information and present a thorough explanation of Conversions, Impressions, Performance using the slides given. This template can be altered and personalized to fit your needs. It is also available for immediate download. So grab it now.
-
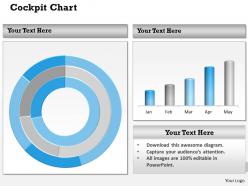 0314 dashboard design for business communication
We are proud to present our 0314 dashboard design for business communication. Our great team has conjured up a web of 0314 Dashboard Design For Business Communication. Use them to string together your glistening ideas. Think of it and be sure we have it. Our 0314 Dashboard Design For Business Communication offer you the widest possible range of options.
-
 5 cylinders column chart for market growth powerpoint templates
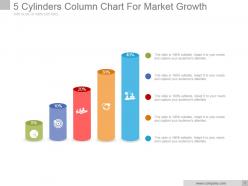
Presenting 5 cylinders column chart for market growth powerpoint templates. This is a 5 cylinders column chart for market growth powerpoint templates. This is a five stage process. The stages in this process are business, marketing, icons, growth, finance.
-
 Logistics dashboard showing single digital value arc indicator
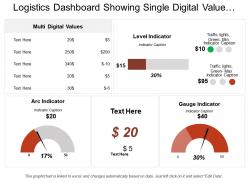
Presenting Logistics Dashboard Showing Single Digital Value Arc Indicator PPT slide. The sales growth digital value PowerPoint template designed professionally by the team of SlideTeam to present formulation as well as execution of business finance strategy. The different icons such as arc indicator, dot symbol and many other, as well as text in the sale growth dashboard slide. This slide is customizable in PowerPoint and can help you in sharing the values in digital format. The logistics digital dashboard slide is compatible with Google Slide. A user can make changes in the font size, font type, color and dimensions of the different icons to present the desired digital values.
-
 Product Advertising Performance Assessment Dashboard With Cost Per Conversion
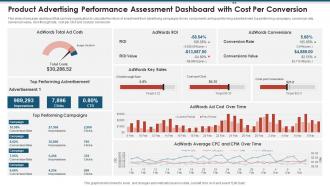
This slide showcases dashboard that can help organization to calculate the return of investment from advertising campaigns. Its key components are top performing advertisement, top performing campaigns, conversion rate, conversion value, click through rate, cost per click and cost per conversion. Presenting our well structured Product Advertising Performance Assessment Dashboard With Cost Per Conversion. The topics discussed in this slide are Product Advertising Performance Assessment Dashboard With Cost Per Conversion. This is an instantly available PowerPoint presentation that can be edited conveniently. Download it right away and captivate your audience.
-
 Mobile app for business people comparison powerpoint slides
Presenting mobile app for business people comparison powerpoint slides. This Power Point template diagram slide has been crafted with graphic of mobile app and business peoples. This PPT diagram contains the concept of business comparison representation. Use this PPT diagram for business and technology related presentations.
-
 Three stopwatches with percentage and icons powerpoint slides
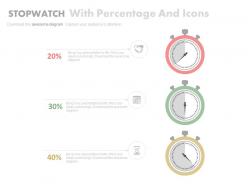
Presenting three stopwatches with percentage and icons powerpoint slides. This Power Point template diagram slide has been crafted with graphic of three stopwatches and percentage. This PPT diagram contains the concept of time management representation. Use this PPT diagram for business and finance related presentations.
-
 Dashboard low medium high ppt powerpoint presentation background images
Presenting this set of slides with name Dashboard Low Medium High Ppt Powerpoint Presentation Background Images. This is a three stage process. The stages in this process are Dashboard, Low, Medium, High. This is a completely editable PowerPoint presentation and is available for immediate download. Download now and impress your audience.
-
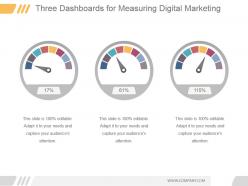 Three dashboards for measuring digital marketing ppt summary
Presenting three dashboards for measuring digital marketing ppt summary. This is a three dashboards for measuring digital marketing ppt summary. This is a three stage process. The stages in this process are dashboard, measuring, business, marketing, percentage.
-
 Trust meter icon for businessman and customer
Presenting this set of slides with name Trust Meter Icon For Businessman And Customer. This is a three stage process. The stages in this process are Trust Meter Icon For Businessman And Customer. This is a completely editable PowerPoint presentation and is available for immediate download. Download now and impress your audience.
-
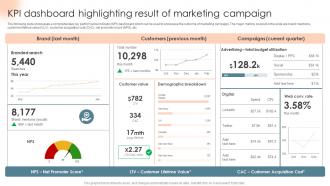 KPI Dashboard Highlighting Result Of Marketing Complete Introduction To Business Marketing MKT SS V
The following slide showcases a comprehensive key performance indicator KPI dashboard which can be used to showcase the outcome of marketing campaign. The major metrics covered in the slide are brand mentions, customer lifetime value CLV, customer acquisition cost CAC, net promoter score NPS, etc. Present the topic in a bit more detail with this KPI Dashboard Highlighting Result Of Marketing Complete Introduction To Business Marketing MKT SS V. Use it as a tool for discussion and navigation on Result, Marketing, Campaign. This template is free to edit as deemed fit for your organization. Therefore download it now.
-
 Four integrated steps for business communication powerpoint slides
Presenting four integrated steps for business communication powerpoint slides. This Power Point template slide has been crafted with graphic of four integrated steps. This PPT slide contains the concept of business communication. Use this PPT slide for business and marketing related presentations.
-
 KPI Compare Dashboard Depicting Sales Performance
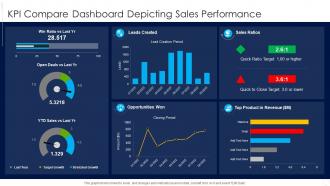
Presenting our well structured KPI Compare Dashboard Depicting Sales Performance. The topics discussed in this slide are Opportunities Won, Product In Revenue, Sales Ratios. This is an instantly available PowerPoint presentation that can be edited conveniently. Download it right away and captivate your audience.
-
 Stock Market Dashboard Highlighting Cash Flow And Profitability Analysis
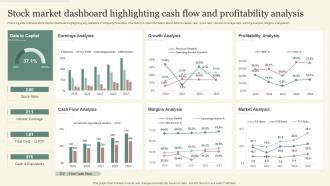
Following slide indicates stock market dashboard highlighting key statistics of company financials. This slide provides information about debt to capital ratio, quick ratio, interest coverage ratio, earning analysis, margins analysis etc. Presenting our well structured Stock Market Dashboard Highlighting Cash Flow And Profitability Analysis. The topics discussed in this slide are Earnings Analysis, Quick Ratio, Cash, Equivalents. This is an instantly available PowerPoint presentation that can be edited conveniently. Download it right away and captivate your audience.
-
 Three batteries with percentage analysis powerpoint slides
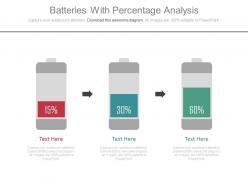
Presenting three batteries with percentage analysis powerpoint slides. This Power Point icon template slide has been crafted with graphic of three batteries and percentage . This icon PPT slide contains the concept of percentage analysis. Use this icon PPT slide for business and finance related presentations.
-
 Dashboard snapshot ppt file guidelines
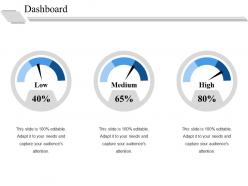
Presenting this set of slides with name - Dashboard Snapshot Ppt File Guidelines. This is a three stage process. The stages in this process are Dashboard, Low, Medium, High.
-
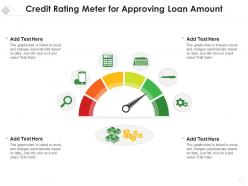 Credit rating meter for approving loan amount
Introducing our premium set of slides with Credit Rating Meter For Approving Loan Amount. Ellicudate the four stages and present information using this PPT slide. This is a completely adaptable PowerPoint template design that can be used to interpret topics like Credit Rating Meter For Approving Loan Amount. So download instantly and tailor it with your information.
-
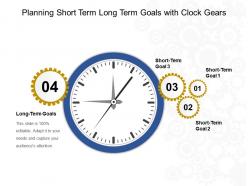 Planning short term long term goals with clock gears ppt template
Presenting planning short term long term goals with clock gears ppt template. This is a planning short term long term goals with clock gears ppt template. This is a four stage process. The stages in this process are short term plan, long term plan, 30 60 90 day plan.
-
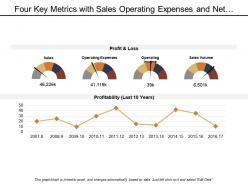 Four key metrics with sales operating expenses and net income
The design template can be downloaded on a single click from SlideTeam web page. Design can be saved as JPEG or PDF formats. Best advantage of this design template is that it’s completely editable; you can modify and customize the design template according to your business needs. The PowerPoint design is completely supported on standard and full screen view, no effect on design quality when opened on full screen view.
-
 Fuel gauge icons
Presenting this set of slides with name - Fuel Gauge Icons. This is a three stage process. The stages in this process are Fuel Gauge, Gas Gauge, Fuel Containers.
-
 Fuel gauge right arrow center oil machine
Presenting this set of slides with name - Fuel Gauge Right Arrow Center Oil Machine. This is a one stage process. The stages in this process are Fuel Gauge, Gas Gauge, Fuel Containers.
-
 Logistics dashboard with delivery on time and quarter to date
Presenting Logistics Dashboard With Delivery On Time And Quarter To Date PPT slide. The delivery on time dashboard PowerPoint template designed professionally by the team of SlideTeam to present the approximate delivery time to clients and investors as well. The different icons such as vehicle, dollar, speed meter and many other, as well as text in the quarter to date dashboard slide are customizable in PowerPoint and can help you in sharing the average time required for an order get ready and delivered. The logistics delivery dashboard slide is compatible with Google Slide. A user can make changes in the font size, font type, color and dimensions of the different icons to present the desired delivery time.
-
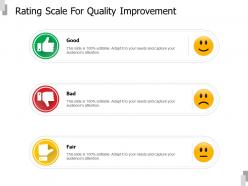 Rating scale for quality improvement
Presenting this set of slides with name Rating Scale For Quality Improvement. This is a three stage process. The stages in this process are Product Improvement, Rating Scale, Product Quality. This is a completely editable PowerPoint presentation and is available for immediate download. Download now and impress your audience.
-
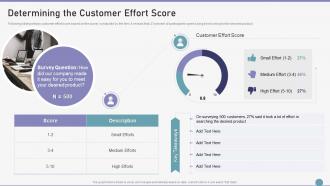 Customer Success Playbook Determining The Customer Effort Score
Following slide portrays customer effort score based on the survey conducted by the firm. It reveals that 27 percent of participants spent a long time looking for the desired product. Present the topic in a bit more detail with this Customer Success Playbook Determining The Customer Effort Score. Use it as a tool for discussion and navigation on Determining The Customer Effort Score. This template is free to edit as deemed fit for your organization. Therefore download it now.
-
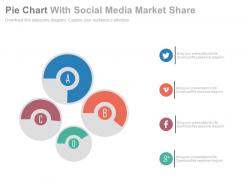 Four pie charts with social media market share powerpoint slides
Presenting four pie charts with social media market share powerpoint slides. This Power Point template slide has been crafted with graphic of four pie charts and social media icons. This PPT slide contains the concept of social media market share analysis. Use this PPT slide for business and finance related presentations.
-
 Sell through calculation diagram sample presentations
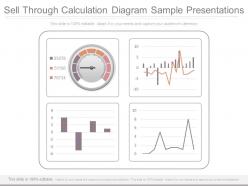
Presenting sell through calculation diagram sample presentations. This is a sell through calculation diagram sample presentations. This is a four stage process. The stages in this process are buiness, marketing, success, finance, management.
-
 Balanced scorecard strategic planning ppt example
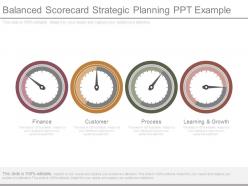
Presenting balanced scorecard strategic planning ppt example. This is a balanced scorecard strategic planning ppt example. This is a four stage process. The stages in this process are finance, customer, process, learning and growth.
-
 4 speedometers dashboard for project management good ppt example
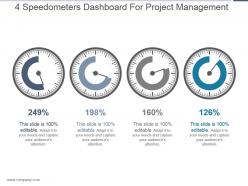
Presenting 4 speedometers dashboard for project management good ppt example. This is a 4 speedometers dashboard for project management good ppt example. This is a four stage process. The stages in this process are business, marketing, dashboard, measuring, management.
-
 Launch monitoring dashboard snapshot ppt design
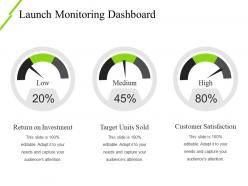
Presenting launch monitoring dashboard Snapshot ppt design. This is a launch monitoring dashboard ppt design. This is a three stage process. The stages in this process are return on investment, target units sold, customer satisfaction, low, medium, high.
-
 Dashboard powerpoint slide deck samples
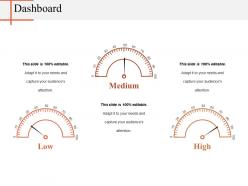
Presenting this set of slides with name - Dashboard Powerpoint Slide Deck Samples. This is a three stage process. The stages in this process are Dashboard, Strategy, Finance, Planning, Measure.
-
 Content Delivery Network It Performance As Pillar Of Cdn Design
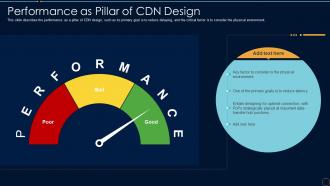
This slide describes the performance as a pillar of CDN design, such as its primary goal is to reduce delaying, and the critical factor is to consider the physical environment. Deliver an outstanding presentation on the topic using this Content Delivery Network It Performance As Pillar Of Cdn Design. Dispense information and present a thorough explanation of Performance As Pillar Of CDN Design using the slides given. This template can be altered and personalized to fit your needs. It is also available for immediate download. So grab it now.
-
 Agile Approach To Quality Assurance Effectiveness Tracking Dashboard Snapshot Ppt Topics
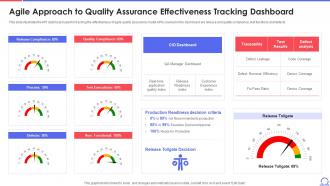
This slide illustrates the KPI dashboard used for tracking the effectiveness of agile quality assurance model. KPIs covered in the dashboard are release and quality compliance, test functions and defects. Present the topic in a bit more detail with this Agile Approach To Quality Assurance Effectiveness Tracking Dashboard Snapshot Ppt Topics. Use it as a tool for discussion and navigation on CIO Dashboard, Quality Compliance, Release Compliance, Non Functional. This template is free to edit as deemed fit for your organization. Therefore download it now.
-
 Financial Projections Audience Targeting Solution Investor Funding Elevator Pitch Deck
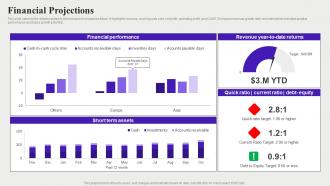
This slide caters to the details related to the forecast of companies future. It highlights revenue, cost of goods sold, net profit, operating profit, and CAGR Compound annual growth rate recorded which indicates positive performance and future growth potential. Deliver an outstanding presentation on the topic using this Financial Projections Audience Targeting Solution Investor Funding Elevator Pitch Deck. Dispense information and present a thorough explanation of This slide caters to the details related to the forecast of companies future. It highlights revenue, cost of goods sold, net profit, operating profit, and CAGR Compound annual growth rate recorded which indicates positive performance and future growth potential. using the slides given. This template can be altered and personalized to fit your needs. It is also available for immediate download. So grab it now.
-
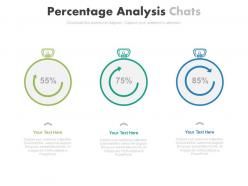 Three staged percentage analysis charts powerpoint slides
Presenting three staged percentage analysis charts powerpoint slides. This Power Point template slide has been crafted with graphic of five staged percentage chart. This PPT slide contains the concept of financial analysis. Use this PPT slide for business and finance related presentations.
-
 Kpi icons showing upward arrow percentage and comments
Presenting this set of slides with name - Kpi Icons Showing Upward Arrow Percentage And Comments. This is a four stage process. The stages in this process are Kpi Icon, Metircs Icon, Dashboard Icon.
-
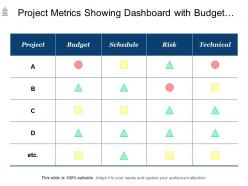 Project metrics showing dashboard with budget schedule risk
Presenting this set of slides with name - Project Metrics Showing Dashboard With Budget Schedule Risk. This is a four stage process. The stages in this process are Project Kpis, Project Dashboard, Project Metrics.
-
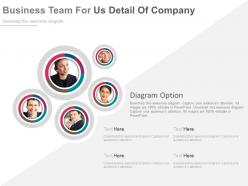 Business Team For About Us Detail Of Company Powerpoint Slides
Presenting business team for about us detail of company powerpoint slides. This Power Point template diagram slide has been crafted with graphic of business team. This PPT diagram contains the concept of business about us detail representation. Use this PPT diagram for business and finance related presentations.
-
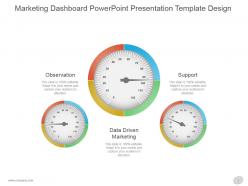 Marketing dashboard snapshot powerpoint presentation template design
Presenting marketing dashboard snapshot powerpoint presentation template design. This is a marketing dashboard powerpoint presentation template design. This is a three stage process. The stages in this process are observation, data driven marketing, support.
-
 Ticking clock icon with shopping cart
Presenting this set of slides with name Ticking Clock Icon With Shopping Cart. This is a one stage process. The stages in this process are Ticking Clock Icon With Shopping Cart. This is a completely editable PowerPoint presentation and is available for immediate download. Download now and impress your audience.
-
 Dashboard Snapshot ppt visual aids slides
Presenting this set of slides with name - Dashboard Snapshot Ppt Visual Aids Slides. This is a three stage process. The stages in this process are Dashboard, Meter, Speed, Measure, Planning.
-
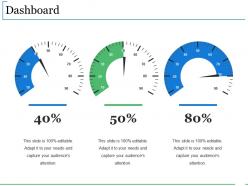 Dashboard snapshot ppt background designs
Presenting this set of slides with name - Dashboard Snapshot Ppt Background Designs. This is a three stage process. The stages in this process are Dashboard, Marketing, Strategy, Planning, Speed.
-
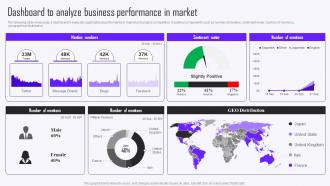 Dashboard To Analyze Business Performance In Market Guide To Market Intelligence Tools MKT SS V
The following slide showcases a dashboard to evaluate organizational performance in market and analyze competition. It outlines components such as number of mention, sentiment meter, number of mentions, geographical distribution. Present the topic in a bit more detail with this Dashboard To Analyze Business Performance In Market Guide To Market Intelligence Tools MKT SS V. Use it as a tool for discussion and navigation on Analyze, Performance, Market. This template is free to edit as deemed fit for your organization. Therefore download it now.
-
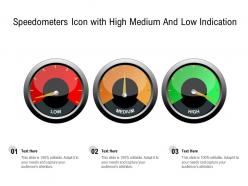 Speedometers icon with high medium and low indication
Presenting this set of slides with name Speedometers Icon With High Medium And Low Indication. This is a three stage process. The stages in this process are Speedometers Icon, High Medium, Low Indication. This is a completely editable PowerPoint presentation and is available for immediate download. Download now and impress your audience.
-
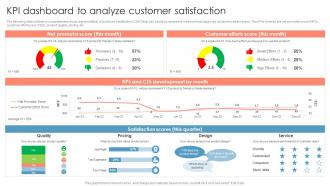 KPI Dashboard To Analyze Customer Satisfaction Measuring Brand Awareness Through Market Research
The following slide outlines a comprehensive visual representation of customer satisfaction CSAT that can assist companies to measure how happy are customers wit the brand. The KPIs covered are net promoter score NPS, customer effort score CES, product quality, pricing, etc. Present the topic in a bit more detail with this KPI Dashboard To Analyze Customer Satisfaction Measuring Brand Awareness Through Market Research. Use it as a tool for discussion and navigation on Analyze, Customer, Satisfaction. This template is free to edit as deemed fit for your organization. Therefore download it now.
-
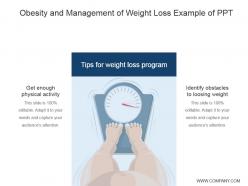 Obesity and management of weight loss example of ppt
Presenting obesity and management of weight loss example of ppt. This is a obesity and management of weight loss example of ppt. This is a two stage process. The stages in this process are get enough physical activity, identify obstacles to loosing weight, tips for weight loss program.


