Financials PowerPoint Templates, Financial Statement PPT Templates
- Sub Categories
-
- 30 60 90 Day Plan
- About Us Company Details
- Action Plan
- Agenda
- Annual Report
- Audit Reports
- Balance Scorecard
- Brand Equity
- Business Case Study
- Business Communication Skills
- Business Plan Development
- Business Problem Solving
- Business Review
- Capital Budgeting
- Career Planning
- Change Management
- Color Palettes
- Communication Process
- Company Location
- Company Vision
- Compare
- Competitive Analysis
- Corporate Governance
- Cost Reduction Strategies
- Custom Business Slides
- Customer Service
- Dashboard
- Data Management
- Decision Making
- Digital Marketing Strategy
- Digital Transformation
- Disaster Management
- Diversity
- Equity Investment
- Financial Analysis
- Financial Services
- Financials
- Growth Hacking Strategy
- Human Resource Management
- Innovation Management
- Interview Process
- Knowledge Management
- Leadership
- Lean Manufacturing
- Legal Law Order
- Management
- Market Segmentation
- Marketing
- Media and Communication
- Meeting Planner
- Mergers and Acquisitions
- Metaverse
- Newspapers
- Operations and Logistics
- Organizational Structure
- Our Goals
- Performance Management
- Pitch Decks
- Pricing Strategies
- Process Management
- Product Development
- Product Launch Ideas
- Product Portfolio
- Project Management
- Purchasing Process
- Quality Assurance
- Quotes and Testimonials
- Real Estate
- Risk Management
- Sales Performance Plan
- Sales Review
- SEO
- Service Offering
- Six Sigma
- Social Media and Network
- Software Development
- Solution Architecture
- Stock Portfolio
- Strategic Management
- Strategic Planning
- Supply Chain Management
- Swimlanes
- System Architecture
- Team Introduction
- Testing and Validation
- Thanks-FAQ
- Time Management
- Timelines Roadmaps
- Value Chain Analysis
- Value Stream Mapping
- Workplace Ethic
-
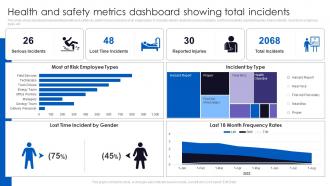 Health And Safety Metrics Dashboard Showing Total Incidents
This slide shows dashboard representing health and safety key performance indicators of an organization. It includes details related to serious incidents, lost time incidents, reported injuries, total incidents, most at risk employee types etc. Introducing our Health And Safety Metrics Dashboard Showing Total Incidents set of slides. The topics discussed in these slides are Health And Safety, Metrics Dashboard, Total Incidents. This is an immediately available PowerPoint presentation that can be conveniently customized. Download it and convince your audience.
-
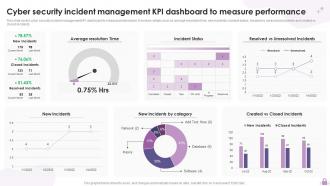 Cyber Security Incident Management KPI Dashboard To Measure Performance
This slide covers cyber security incident management KPI dashboard to measure performance. It involves details such as average resolution time, new incidents, incident status, resolved vs unresolved incidents and created vs closed incidents. Introducing our Cyber Security Incident Management KPI Dashboard To Measure Performance set of slides. The topics discussed in these slides are Cyber Security, Incident Management, KPI Dashboard, Measure Performance. This is an immediately available PowerPoint presentation that can be conveniently customized. Download it and convince your audience.
-
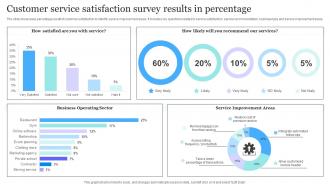 Customer Service Satisfaction Survey Results In Percentage
The slide showcases percentage result of customer satisfaction to identify service improvement areas. It includes key questions related to service satisfaction, service recommendation, business type and service improvement areas. Introducing our Customer Service Satisfaction Survey Results In Percentage set of slides. The topics discussed in these slides are Customer, Service, Results. This is an immediately available PowerPoint presentation that can be conveniently customized. Download it and convince your audience.
-
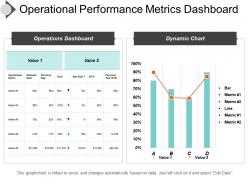 Operational performance metrics dashboard ppt summary
Presenting operational performance metrics dashboard ppt summary. This is a operational performance metrics dashboard ppt summary. This is a two stage process. The stages in this process are operational performance metrics, operational performance dashboard, operational performance kpis.
-
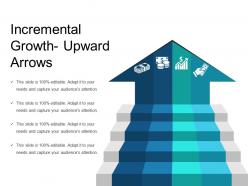 Incremental growth upward arrows
Presenting incremental growth upward arrows. This is a incremental growth upward arrows. This is a four stage process. The stages in this process are incremental growth, business growth, revenue increment.
-
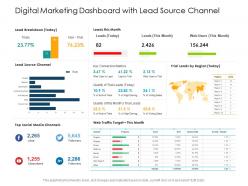 Digital marketing dashboard with lead source channel
Presenting this set of slides with name Digital Marketing Dashboard With Lead Source Channel. The topics discussed in these slides are Metrics, Web Traffic, Target. This is a completely editable PowerPoint presentation and is available for immediate download. Download now and impress your audience.
-
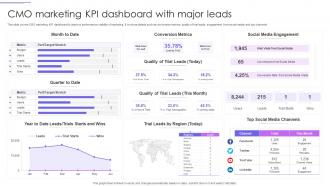 CMO Marketing KPI Dashboard With Major Leads
This slide covers CMO marketing KPI dashboard to improve performance visibility of marketing. It involves details such as conversion metrics, quality of trial leads, engagement from social media and top channels. Introducing our CMO Marketing KPI Dashboard With Major Leads set of slides. The topics discussed in these slides are Conversion Metrics, Social Media Engagement, Trial Leads. This is an immediately available PowerPoint presentation that can be conveniently customized. Download it and convince your audience.
-
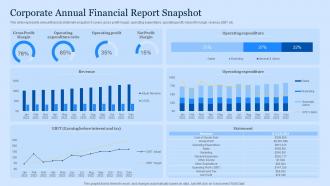 Corporate Annual Financial Report Snapshot
This slide represents annual financial statement snapshot. It covers gross profit margin, operating expenditure, operating profit, net profit margin, revenue, EBIT etc. Presenting our well structured Corporate Annual Financial Report Snapshot. The topics discussed in this slide are Gross Profit Margin, Operating Expenditure Ratio, Operating Profit. This is an instantly available PowerPoint presentation that can be edited conveniently. Download it right away and captivate your audience.
-
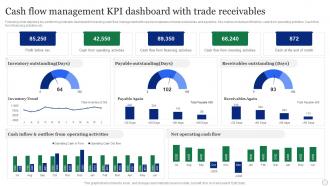 Cash Flow Management KPI Dashboard With Trade Receivables
Following slide depicts a key performing indicator dashboard for tracking cash flow management with special emphasis on trade receivables and payables. Key metrics include profit before, cash from operating activities, Cash flow from financing activities etc. Introducing our Cash Flow Management KPI Dashboard With Trade Receivables set of slides. The topics discussed in these slides are Inventory Outstanding, Payable Outstanding, Receivables Outstanding. This is an immediately available PowerPoint presentation that can be conveniently customized. Download it and convince your audience.
-
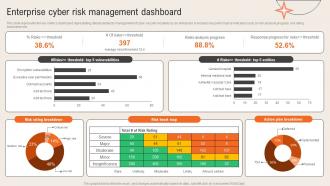 Enterprise Cyber Risk Management Dashboard Deploying Computer Security Incident Management
This slide represents the key metrics dashboard representing details related to management of cyber security incidents by an enterprise. It includes key performance indicators such as risk analysis progress, risk rating breakdown etc.Present the topic in a bit more detail with this Enterprise Cyber Risk Management Dashboard Deploying Computer Security Incident Management. Use it as a tool for discussion and navigation on Risks Analysis Progress, Response Progress, Action Plan Breakdown. This template is free to edit as deemed fit for your organization. Therefore download it now.
-
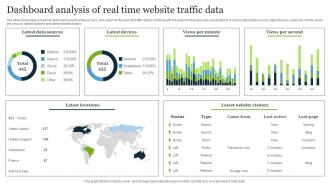 Dashboard Analysis Of Real Time Website Traffic Data
The slide showcases a real time dashboard used to analyse, track, and report on the website traffic data in real time with the help of interactive data visualizations. It covers latest data sources, latest devices, views per minute, views per second, latest locations and latest website visitors. Introducing our Dashboard Analysis Of Real Time Website Traffic Data set of slides. The topics discussed in these slides are Latest Devices, Views Per Minute, Dashboard Analysis. This is an immediately available PowerPoint presentation that can be conveniently customized. Download it and convince your audience.
-
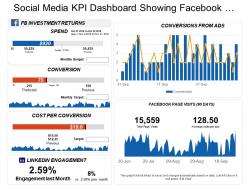 Social media kpi dashboard showing facebook investment returns conversion from ads
Presenting this set of slides with name - Social Media Kpi Dashboard Showing Facebook Investment Returns Conversion From Ads. This is a five stage process. The stages in this process are Social Media, Digital Marketing, Social Marketing.
-
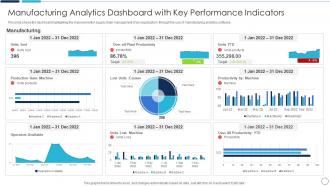 Manufacturing Analytics Dashboard With Key Performance Indicators
This slide shows the dashboard highlighting the improvement in supply chain management of an organization through the use of manufacturing analytics software. Presenting our well structured Manufacturing Analytics Dashboard With Key Performance Indicators. The topics discussed in this slide are Productivity, Manufacturing, Performance. This is an instantly available PowerPoint presentation that can be edited conveniently. Download it right away and captivate your audience.
-
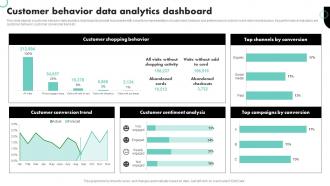 Customer Behavior Data Analytics Dashboard
This slide depicts a customer behavior data analytics dashboard to provide businesses with a real time representation of customers behavior and preferences in order to make informed decisions. Key performance indicators are customer behavior, customer conversion trend etc.Presenting our well structured Customer Behavior Data Analytics Dashboard. The topics discussed in this slide are Customer conversion, Customer sentiment, campaigns conversion. This is an instantly available PowerPoint presentation that can be edited conveniently. Download it right away and captivate your audience.
-
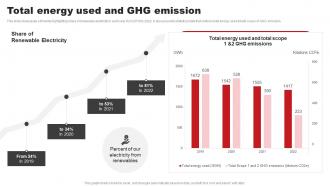 Total Energy Used And Ghg Emission ABB Company Profile CP SS
This slide showcases a timeline highlighting share of renewable electricity in each year from 2019 to 2022. It also presents statistical data that outlines total energy used and total scope of GHG emission. Present the topic in a bit more detail with this Total Energy Used And Ghg Emission ABB Company Profile CP SS. Use it as a tool for discussion and navigation on Share Renewable Electricity, Percent Our, Electricity Renewables. This template is free to edit as deemed fit for your organization. Therefore download it now.
-
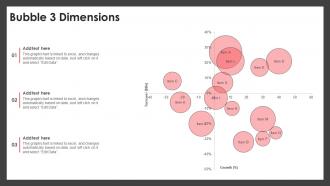 Bubble 3 Dimensions PU CHART SS
Introducing our Bubble 3 Dimensions PU CHART SS set of slides. The topics discussed in these slides are Bubbles 4 Dimensions. This is an immediately available PowerPoint presentation that can be conveniently customized. Download it and convince your audience.
-
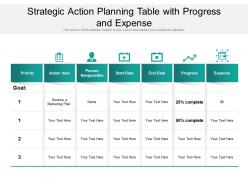 Strategic action planning table with progress and expense
Presenting this set of slides with name Strategic Action Planning Table With Progress And Expense. The topics discussed in these slides are Priority, Action Item, Person Responsible, Progress, Expense, Start Date, End Date. This is a completely editable PowerPoint presentation and is available for immediate download. Download now and impress your audience.
-
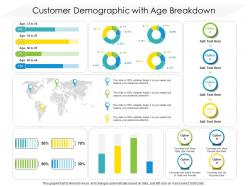 Customer demographic with age breakdown
Presenting this set of slides with name Customer Demographic With Age Breakdown. The topics discussed in these slide is Customer Demographic With Age Breakdown. This is a completely editable PowerPoint presentation and is available for immediate download. Download now and impress your audience.
-
 Use of funds slide pitch deck ppt template
Provide your investors essential insights into your project and company with this influential Use Of Funds Slide Pitch Deck Ppt Template. This is an in-depth pitch deck PPT template that covers all the extensive information and statistics of your organization. From revenue models to basic statistics, there are unique charts and graphs added to make your presentation more informative and strategically advanced. This gives you a competitive edge and ample amount of space to showcase your brands USP. Apart from this, all the thirty slides added to this deck, helps provide a breakdown of various facets and key fundamentals. Including the history of your company, marketing strategies, traction, etc. The biggest advantage of this template is that it is pliable to any business domain be it e-commerce, IT revolution, etc, to introduce a new product or bring changes to the existing one. Therefore, download this complete deck now in the form of PNG, JPG, or PDF.
-
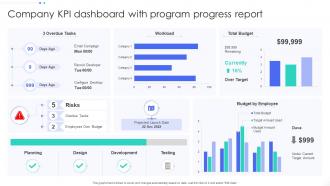 Company KPI Dashboard Snapshot With Program Progress Report
This graph or chart is linked to excel, and changes automatically based on data. Just left click on it and select Edit Data. Introducing our Company KPI Dashboard Snapshot With Program Progress Report set of slides. The topics discussed in these slides are 3 Overdue Tasks, Total Budget, Budget By Employee. This is an immediately available PowerPoint presentation that can be conveniently customized. Download it and convince your audience.
-
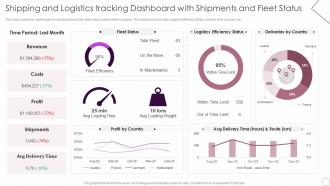 Logistics Automation Systems Shipping And Logistics Tracking Dashboard With Shipments
This slide covers Key performance indicators to track the automation system of the company. This dashboard includes Logistics Efficiency Status, delivery time accuracy etc. Present the topic in a bit more detail with this Logistics Automation Systems Shipping And Logistics Tracking Dashboard With Shipments. Use it as a tool for discussion and navigation on Revenue, Profit, Costs, Shipments. This template is free to edit as deemed fit for your organization. Therefore download it now.
-
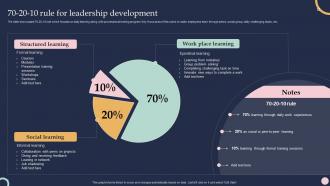 70 20 10 Rule For Leadership Development Training And Development Program To Efficiency
The slide showcases 70-20-10 rule which focuses on daily learning along with processional training program. Key focus area of this rule is to make employees learn through peers, social group, daily challenging tasks, etc. Deliver an outstanding presentation on the topic using this 70 20 10 Rule For Leadership Development Training And Development Program To Efficiency. Dispense information and present a thorough explanation of Structured Learning, Work Place Learning, Social Learning using the slides given. This template can be altered and personalized to fit your needs. It is also available for immediate download. So grab it now.
-
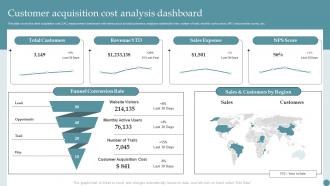 Q932 Customer Acquisition Cost Analysis Dashboard Consumer Acquisition Techniques With CAC
This slide covers the client acquisition cost CAC measurement dashboard with metrics such as total customers, employee satisfaction rate, number of trials, monthly active users, NPS net promoter score, etc. Deliver an outstanding presentation on the topic using this Q932 Customer Acquisition Cost Analysis Dashboard Consumer Acquisition Techniques With CAC. Dispense information and present a thorough explanation of Funnel Conversion Rate, Total Customers, Sales Expense using the slides given. This template can be altered and personalized to fit your needs. It is also available for immediate download. So grab it now.
-
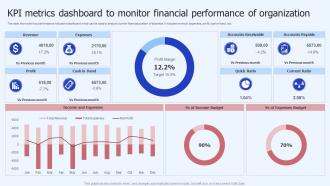 KPI Metrics Dashboard To Monitor Financial Performance Of Organization
This slide shows the key performance indicators dashboard which can be used to analyze current financial position of business. It includes revenue, expenses, profit, cash in hand, etc. Presenting our well structured KPI Metrics Dashboard To Monitor Financial Performance Of Organization. The topics discussed in this slide are Monitor Financial, Performance Organization. This is an instantly available PowerPoint presentation that can be edited conveniently. Download it right away and captivate your audience.
-
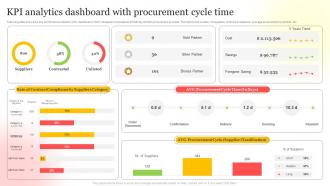 Kpi Analytics Dashboard With Procurement Cycle Time
Following slide shows the key performance indicator KPI dashboard which will assist corporates to effectively monitor procurement process. The metrics are number of suppliers, contract compliance, average procurement cycle time, etc. Introducing our Kpi Analytics Dashboard With Procurement Cycle Time set of slides. The topics discussed in these slides are Analytics, Dashboard, Procurement. This is an immediately available PowerPoint presentation that can be conveniently customized. Download it and convince your audience.
-
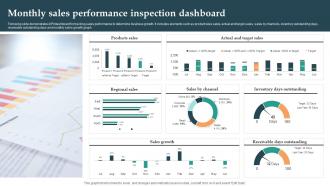 Monthly Sales Performance Inspection Dashboard
Following slide demonstrates KPI dashboard for tracking sales performance to determine business growth. It includes elements such as product wise sales, actual and target sales, sales by channels, inventory outstanding days, receivable outstanding days and monthly sales growth graph.Introducing our Monthly Sales Performance Inspection Dashboard set of slides. The topics discussed in these slides are Products Sales, Sales Growth, Receivable Outstanding. This is an immediately available PowerPoint presentation that can be conveniently customized. Download it and convince your audience.
-
 Corporate Event Expense And Revenue Budget Charts
This slide represents various budget charts of event revenue and high expense. It further includes reasons for increase in major expenses such as audio visual team asked for more compenation, etc Introducing our Corporate Event Expense And Revenue Budget Charts set of slides. The topics discussed in these slides are Event, Expense, Revenue. This is an immediately available PowerPoint presentation that can be conveniently customized. Download it and convince your audience.
-
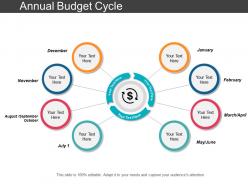 Annual budget cycle
Presenting this Annual Budget Cycle PowerPoint presentation. Include charts and graphs for a better representation of facts and figures. The PPT supports the standard (4:3) and widescreen (16:9) sizes. It is also compatible with Google Slides. Save this into various images or document formats like JPEG, PNG or PDF. High-quality graphics ensure that quality is always retained.
-
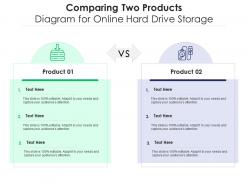 Comparing two products diagram for online hard drive storage infographic template
This is our Comparing Two Products Diagram For Online Hard Drive Storage Infographic Template designed in PowerPoint, however, you can also access it in Google Slides. It comes in two aspect ratios standard and widescreen, with fully editable visual content.
-
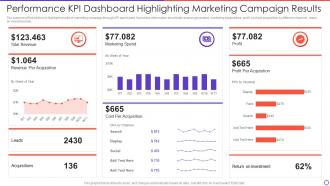 Performance Kpi Dashboard Highlighting Marketing Campaign Results
The purpose of this slide is to highlight results of marketing campaign through KPI dashboard. It provides information about total revenue generated, marketing expenditure, profit, cost per acquisition by different channels, return on investment etc. Presenting our well-structured Performance Kpi Dashboard Highlighting Marketing Campaign Results. The topics discussed in this slide are Performance, Dashboard, Highlighting, Marketing. This is an instantly available PowerPoint presentation that can be edited conveniently. Download it right away and captivate your audience.
-
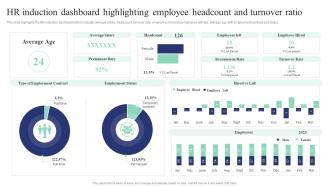 Corporate Induction Program For New Staff Hr Induction Dashboard Highlighting Employee Headcount Turnover
This slide highlights the HR induction dashboard which includes average salary, headcount, turnover rate, employees hired and employees left rate, average age with employment contract and status. Present the topic in a bit more detail with this Corporate Induction Program For New Staff Hr Induction Dashboard Highlighting Employee Headcount Turnover. Use it as a tool for discussion and navigation on Dashboard, Highlighting, Turnover Ratio. This template is free to edit as deemed fit for your organization. Therefore download it now.
-
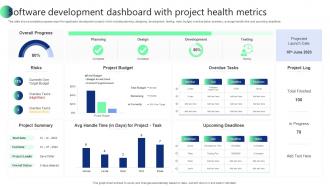 Software Development Dashboard With Project Health Metrics
This slide shows complete progress report for application development project which includes planning, designing, development, testing, risks, budget, overdue tasks, summery, average handle time and upcoming deadlines. Presenting our well structured Software Development Dashboard With Project Health Metrics. The topics discussed in this slide are Dashboard, Software, Development. This is an instantly available PowerPoint presentation that can be edited conveniently. Download it right away and captivate your audience.
-
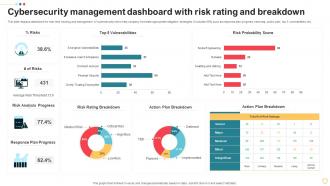 Cybersecurity Management Dashboard With Risk Rating And Breakdown
This slide displays dashboard for real- time tracking and management of cybersecurity risk to help company formulate appropriate mitigation strategies. It includes KPIs such as response plan progress, heat map, action plan, top 5 vulnerabilities, etc. Introducing our Cybersecurity Management Dashboard With Risk Rating And Breakdown set of slides. The topics discussed in these slides are Cybersecurity, Management, Dashboard. This is an immediately available PowerPoint presentation that can be conveniently customized. Download it and convince your audience.
-
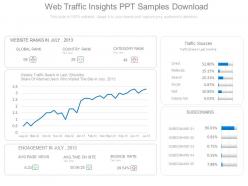 Web traffic insights ppt samples download
SlideTeam presents to you this beautifully designed web traffic insights PPT sample download. You can make a number of changes to the given prepared slides, as they are totally customizable. All you have to do is follow instructions given in the sample PPT. The slideshow can be viewed in standard size display ratio of 4:3 or widescreen display ratio of 16:9. The presentation is also compatible with Google Slides. The business template can be conveniently saved in format of PDF or JPG.
-
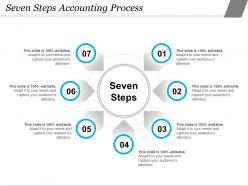 Seven steps accounting process
Presenting this set of slides with name - Seven Steps Accounting Process. This is a seven stage process. The stages in this process are Accounting Process, Accounting Cycle, Accounting Management.
-
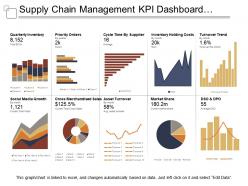 Supply chain management kpi dashboard showing quarterly inventory and asset turnover
Presenting this set of slides with name - Supply Chain Management Kpi Dashboard Showing Quarterly Inventory And Asset Turnover. This is a ten stage process. The stages in this process are Demand Forecasting, Predicting Future Demand, Supply Chain Management.
-
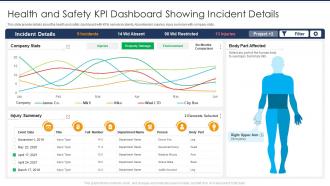 Health and safety kpi dashboard showing incident details
Presenting our well structured Health And Safety KPI Dashboard Showing Incident Details. The topics discussed in this slide are Envinronment, Project. This is an instantly available PowerPoint presentation that can be edited conveniently. Download it right away and captivate your audience.
-
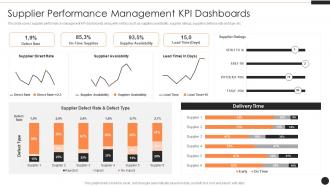 Supplier Performance Management KPI Dashboards Ppt Powerpoint Presentation Layouts
This slide covers supplier performance management KPI dashboards along with metrics such as suppliers availability, supplier ratings, suppliers defence rate and type etc. Present the topic in a bit more detail with this Supplier Performance Management KPI Dashboards Ppt Powerpoint Presentation Layouts. Use it as a tool for discussion and navigation on Supplier Ratings, Supplier Availability, Supplier Direct Rate. This template is free to edit as deemed fit for your organization. Therefore download it now.
-
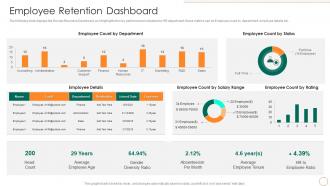 Employee Retention Dashboard Strategic Human Resource Retention Management
The following slide displays the Human Resource Dashboard, as it highlights the key performance indicators for HR department, these metrics can be Employee count by department, employee details etc.Present the topic in a bit more detail with this Employee Retention Dashboard Strategic Human Resource Retention Management Use it as a tool for discussion and navigation on Average Employee, Gender Diversity, Department This template is free to edit as deemed fit for your organization. Therefore download it now.
-
 Organization Key Metrics Report By Human Resource Team
This slide represents the dashboard showing the organizations financial health report prepared by the human resource department of the organization. It includes information related to sales, gross, operating and net profit, income statement, actual v s target sales, net operating cash etc. of the organization. Introducing our Organization Key Metrics Report By Human Resource Team set of slides. The topics discussed in these slides are Product, Category, Income Statement. This is an immediately available PowerPoint presentation that can be conveniently customized. Download it and convince your audience.
-
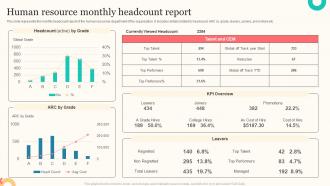 Human Resource Monthly Headcount Report
This slide represents the monthly headcount report of the human resources department of the organization. It includes details related to headcount, ARC by grade, leavers, joiners, promotions etc. Presenting our well structured Human Resource Monthly Headcount Report. The topics discussed in this slide are Human Resource, Monthly Headcount Report, Currently Viewed Headcount. This is an instantly available PowerPoint presentation that can be edited conveniently. Download it right away and captivate your audience.
-
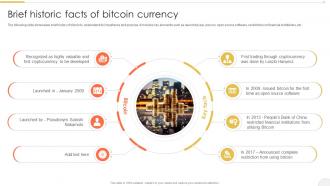 Brief Historic Facts Comprehensive Bitcoin Guide To Boost Cryptocurrency BCT SS
The following slide showcases brief history of bitcoin to understand its importance and purpose. It includes key elements such as launched year, person, open source software, restrictions on financial institutions, etc.Introducing Brief Historic Facts Comprehensive Bitcoin Guide To Boost Cryptocurrency BCT SS to increase your presentation threshold. Encompassed with eight stages, this template is a great option to educate and entice your audience. Dispence information on Financial Institutions, Bitcoin, Source Software, using this template. Grab it now to reap its full benefits.
-
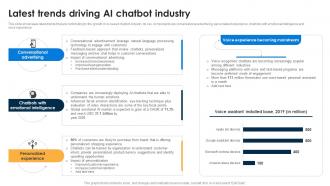 Latest Trends Driving AI Chatbot AI Chatbots For Business Transforming Customer Support Function AI SS V
This slide showcases latest trends that are contributing to the growth of AI-based chatbot industry. Its key components are conversational advertising, personalized experience, chatbots with emotional intelligence and voice experience. Present the topic in a bit more detail with this Latest Trends Driving AI Chatbot AI Chatbots For Business Transforming Customer Support Function AI SS V. Use it as a tool for discussion and navigation on Conversational Advertising, Emotional Intelligence, Personalized Experience. This template is free to edit as deemed fit for your organization. Therefore download it now.
-
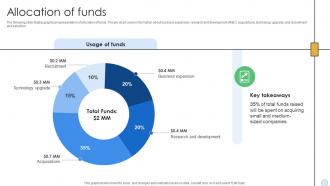 Allocation Of Funds Capital Raising Pitch Deck For Multi Sector Enterprise
The following slide display graphical representation of allocation of funds. The pie chart covers information about business expansion, research and development R and D, acquisitions, technology upgrade, and recruitment and selection. Present the topic in a bit more detail with this Allocation Of Funds Capital Raising Pitch Deck For Multi Sector Enterprise. Use it as a tool for discussion and navigation on Technology Upgrade, Acquisations, Research And Development. This template is free to edit as deemed fit for your organization. Therefore download it now.
-
 Problem Statement Capital Raising Pitch Deck For Multi Sector Enterprise
The following slide outlines various problems faced by our target segment. It covers information about industries consuming significant amount of carbon footprint, inefficient patient care, etc. Increase audience engagement and knowledge by dispensing information using Problem Statement Capital Raising Pitch Deck For Multi Sector Enterprise. This template helps you present information on three stages. You can also present information on Carbon Footprint, Consume Significant, Operational Safety using this PPT design. This layout is completely editable so personaize it now to meet your audiences expectations.
-
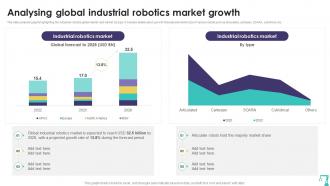 Analysing Global Industrial Precision Automation Industrial Robotics Technology RB SS
This slide presents graphs highlighting the industrial robotics global market and market by type. It includes details about growth forecast and market size of various robots such as articulated, cartesian, SCARA, cylindrical, etc. Deliver an outstanding presentation on the topic using this Analysing Global Industrial Precision Automation Industrial Robotics Technology RB SS. Dispense information and present a thorough explanation of Global Industrial, Robotics Market, Growth Rate using the slides given. This template can be altered and personalized to fit your needs. It is also available for immediate download. So grab it now.
-
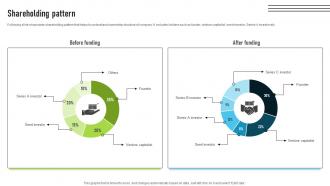 Shareholding Pattern Corporate Integration Software Pitch Deck To Increase Productivity
Following slide showcases shareholding pattern that helps to understand ownership structure of company. It includes holders such as funder, venture capitalist, seed investor, Series A investor etc. Deliver an outstanding presentation on the topic using this Shareholding Pattern Corporate Integration Software Pitch Deck To Increase Productivity. Dispense information and present a thorough explanation of Shareholding Pattern, Seed Investor, Venture Capitalist using the slides given. This template can be altered and personalized to fit your needs. It is also available for immediate download. So grab it now.
-
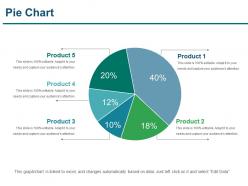 Pie chart powerpoint slide inspiration
Presenting pie chart powerpoint slide inspiration. This is a pie chart powerpoint slide inspiration . This is a five stage process. The stages in this process are pie chart, finance, marketing, strategy, analysis, business.
-
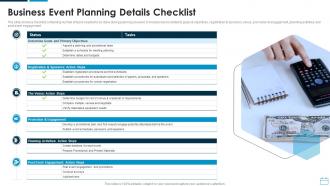 Business Event Planning Details Checklist
The slide shows a checklist containing number of tasks needed to be done during planning an event. It includes tasks related to goals and objectives, registration and sponsors, venue, promotion and engagement, planning activities and post event engagement. Presenting our set of slides with Business Event Planning Details Checklist. This exhibits information on six stages of the process. This is an easy to edit and innovatively designed PowerPoint template. So download immediately and highlight information on Registration And Sponsors, Action Steps, Promotion And Engagement, Post Event Engagement, Action Steps.
-
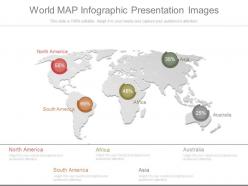 World map infographic presentation images
Presenting world map infographic presentation images. This is a world map infographic presentation images. This is a five stage process. The stages in this process are north america, south america, africa, asia, australia.
-
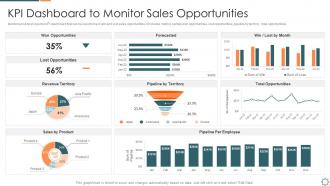 Introducing a new sales enablement kpi dashboard to monitor sales opportunities
Mentioned slide shows the KPI dashboard that can be used to track win and lost sales opportunities. It includes metrics namely won opportunities, lost opportunities, pipeline by territory, total opportunities. Deliver an outstanding presentation on the topic using this Introducing A New Sales Enablement Kpi Dashboard To Monitor Sales Opportunities. Dispense information and present a thorough explanation of KPI Dashboard To Monitor Sales Opportunities using the slides given. This template can be altered and personalized to fit your needs. It is also available for immediate download. So grab it now.
-
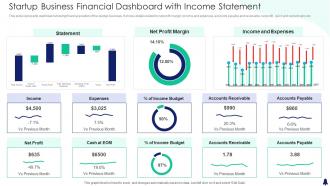 Startup Business Financial Dashboard Snapshot With Income Statement
This slide represents dashboard showing financial position of the startup business. It shows details related to net profit margin, income and expenses, accounts payable and receivable, net profit, quick and current ratio etc. Introducing our Startup Business Financial Dashboard Snapshot With Income Statement set of slides. The topics discussed in these slides are Statement, Net Profit Margin, Income and Expenses, Income Expenses . This is an immediately available PowerPoint presentation that can be conveniently customized. Download it and convince your audience.
-
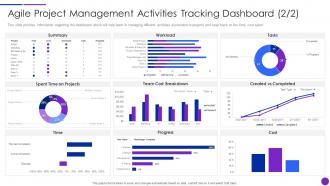 Lean Agile Project Management Playbook Agile Project Management Activities
This slide provides information regarding the dashboard which will help team in managing different activities associated to projects and keep track on the time, cost spent. Deliver an outstanding presentation on the topic using this Lean Agile Project Management Playbook Agile Project Management Activities. Dispense information and present a thorough explanation of Team Cost Breakdown, Progress, Time, Cost using the slides given. This template can be altered and personalized to fit your needs. It is also available for immediate download. So grab it now.
-
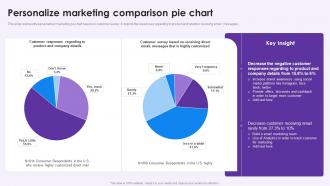 Personalize Marketing Comparison Pie Chart
This slide represents personalized marketing pie chart based on customer survey. It depicts the responses regarding to product and whether receiving email, messages. Introducing our Personalize Marketing Comparison Pie Chart set of slides. The topics discussed in these slides are Personalize Marketing, Comparison Pie Chart. This is an immediately available PowerPoint presentation that can be conveniently customized. Download it and convince your audience.
-
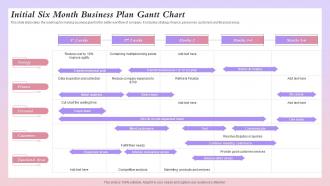 Initial Six Month Business Plan Gantt Chart
This slide elaborates the roadmap for making business plan for the better workflow of company. It includes strategy, finance, personnel, customers and financial areas. Elucidate your project plan using our Initial Six Month Business Plan Gantt Chart. Capture the timeframe for every release by outlining crucial details like project beginning and end date,status, and assigned team. Establish coordination with other team members share your product plans, and discuss the project progress with the executives using this template. Furthermore, this task management chart helps you align your activities efficiently. Utilize the versatile nature of this template to initiate high-level resource planning and implement it flexibly for the benefit of your business. The slide is easy-to-edit so download it and schedule your projects resourcefully.
-
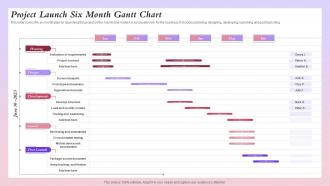 Project Launch Six Month Gantt Chart
This slide covers the six month plan for launching the project on the market and make it a successful one for the business. It includes planning, designing, developing, launching and post launching. Design a highly optimized project management report using this well-researched Project Launch Six Month Gantt Chart. This layout can be used to present the professional details of a task or activity. Showcase the activities allocated to the business executives with this Gantt Chart PowerPoint theme. List down the column tasks in various timeframes and allocate time for each. In addition, also monitor the actual time and make comparisons to interpret the final progress using this innovative Gantt Chart Template. Showcase the work breakdown structure to attract your audience. Download and share it using Google Slides, if it suits your requirement.
-
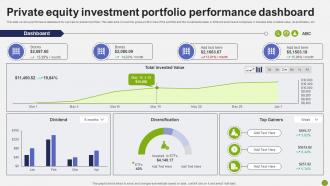 Private Equity Investment Portfolio Performance Dashboard
Introducing our Private Equity Investment Portfolio Performance Dashboard set of slides. The topics discussed in these slides are Diversification, Dividend, Top Gainers This is an immediately available PowerPoint presentation that can be conveniently customized. Download it and convince your audience.
-
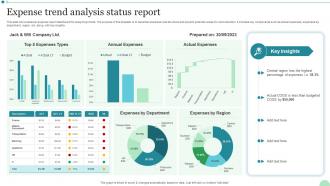 Expense Trend Analysis Status Report
This slide showcases an expense report dashboard for analyzing trends. The purpose of this template is to ascertain business cost structure and pinpoint potential areas for cost reduction. It includes key components such as actual expenses, expenses by department, region, etc. along with key insights. Presenting our well structured Expense Trend Analysis Status Report. The topics discussed in this slide are Expenses Types, Annual Expenses.This is an instantly available PowerPoint presentation that can be edited conveniently. Download it right away and captivate your audience.
-
 Define required resources powerpoint layout
Presenting define required resources powerpoint layout. This is a define required resources powerpoint layout. This is a five stage process. The stages in this process are project planning task, determine feasibility, determine required human resources, establish project scope, define required resources.
-
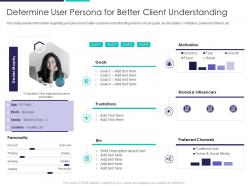 Determine user persona for better deployment of agile in bid and proposals it
This slide provides information regarding user persona for better customer understanding in terms of user goals, bio description, motivation, preferred channel, etc. Deliver an outstanding presentation on the topic using this Determine User Persona For Better Deployment Of Agile In Bid And Proposals IT. Dispense information and present a thorough explanation of Goals, Frustrations, Motivation using the slides given. This template can be altered and personalized to fit your needs. It is also available for immediate download. So grab it now.


