Financials PowerPoint Templates, Financial Statement PPT Templates
- Sub Categories
-
- 30 60 90 Day Plan
- About Us Company Details
- Action Plan
- Agenda
- Annual Report
- Audit Reports
- Balance Scorecard
- Brand Equity
- Business Case Study
- Business Communication Skills
- Business Plan Development
- Business Problem Solving
- Business Review
- Capital Budgeting
- Career Planning
- Change Management
- Color Palettes
- Communication Process
- Company Location
- Company Vision
- Compare
- Competitive Analysis
- Corporate Governance
- Cost Reduction Strategies
- Custom Business Slides
- Customer Service
- Dashboard
- Data Management
- Decision Making
- Digital Marketing Strategy
- Digital Transformation
- Disaster Management
- Diversity
- Equity Investment
- Financial Analysis
- Financial Services
- Financials
- Growth Hacking Strategy
- Human Resource Management
- Innovation Management
- Interview Process
- Knowledge Management
- Leadership
- Lean Manufacturing
- Legal Law Order
- Management
- Market Segmentation
- Marketing
- Media and Communication
- Meeting Planner
- Mergers and Acquisitions
- Metaverse
- Newspapers
- Operations and Logistics
- Organizational Structure
- Our Goals
- Performance Management
- Pitch Decks
- Pricing Strategies
- Process Management
- Product Development
- Product Launch Ideas
- Product Portfolio
- Project Management
- Purchasing Process
- Quality Assurance
- Quotes and Testimonials
- Real Estate
- Risk Management
- Sales Performance Plan
- Sales Review
- SEO
- Service Offering
- Six Sigma
- Social Media and Network
- Software Development
- Solution Architecture
- Stock Portfolio
- Strategic Management
- Strategic Planning
- Supply Chain Management
- Swimlanes
- System Architecture
- Team Introduction
- Testing and Validation
- Thanks-FAQ
- Time Management
- Timelines Roadmaps
- Value Chain Analysis
- Value Stream Mapping
- Workplace Ethic
-
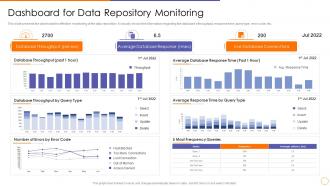 Scale out strategy for data inventory system dashboard for data repository monitoring
This slide presents the dashboard for effective monitoring of the data repository. It visually shows the information regarding the databases throughput, response time, query type, error code, etc. Present the topic in a bit more detail with this Scale Out Strategy For Data Inventory System Dashboard For Data Repository Monitoring. Use it as a tool for discussion and navigation on Dashboard for Data Repository Monitoring. This template is free to edit as deemed fit for your organization. Therefore download it now.
-
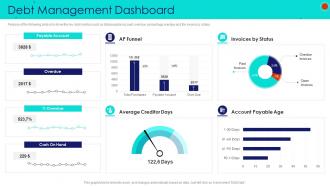 Debt management dashboard snapshot debt collection strategies
Purpose of the following slide is to show the key debt metrics such as total payable account, overdue, percentage overdue and the invoice by status Present the topic in a bit more detail with this Debt Management Dashboard Snapshot Debt Collection Strategies. Use it as a tool for discussion and navigation on Overdue, Payable Account, Invoices By Status, Cash On Hand. This template is free to edit as deemed fit for your organization. Therefore download it now.
-
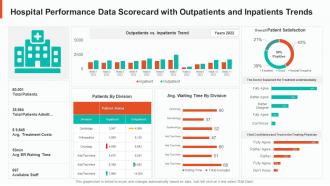 Hospital performance data scorecard with outpatients and inpatients trends
Deliver an outstanding presentation on the topic using this Hospital Performance Data Scorecard With Outpatients And Inpatients Trends. Dispense information and present a thorough explanation of Scorecard, Hospital, Performance using the slides given. This template can be altered and personalized to fit your needs. It is also available for immediate download. So grab it now.
-
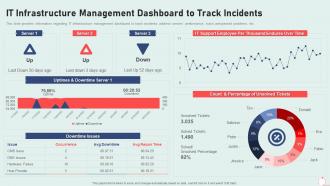 It infrastructure playbook management dashboard to track incidents
This slide provides information regarding IT infrastructure management dashboard to track incidents, address servers performance, track unexpected problems, etc. Present the topic in a bit more detail with this It Infrastructure Playbook Management Dashboard To Track Incidents. Use it as a tool for discussion and navigation on Infrastructure, Management, Dashboard. This template is free to edit as deemed fit for your organization. Therefore download it now.
-
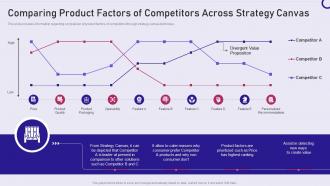 Strategy playbook comparing product factors of competitors across strategy canvas
This slide provides information regarding comparison of product factors of competitors through strategy canvas technique. Present the topic in a bit more detail with this Strategy Playbook Comparing Product Factors Of Competitors Across Strategy Canvas. Use it as a tool for discussion and navigation on Comparing, Product, Competitors. This template is free to edit as deemed fit for your organization. Therefore download it now.
-
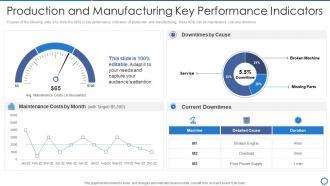 Production and manufacturing key performance manufacturing operation best practices
Purpose of the following slide is to show the KPIs or key performance indicators of production and manufacturing, these KPIs can be maintenance cost and downtime. Present the topic in a bit more detail with this Production And Manufacturing Key Performance Manufacturing Operation Best Practices. Use it as a tool for discussion and navigation on Production, Manufacturing, Performance. This template is free to edit as deemed fit for your organization. Therefore download it now.
-
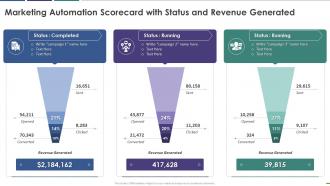 Marketing automation scorecard with status and revenue generated
This graph or chart is linked to excel, and changes automatically based on data. Just left click on it and select Edit Data. Introducing Marketing Automation Scorecard With Status And Revenue Generated to increase your presentation threshold. Encompassed with three stages, this template is a great option to educate and entice your audience. Dispence information on Completed, Running, Revenue Generated, using this template. Grab it now to reap its full benefits.
-
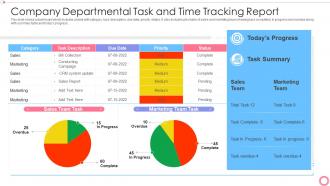 Company departmental task and time tracking report
This slide shows a dashboard which includes a table with category, task description, due date, priority, status. It also includes pie charts of sales and marketing team showing task completed, in progress and overdue along with summary table and todays progress. Introducing our Company Departmental Task And Time Tracking Report set of slides. The topics discussed in these slides are Marketing, Sales, Team. This is an immediately available PowerPoint presentation that can be conveniently customized. Download it and convince your audience.
-
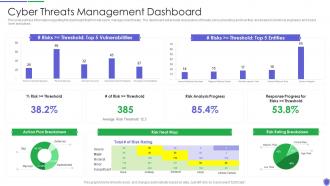 Cyber threats management managing critical threat vulnerabilities and security threats
This slide portrays information regarding the dashboard that firm will use to manage cyber threats. The dashboard will provide clear picture of threats risks prevailing and how they are treated to technical engineers and board level executives. Present the topic in a bit more detail with this Cyber Threats Management Managing Critical Threat Vulnerabilities And Security Threats. Use it as a tool for discussion and navigation on Cyber Threats Management Dashboard. This template is free to edit as deemed fit for your organization. Therefore download it now.
-
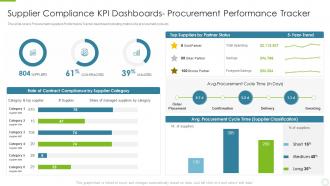 Supplier compliance kpi dashboards key strategies to build an effective supplier relationship
This slide covers Procurement suppliers Performance Tracker dashboard including metrics like procurement cycle etc. Deliver an outstanding presentation on the topic using this Supplier Compliance KPI Dashboards Key Strategies To Build An Effective Supplier Relationship. Dispense information and present a thorough explanation of Procurement Cycle Time, Supplier Classification using the slides given. This template can be altered and personalized to fit your needs. It is also available for immediate download. So grab it now.
-
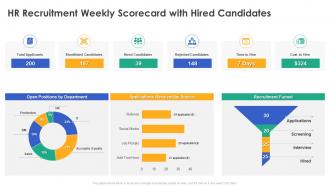 Hr recruitment weekly scorecard with hired candidates ppt powerpoint icons slide
Present the topic in a bit more detail with this HR Recruitment Weekly Scorecard With Hired Candidates Ppt Powerpoint Icons Slide. Use it as a tool for discussion and navigation on Shortlisted Candidates, Hired Candidates, Rejected Candidates, Time To Hire, Cost To Hire. This template is free to edit as deemed fit for your organization. Therefore download it now.
-
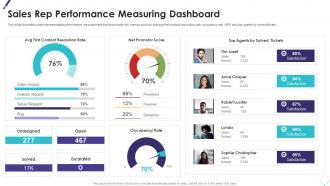 Sales Rep Performance Measuring Dashboard Improving Planning Segmentation
This slide illustrates sales representative performance measurement dashboard with key metrics such as average first contact resolution rate, occupancy rate, NPS and top agents by solved tickets. Present the topic in a bit more detail with this Sales Rep Performance Measuring Dashboard Improving Planning Segmentation. Use it as a tool for discussion and navigation on Unassigned, Solved, Escalated, Open. This template is free to edit as deemed fit for your organization. Therefore download it now.
-
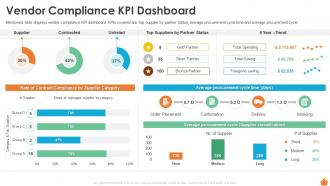 Vendor Compliance Kpi Dashboard Financing Of Real Estate Project
Mentioned slide displays vendor compliance KPI dashboard. KPIs covered are top supplier by partner status, average procurement cycle time and average procurement cycle. Deliver an outstanding presentation on the topic using this Vendor Compliance Kpi Dashboard Financing Of Real Estate Project. Dispense information and present a thorough explanation of Vendor Compliance Kpi Dashboard using the slides given. This template can be altered and personalized to fit your needs. It is also available for immediate download. So grab it now.
-
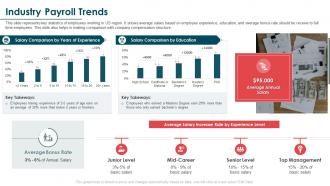 Industry Payroll Trends Salary Survey Report
This slide represents key statistics of employees working in US region. It shows average salary based on employee experience, education, and average bonus rate should be receive to full time employees. This slide also helps in making comparison with company compensation structure. Deliver an outstanding presentation on the topic using this Industry Payroll Trends Salary Survey Report. Dispense information and present a thorough explanation of Compensation, Structure, Represents using the slides given. This template can be altered and personalized to fit your needs. It is also available for immediate download. So grab it now.
-
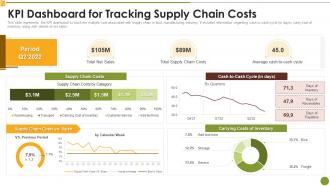 Kpi Dashboard For Tracking Supply Chain Costs Market Research Report
This slide represents the KPI dashboard to track the multiple cost associated with supply chain in food manufacturing industry. It includes information regarding cash to cash cycle in days, carry cost of inventory along with details of net sales. Deliver an outstanding presentation on the topic using this Kpi Dashboard For Tracking Supply Chain Costs Market Research Report. Dispense information and present a thorough explanation of KPI Dashboard For Tracking Supply Chain Costs using the slides given. This template can be altered and personalized to fit your needs. It is also available for immediate download. So grab it now.
-
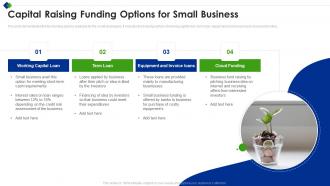 Capital Raising Funding Options For Small Business
This slide demonstrates the four funding options available for the small businesses. It includes fund raising options of working capital loan, term loan, equipment and invoice loans and cloud funding. Presenting our set of slides with name Capital Raising Funding Options For Small Business. This exhibits information on four stages of the process. This is an easy-to-edit and innovatively designed PowerPoint template. So download immediately and highlight information on Cloud Funding, Working Capital Loan, Equipment And Invoice Loans.
-
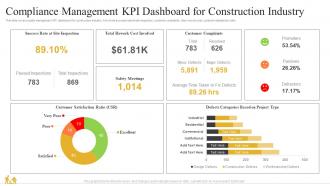 Compliance Management KPI Dashboard For Construction Industry
This slide covers quality management KPI dashboard for construction industry. It involves success rate at site inspection, customer complaints, total rework cost, customer satisfaction ratio. Presenting our well-structured Compliance Management KPI Dashboard For Construction Industry. The topics discussed in this slide are Compliance Management, KPI Dashboard, Construction Industry. This is an instantly available PowerPoint presentation that can be edited conveniently. Download it right away and captivate your audience.
-
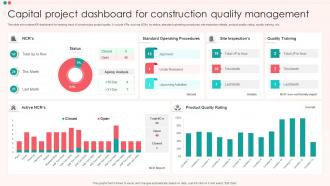 Capital Project Dashboard For Construction Quality Management
This slide showcases KPI dashboard for keeping track of construction project quality. It include KPIs such as NCRs by status, standard operating procedures, site inspection details, product quality rating, quality training, etc. Presenting our well-structured Capital Project Dashboard For Construction Quality Management. The topics discussed in this slide are Capital Project Dashboard, Construction Quality Management. This is an instantly available PowerPoint presentation that can be edited conveniently. Download it right away and captivate your audience.
-
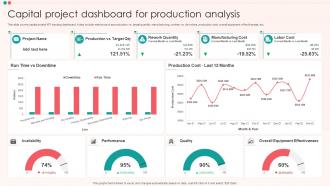 Capital Project Dashboard For Production Analysis
This slide covers capital project KPI tracking dashboard. It also include metrics such as production vs. target quantity, manufacturing, runtime vs. downtime, production cost, overall equipment effectiveness, etc. Presenting our well-structured Capital Project Dashboard For Production Analysis. The topics discussed in this slide are Availability, Performance, Quality, Overall Equipment Effectiveness. This is an instantly available PowerPoint presentation that can be edited conveniently. Download it right away and captivate your audience.
-
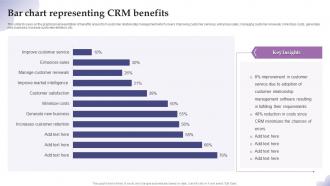 Bar Chart Representing CRM Benefits
This slide focuses on the graphical representation of benefits arises from customer relationship management which covers improving customer services, enhances sales, managing customer renewals, minimizes costs, generates new business, increase customer retention, etc. Introducing our Bar Chart Representing CRM Benefits set of slides. The topics discussed in these slides are Bar chart representing, CRM benefits. This is an immediately available PowerPoint presentation that can be conveniently customized. Download it and convince your audience.
-
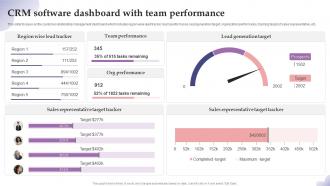 CRM Software Dashboard With Team Performance
This slide focuses on the customer relationship management dashboard which includes region wise lead tracker, team performance, lead generation target, organization performance, tracking target of sales representative, etc. Introducing our CRM Software Dashboard With Team Performance set of slides. The topics discussed in these slides are CRM Software, Dashboard, Team Performance. This is an immediately available PowerPoint presentation that can be conveniently customized. Download it and convince your audience.
-
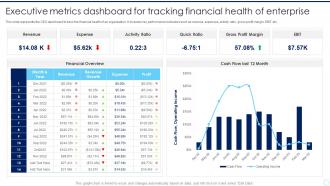 Executive Metrics Dashboard For Tracking Financial Health Of Enterprise
This slide represents the CEO dashboard to track the financial health of an organization. It includes key performance indicators such as revenue, expenses, activity ratio, gross profit margin, EBIT etc. Presenting our well structured Executive Metrics Dashboard For Tracking Financial Health Of Enterprise. The topics discussed in this slide are Revenue, Expense, Activity Ratio, Quick Ratio. This is an instantly available PowerPoint presentation that can be edited conveniently. Download it right away and captivate your audience.
-
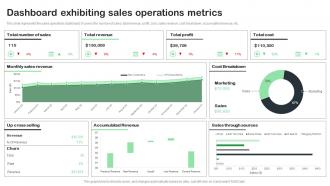 Dashboard Exhibiting Sales Operations Metrics
This slide represents the sales operations dashboard. It covers the number of sales, total revenue, profit, cost, sales revenue, cost breakdown, accumulated revenue, etc. Presenting our well structured Dashboard Exhibiting Sales Operations Metrics. The topics discussed in this slide are Accumulated Revenue, Cost Breakdown, Sales Through Source. This is an instantly available PowerPoint presentation that can be edited conveniently. Download it right away and captivate your audience.
-
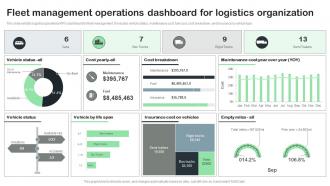 Fleet Management Operations Dashboard For Logistics Organization
This slide exhibits logistics operations KPIs dashboard for fleet management. It includes vehicle status, maintenance cost, fuel cost, cost breakdown, and insurance by vehicle type. Introducing our Fleet Management Operations Dashboard For Logistics Organization set of slides. The topics discussed in these slides are Vehicle Status, Cost Breakdown, Insurance Cost. This is an immediately available PowerPoint presentation that can be conveniently customized. Download it and convince your audience.
-
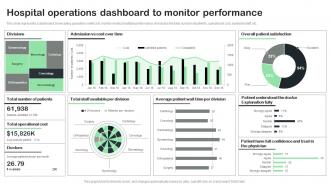 Hospital Operations Dashboard To Monitor Performance
This slide represents a dashboard showcasing operations metrics to monitor medical institute performance. It includes the total number of patients, operational cost, available staff, etc. Presenting our well structured Hospital Operations Dashboard To Monitor Performance. The topics discussed in this slide are Hospital Operations Dashboard, Monitor Performance. This is an instantly available PowerPoint presentation that can be edited conveniently. Download it right away and captivate your audience.
-
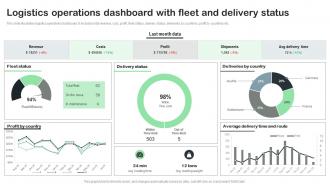 Logistics Operations Dashboard With Fleet And Delivery Status
This slide illustrates logistics operations dashboard. It includes total revenue, cost, profit, fleet status, delivery status, deliveries by countries, profit by countries etc. Introducing our Logistics Operations Dashboard With Fleet And Delivery Status set of slides. The topics discussed in these slides are Fleet Status, Delivery Status, Deliveries By Country. This is an immediately available PowerPoint presentation that can be conveniently customized. Download it and convince your audience.
-
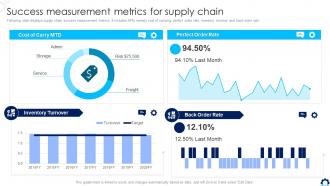 Supply Chain Transformation Toolkit Success Measurement Metrics For Supply Chain
Following slide displays supply chain success measurement metrics. It includes KPIs namely cost of carrying, perfect order rate, inventory turnover and back order rate. Deliver an outstanding presentation on the topic using this Supply Chain Transformation Toolkit Success Measurement Metrics For Supply Chain. Dispense information and present a thorough explanation of Success, Measurement, Metrics, Supply Chain using the slides given. This template can be altered and personalized to fit your needs. It is also available for immediate download. So grab it now.
-
 Online Payment For E Commerce Purchase Icon
Introducing our premium set of slides with Online Payment For E Commerce Purchase Icon. Ellicudate the four stages and present information using this PPT slide. This is a completely adaptable PowerPoint template design that can be used to interpret topics like Online Payment For E Commerce, Purchase Icon. So download instantly and tailor it with your information.
-
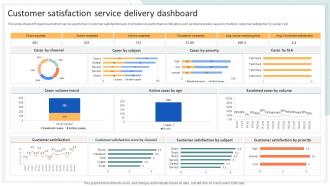 Customer Satisfaction Service Delivery Dashboard
This slide shows KPI dashboard which can be used to track customer satisfaction level. It includes key performance indicators such as total requests, cases by channel, customer satisfaction by subject, etc. Introducing our Customer Satisfaction Service Delivery Dashboard set of slides. The topics discussed in these slides are Cases By Channel, Cases Volume Trend, Customer Satisfaction. This is an immediately available PowerPoint presentation that can be conveniently customized. Download it and convince your audience.
-
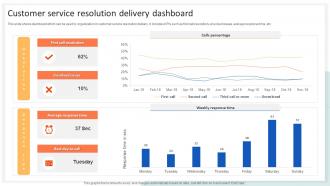 Customer Service Resolution Delivery Dashboard
This slide shows dashboard which can be used by organization in customer service resolution delivery. It includes KPIs such as first call resolution, unsolved issues, average response time, etc. Presenting our well structured Customer Service Resolution Delivery Dashboard. The topics discussed in this slide are First Call Resolution, Unsolved Issues, Average Response Time. This is an instantly available PowerPoint presentation that can be edited conveniently. Download it right away and captivate your audience.
-
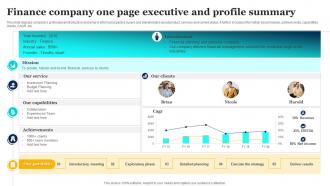 Finance Company One Page Executive And Profile Summary
This slide displays companys professional introduction and aims to inform prospective buyers and stakeholders about product, services and current status. It further includes information about mission, achievements, capabilities, clients, CAGR, etc. Presenting our well structured Finance Company One Page Executive And Profile Summary. The topics discussed in this slide are Introductory Meeting, Exploratory Phase, Detailed Planning. This is an instantly available PowerPoint presentation that can be edited conveniently. Download it right away and captivate your audience.
-
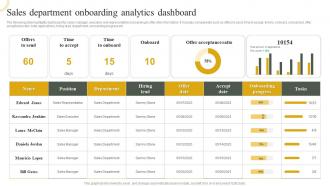 Sales Department Onboarding Analytics Dashboard
The following slide highlights dashboard for sales manager, executive and representative onboarding to offer vital information. It includes components such as offers to send, time to accept, time to onboard, onboarded, offer acceptance ratio, total applications, hiring lead, department, onboarding progress etc.Introducing our Sales Department Onboarding Analytics Dashboard set of slides. The topics discussed in these slides are Sales Representative,Sales Executive,Sales Department . This is an immediately available PowerPoint presentation that can be conveniently customized. Download it and convince your audience.
-
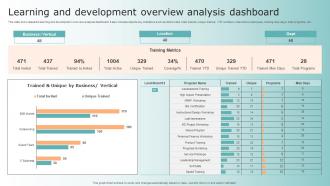 Learning And Development Overview Analysis Dashboard
This slide showcases the learning and development overview analysis dashboard. It also includes depicts key indicators such as total invited, total trained, unique trained, YTD numbers, total active employees, training man days, total programs, etc. Introducing our Learning And Development Overview Analysis Dashboard set of slides. The topics discussed in these slides are Training Metrics, Assessments Training. This is an immediately available PowerPoint presentation that can be conveniently customized. Download it and convince your audience.
-
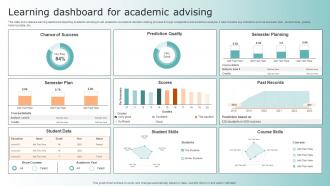 Learning Dashboard For Academic Advising
This slide showcases a learning dashboard depicting academic advising to aid academic counselors decision making process through comparative and predictive analysis. It also includes key indicators such as semester plan, student data, grades, historical data, etc. Introducing our Learning Dashboard For Academic Advising set of slides. The topics discussed in these slides are Chance Success, Prediction Quality. This is an immediately available PowerPoint presentation that can be conveniently customized. Download it and convince your audience.
-
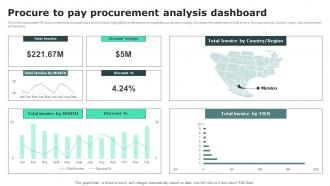 Procure To Pay Procurement Analysis Dashboard
This slide showcases P2P procurement analysis dashboard which helps in highlighting inefficiencies and speeding up decision making. It includes elements such as total invoice, discount savings, country, region, discount percent and analysis. Introducing our Procure To Pay Procurement Analysis Dashboard set of slides. The topics discussed in these slides are Invoice, Discount, Savings. This is an immediately available PowerPoint presentation that can be conveniently customized. Download it and convince your audience.
-
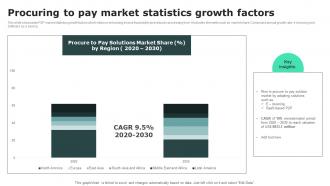 Procuring To Pay Market Statistics Growth Factors
This slide showcases P2P market statistics growth factors which helps in enhancing invoice traceability and reduces processing time. It includes elements such as market share, Compound annual growth rate, e invoicing and Software as a service. Introducing our Procuring To Pay Market Statistics Growth Factors set of slides. The topics discussed in these slides are Market, Statistics, Growth. This is an immediately available PowerPoint presentation that can be conveniently customized. Download it and convince your audience.
-
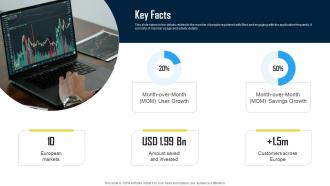 Key Facts Innovative Financial Technology Solutions Provider Investor Funding Elevator
This slide caters to the details related to the number of people registered with Bind and engaging with the application frequently. It consists of member usage and activity details.Deliver an outstanding presentation on the topic using this Key Facts Innovative Financial Technology Solutions Provider Investor Funding Elevator. Dispense information and present a thorough explanation of European Markets, Customers Across, Amount Saved Invested using the slides given. This template can be altered and personalized to fit your needs. It is also available for immediate download. So grab it now.
-
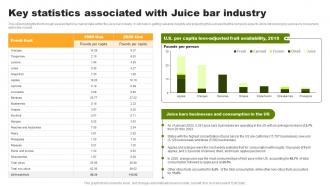 Key Statistics Associated With Juice Bar Industry Organic Juice Bar Franchise BP SS
This slide highlights the thorough assessment of a market data within the juice bar industry. It will help in getting valuable insights and projecting the success that the company expects while introducing its services to consumers within the market.Deliver an outstanding presentation on the topic using this Key Statistics Associated With Juice Bar Industry Organic Juice Bar Franchise BP SS. Dispense information and present a thorough explanation of Peaches Nectarines, Plums Prunes, Strawberries using the slides given. This template can be altered and personalized to fit your needs. It is also available for immediate download. So grab it now.
-
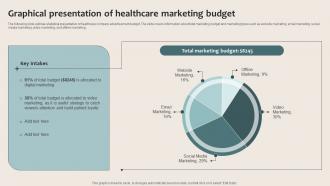 Healthcare Marketing Graphical Presentation Of Healthcare Marketing Budget Strategy SS V
The following slide outlines statistical presentation of healthcare company advertisement budget. The slide covers information about total marketing budget and marketing types such as website marketing, email marketing, social media marketing, video marketing, and offline marketing. Deliver an outstanding presentation on the topic using this Healthcare Marketing Graphical Presentation Of Healthcare Marketing Budget Strategy SS V Dispense information and present a thorough explanation of Total Marketing Budget, Marketing Budget, Patient Loyalty using the slides given. This template can be altered and personalized to fit your needs. It is also available for immediate download. So grab it now.
-
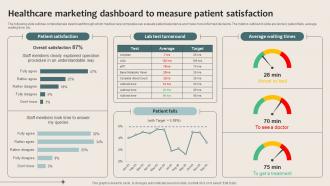 Healthcare Marketing Healthcare Marketing Dashboard To Measure Patient Satisfaction Strategy SS V
The following slide outlines comprehensive dashboard through which medical care companies can evaluate patient experience and make more informed decisions. The metrics outlined in slide are lab test, patient falls, average waiting time, etc. Present the topic in a bit more detail with this Healthcare Marketing Healthcare Marketing Dashboard To Measure Patient Satisfaction Strategy SS V Use it as a tool for discussion and navigation on Lab Test Turnaround, Average Waiting Times, Patient Satisfaction This template is free to edit as deemed fit for your organization. Therefore download it now.
-
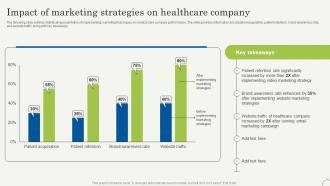 Impact Of Marketing Strategies On Healthcare Strategic Plan To Promote Strategy SS V
The following slide outlines statistical representation of implementing marketing techniques on medical care company performance. The slide provides information about patient acquisition, patient retention, brand awareness rate, and website traffic along with key takeaways. Deliver an outstanding presentation on the topic using this Impact Of Marketing Strategies On Healthcare Strategic Plan To Promote Strategy SS V. Dispense information and present a thorough explanation of Website, Awareness, Company using the slides given. This template can be altered and personalized to fit your needs. It is also available for immediate download. So grab it now.
-
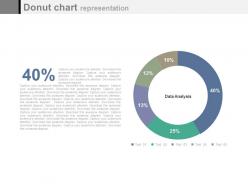 Circle donut chart with percentage graph powerpoint slides
Presenting circle donut chart with percentage graph powerpoint slides. This Power Point template slide has been crafted with graphic of circle donut chart and percentage graph .This PPT slide contains the concept of financial analysis. Use this PPT slide for business and finance related presentations.
-
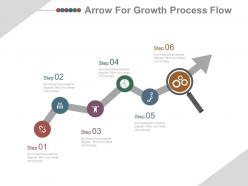 Six staged icons growth arrow for process flow powerpoint slides
Presenting six staged icons growth arrow for process flow powerpoint slides. This Power Point template slide has been crafted with graphic of six staged arrow and icons. This PPT slide contains the concept of process flow analysis. Use this PPT slide for business and finance related presentations.
-
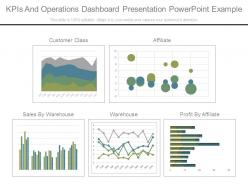 Kpi tracking ppt diagram powerpoint graphics
Presenting kpi tracking ppt diagram powerpoint graphics. This is a kpi tracking ppt diagram powerpoint graphics. This is a five stage process. The stages in this process are customer class, affiliate, sales by warehouse, warehouse, profit by affiliate.
-
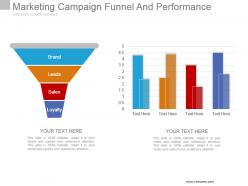 Marketing campaign funnel and performance powerpoint ideas
Presenting marketing campaign funnel and performance powerpoint ideas. This is a marketing campaign funnel and performance powerpoint ideas. This is a four stage process. The stages in this process are brand, leads, sales, loyalty.
-
 6 investment highlights example of ppt
Presenting 6 investment highlights an example of PPT. This template can be simply used by tweaking the color scheme and style of the presentation. This PowerPoint template is fully supported by Google Slides. The picture quality of the slide does not get distorted even when projected on a large screen. Fast downloading speed and formats can be easily changed to JPEG and PDF applications. This template is suitable for marketing, salespersons, business managers, and entrepreneurs. Adjust PPT layout, font, text, and color as per your necessity.
-
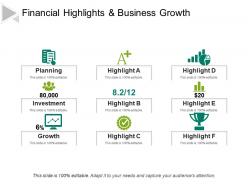 Financial highlights and business growth powerpoint slide show
We present to you our PowerPoint template on financial highlights and business growth. Our presentation has high resolution graphics and you can edit these to precisely match your style. All the images are 100 % editable in PowerPoint. The colors can also be customized according to the presenter. This template can be saved in either PDF or JPG format. So, hurry and download our presentation and grow your business.
-
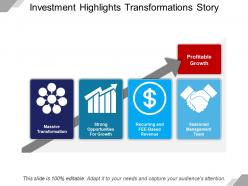 Investment highlights transformations story powerpoint guide
Presenting investment highlights transformations story PowerPoint guide PPT slide. Spectacular presentation of designs and colors. Excellent quality pictures which do not pixelate when projected on a wide screen. Compatibility with multiple format options like JPEG and JPG. Harmonious with numerous online and offline software options. 100 percent editable. Ease of swipe out and/or inclusion of content as per individual choice.
-
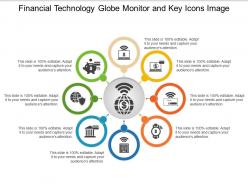 Financial technology globe monitor and key icons image
Presenting this set of slides with name - Financial Technology Globe Monitor And Key Icons Image. This is a eight stage process. The stages in this process are Financial Technology, Fintech, Financial Services.
-
 Budget forecast with bag of dollar
Presenting this set of slides with name - Budget Forecast With Bag Of Dollar. This is a one stage process. The stages in this process are Budget Forecast, Forecast Vs Actual Budget, Plan Vs Forecast.
-
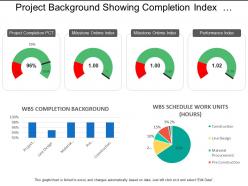 Project background showing completion index and pie chart
Presenting this set of slides with name - Project Background Showing Completion Index And Pie Chart. This is a four stage process. The stages in this process are Project Background, Project Management, Project Description.
-
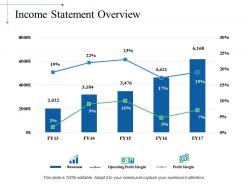 Income statement overview ppt slide themes
Presenting this set of slides with name - Income Statement Overview Ppt Slide Themes. This is a five stage process. The stages in this process are Business, Marketing, Finance, Planning, Analysis.
-
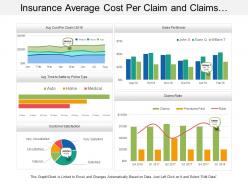 Insurance average cost per claim and claims ratio dashboard
Presenting this set of slides with name - Insurance Average Cost Per Claim And Claims Ratio Dashboard. This is a five stage process. The stages in this process are Assurance, Surety, Insurance.
-
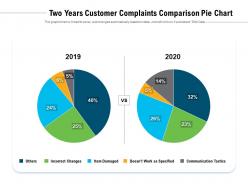 Two years customer complaints comparison pie chart
Presenting this set of slides with name Two Years Customer Complaints Comparison Pie Chart. The topics discussed in these slides are Two Years, Customer Complaints, Comparison Pie Chart. This is a completely editable PowerPoint presentation and is available for immediate download. Download now and impress your audience.
-
 Digital wallet icon with crypto coin
Presenting this set of slides with name Digital Wallet Icon With Crypto Coin. This is a one stage process. The stages in this process are Digital Wallet Icon With Crypto Coin. This is a completely editable PowerPoint presentation and is available for immediate download. Download now and impress your audience.
-
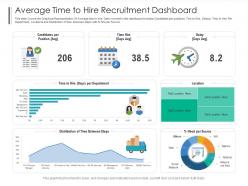 Average time to hire recruitment dashboard powerpoint template
This slide Covers the Graphical Representation Of Average time to hire. Data covered in this dashboard includes-Candidates per positions, Tine to Hire, Delays, Time to Hire Per Department, Locations and Distribution of time between steps with pervent Hire per Source. This is a Average Time To Hire Recruitment Dashboard Powerpoint Template featuring in built editable components to add your personal touches. Tailor this template as per your liking and display it on a widescreen or standard screen, the choice is yours.
-
 Final capex planning draft plan icon
Presenting our set of slides with Final Capex Planning Draft Plan Icon. This exhibits information on three stages of the process. This is an easy to edit and innovatively designed PowerPoint template. So download immediately and highlight information on Final Capex Planning Draft Plan Icon.
-
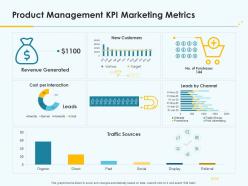 Product pricing strategy product management kpi marketing metrics ppt information
Deliver an outstanding presentation on the topic using this Product Pricing Strategy Product Management KPI Marketing Metrics Ppt Information. Dispense information and present a thorough explanation of Product Management KPI Marketing Metrics using the slides given. This template can be altered and personalized to fit your needs. It is also available for immediate download. So grab it now.
-
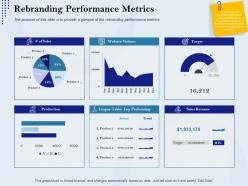 Rebranding performance metrics rebranding approach ppt pictures
The purpose of this slide is to provide a glimpse of the rebranding performance metrics.Deliver an outstanding presentation on the topic using this Rebranding Performance Metrics Rebranding Approach Ppt Pictures. Dispense information and present a thorough explanation of Website Visitors, Target, Sales Revenue, League Table Top Performing, Production using the slides given. This template can be altered and personalized to fit your needs. It is also available for immediate download. So grab it now.
-
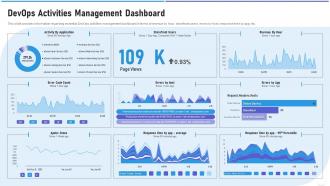 Strategic devops implementation it devops activities dashboard
This slide provides information regarding essential DevOps activities management dashboard in terms of revenue by hour, storefront users, errors by host, response time by app, etc. Present the topic in a bit more detail with this Strategic DevOps Implementation IT DevOps Activities Dashboard. Use it as a tool for discussion and navigation on Devops Activities Management Dashboard. This template is free to edit as deemed fit for your organization. Therefore download it now.


