Financials PowerPoint Templates, Financial Statement PPT Templates
- Sub Categories
-
- 30 60 90 Day Plan
- About Us Company Details
- Action Plan
- Agenda
- Annual Report
- Audit Reports
- Balance Scorecard
- Brand Equity
- Business Case Study
- Business Communication Skills
- Business Plan Development
- Business Problem Solving
- Business Review
- Capital Budgeting
- Career Planning
- Change Management
- Color Palettes
- Communication Process
- Company Location
- Company Vision
- Compare
- Competitive Analysis
- Corporate Governance
- Cost Reduction Strategies
- Custom Business Slides
- Customer Service
- Dashboard
- Data Management
- Decision Making
- Digital Marketing Strategy
- Digital Transformation
- Disaster Management
- Diversity
- Equity Investment
- Financial Analysis
- Financial Services
- Financials
- Growth Hacking Strategy
- Human Resource Management
- Innovation Management
- Interview Process
- Knowledge Management
- Leadership
- Lean Manufacturing
- Legal Law Order
- Management
- Market Segmentation
- Marketing
- Media and Communication
- Meeting Planner
- Mergers and Acquisitions
- Metaverse
- Newspapers
- Operations and Logistics
- Organizational Structure
- Our Goals
- Performance Management
- Pitch Decks
- Pricing Strategies
- Process Management
- Product Development
- Product Launch Ideas
- Product Portfolio
- Project Management
- Purchasing Process
- Quality Assurance
- Quotes and Testimonials
- Real Estate
- Risk Management
- Sales Performance Plan
- Sales Review
- SEO
- Service Offering
- Six Sigma
- Social Media and Network
- Software Development
- Solution Architecture
- Stock Portfolio
- Strategic Management
- Strategic Planning
- Supply Chain Management
- Swimlanes
- System Architecture
- Team Introduction
- Testing and Validation
- Thanks-FAQ
- Time Management
- Timelines Roadmaps
- Value Chain Analysis
- Value Stream Mapping
- Workplace Ethic
-
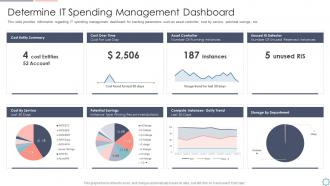 Cios initiatives for strategic it cost optimization spending management dashboard
This slide provides information regarding IT spending management dashboard for tracking parameters such as asset controller, cost by service, potential savings, etc. Deliver an outstanding presentation on the topic using this Cios Initiatives For Strategic It Cost Optimization Spending Management Dashboard. Dispense information and present a thorough explanation of Management, Dashboard, Information using the slides given. This template can be altered and personalized to fit your needs. It is also available for immediate download. So grab it now.
-
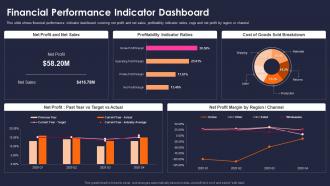 Measure sustainability key performance indicators financial performance indicator dashboard snapshot
This slide shows financial performance indicator dashboard covering net profit and net sales, profitability indicator ratios, cogs and net profit by region or channel. Deliver an outstanding presentation on the topic using this Measure Sustainability Key Performance Indicators Financial Performance Indicator Dashboard Snapshot. Dispense information and present a thorough explanation of Net Profit and Net Sales, Profitability Indicator Ratios, Cost of Goods Sold Breakdown, Net Profit, Past Year vs Target vs Actual using the slides given. This template can be altered and personalized to fit your needs. It is also available for immediate download. So grab it now.
-
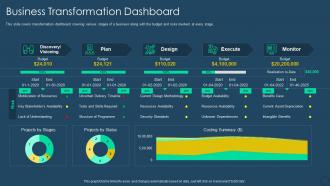 Exhaustive digital transformation deck business transformation dashboard snapshot
This slide covers transformation dashboard covering various stages of a business along with the budget and risks involved at every stage. Deliver an outstanding presentation on the topic using this Exhaustive Digital Transformation Deck Business Transformation Dashboard Snapshot. Dispense information and present a thorough explanation of Business Transformation Dashboard using the slides given. This template can be altered and personalized to fit your needs. It is also available for immediate download. So grab it now.
-
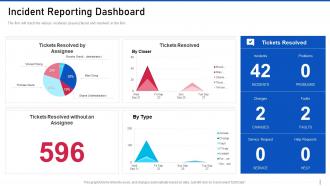 Threat management for organization critical incident reporting dashboard
The firm will track the various incidents issues faced and resolved in the firm. Present the topic in a bit more detail with this Threat Management For Organization Critical Incident Reporting Dashboard. Use it as a tool for discussion and navigation on Incident Reporting Dashboard. This template is free to edit as deemed fit for your organization. Therefore download it now.
-
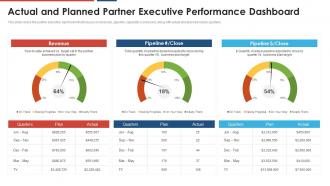 Build a dynamic partnership and planned executive performance dashboard
This slide covers the partner executive dashboard that focuses on revenues, pipeline, capability scoreboard, along with actual and planned values quarterly.Present the topic in a bit more detail with this Build A Dynamic Partnership And Planned Executive Performance Dashboard. Use it as a tool for discussion and navigation on Actual And Planned Partner Executive Performance Dashboard. This template is free to edit as deemed fit for your organization. Therefore download it now.
-
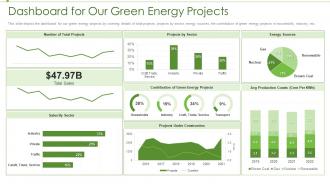 Renewable energy dashboard for our green energy projects ppt brochure
Present the topic in a bit more detail with this Renewable Energy Dashboard For Our Green Energy Projects Ppt Brochure Use it as a tool for discussion and navigation on Dashboard For Our Green Energy Projects This template is free to edit as deemed fit for your organization. Therefore download it now.
-
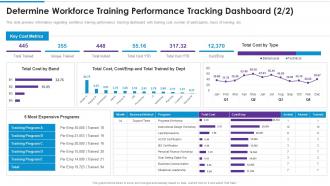 Determine workforce training performance tracking dashboard training playbook template
This slide provides information regarding workforce training performance tracking dashboard with training cost, number of participants, hours of training, etc. Present the topic in a bit more detail with this Determine Workforce Training Performance Tracking Dashboard Training Playbook Template. Use it as a tool for discussion and navigation on Determine Workforce Training Performance Tracking Dashboard. This template is free to edit as deemed fit for your organization. Therefore download it now.
-
 Google data studio to build real time reporting dashboards digital marketing playbook
This template covers tools to measure marketing analytics such as google analytics for all web tracking, google data studio to build real time reporting dashboards and google data studio reports. Deliver an outstanding presentation on the topic using this Google Data Studio To Build Real Time Reporting Dashboards Digital Marketing Playbook. Dispense information and present a thorough explanation of Mobile System Operating Breakdown, Mobile Geographic Report, Mobile Sessions By Medium, Mobile Goal Analysis using the slides given. This template can be altered and personalized to fit your needs. It is also available for immediate download. So grab it now.
-
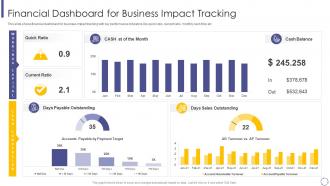 Financial dashboard snapshot business impact tracking micro and macro environmental analysis
This slide shows financial dashboard for business impact tracking with key performance indicators like quick ratio, current ratio, monthly cash flow etc Present the topic in a bit more detail with this Financial Dashboard Snapshot Business Impact Tracking Micro And Macro Environmental Analysis. Use it as a tool for discussion and navigation on Financial Dashboard For Business Impact Tracking. This template is free to edit as deemed fit for your organization. Therefore download it now.
-
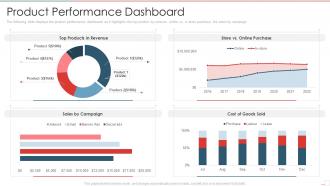 Product performance dashboard new product performance evaluation
The following slide displays the product performance dashboard as it highlights the top product by revenue, online vs in store purchase, the sales by campaign Deliver an outstanding presentation on the topic using this Product Performance Dashboard New Product Performance Evaluation. Dispense information and present a thorough explanation of Product Performance Dashboard using the slides given. This template can be altered and personalized to fit your needs. It is also available for immediate download. So grab it now.
-
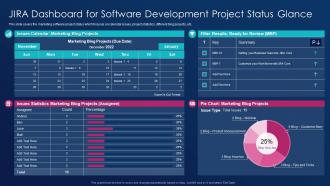 Jira dashboard for software development project software development best practice tools
This slide covers the marketing software project status which focuses on calendar issues, project statistics, different blog projects, etc. Deliver an outstanding presentation on the topic using this Jira Dashboard For Software Development Project Software Development Best Practice Tools. Dispense information and present a thorough explanation of Dashboard, Software, Development using the slides given. This template can be altered and personalized to fit your needs. It is also available for immediate download. So grab it now.
-
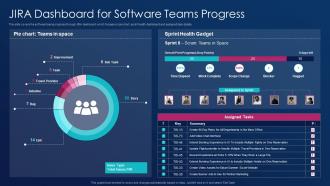 Software development best practice tools jira dashboard for software teams progress
This slide covers the software teams progress through JIRA dashboard which focuses on pie chart, sprint health dashboard and assigned task details. Present the topic in a bit more detail with this Software Development Best Practice Tools Jira Dashboard For Software Teams Progress. Use it as a tool for discussion and navigation on JIRA Dashboard For Software Teams Progress. This template is free to edit as deemed fit for your organization. Therefore download it now.
-
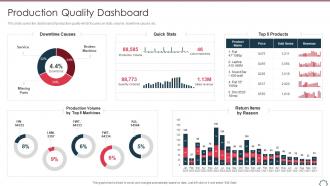 Total productivity maintenance production quality dashboard ppt slides introduction
This slide covers the dashboard of production quality which focuses on stats, volume, downtime causes, etc. Deliver an outstanding presentation on the topic using this Total Productivity Maintenance Production Quality Dashboard Ppt Slides Introduction. Dispense information and present a thorough explanation of Downtime Causes, Quick Stats, Top 5 Products, Production Volume By Top 5 Machines, Return Items By Reason, Missing Parts, Service, Broken Machine using the slides given. This template can be altered and personalized to fit your needs. It is also available for immediate download. So grab it now.
-
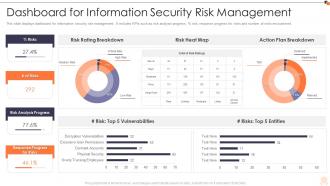 Iso 27001 dashboard for information security risk management ppt sample
This slide displays dashboard for information security risk management. It includes KPIs such as risk analysis progress, parsent risk, response progress for risks and number of risks encountered. Present the topic in a bit more detail with this ISO 27001 Dashboard For Information Security Risk Management Ppt Sample. Use it as a tool for discussion and navigation on Dashboard For Information Security Risk Management. This template is free to edit as deemed fit for your organization. Therefore download it now.
-
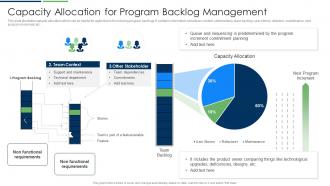 Capacity Allocation For Program Backlog Management
This slide illustrates capacity allocation which can be helpful for agile teams for reducing program backlogs. It contains information about team context, stakeholders, team backlog, user stories, refactors, maintenance, next program increment, etc. Presenting our well-structured Capacity Allocation For Program Backlog Management. The topics discussed in this slide are Management, Capacity, Allocation. This is an instantly available PowerPoint presentation that can be edited conveniently. Download it right away and captivate your audience.
-
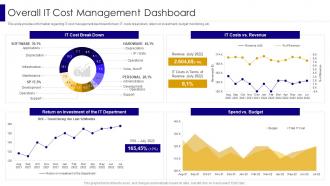 Overall It Cost Management Dashboard Managing It Infrastructure Development Playbook
This slide provides information regarding IT cost management dashboard to track IT costs breakdown, return on investment, budget monitoring, etc. Present the topic in a bit more detail with this Overall It Cost Management Dashboard Managing It Infrastructure Development Playbook. Use it as a tool for discussion and navigation on Applications, Depreciation, Investment. This template is free to edit as deemed fit for your organization. Therefore download it now.
-
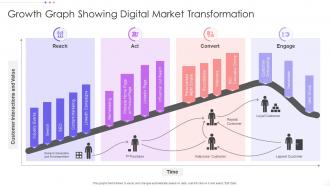 Growth Graph Showing Digital Market Transformation
Introducing our Growth Graph Showing Digital Market Transformation set of slides. The topics discussed in these slides are Loyal Customer, Indecisive Customer, Lapsed Customer. This is an immediately available PowerPoint presentation that can be conveniently customized. Download it and convince your audience.
-
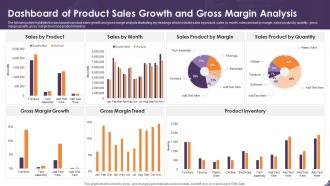 Dashboard Snapshot Of Product Sales Growth And Gross Margin Analysis
The following slide highlights the dashboard o product sales growth and gross margin analysis illustrating key headings which includes sales by product, sales by month, sales product by margin, sales product by quantity, gross margin growth, gross margin trend and product inventory Introducing our Dashboard Snapshot Of Product Sales Growth And Gross Margin Analysis set of slides. The topics discussed in these slides are Gross Margin Growth, Gross Margin Trend, Product Inventory. This is an immediately available PowerPoint presentation that can be conveniently customized. Download it and convince your audience.
-
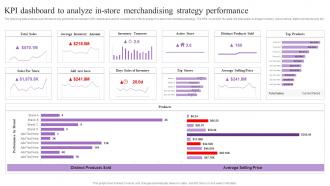 KPI Dashboard To Analyze In Store Merchandising Strategy Performance Increasing Brand Loyalty
The following slide outlines a performance key performance indicator KPI dashboard used to evaluate the effectiveness of in-store merchandising strategy. The KPIs covered in the slide are total sales, average inventory, active stores, distinct products sold, etc. Present the topic in a bit more detail with this KPI Dashboard To Analyze In Store Merchandising Strategy Performance Increasing Brand Loyalty. Use it as a tool for discussion and navigation on Total Sales, Strategy Performance, Inventory Turnover. This template is free to edit as deemed fit for your organization. Therefore download it now.
-
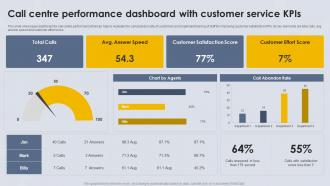 Call Centre Performance Dashboard With Customer Service KPIs
This slide showcases dashboard for call centre performance that can help to evaluate the call abandon rate of customers and implement training of staff for improving customer satisfaction KPIs. Its key elements are total calls, avg answer speed and customer effort score. Introducing our Call Centre Performance Dashboard With Customer Service KPIs set of slides. The topics discussed in these slides are Call Centre, Performance Dashboard, Customer Service KPIS. This is an immediately available PowerPoint presentation that can be conveniently customized. Download it and convince your audience.
-
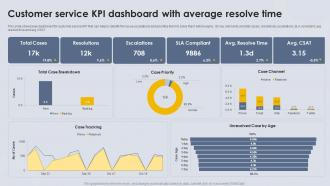 Customer Service KPI Dashboard With Average Resolve Time
This slide showcases dashboard for customer service KPI that can help to identify the issue escalations and prioritize them to solve them before expiry. Its key elements are total cases, resolutions, escalations, SLA complaint, avg resolve time and avg CSAT. Introducing our Customer Service KPI Dashboard With Average Resolve Time set of slides. The topics discussed in these slides are Customer Service, KPI Dashboard, Average Resolve Time. This is an immediately available PowerPoint presentation that can be conveniently customized. Download it and convince your audience.
-
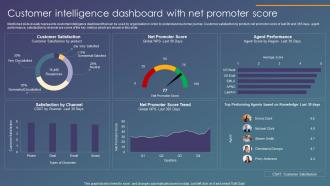 Customer Intelligence Dashboard Snapshot With Net Promoter Score
Mentioned slide visually represents customer intelligence dashboard that can be used by organization in order to understand customer journey. Customer satisfaction by product, net promotor score of last 90 and 365 days, agent performance, satisfaction by channel are some of the key metrics which are shown in this slide. Introducing our Customer Intelligence Dashboard Snapshot With Net Promoter Score set of slides. The topics discussed in these slides are Customer Intelligence Dashboard, Net Promoter Score. This is an immediately available PowerPoint presentation that can be conveniently customized. Download it and convince your audience.
-
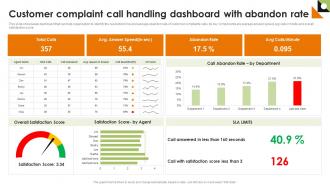 Customer Complaint Call Handling Dashboard With Abandon Rate
This slide showcases dashboard that can help organization to identify the resolution time and average abandon rate of customer complaints calls. Its key components are average answer speed, avg calls or minute and overall satisfaction score. Introducing our Customer Complaint Call Handling Dashboard With Abandon Rate set of slides. The topics discussed in these slides are Customer Complaint, Call Handling, Dashboard. This is an immediately available PowerPoint presentation that can be conveniently customized. Download it and convince your audience.
-
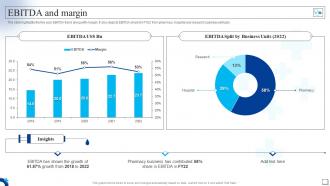 Medical Services Company Profile Ebitda And Margin
The slide highlights the five year EBITDA trend along with margin. It also depicts EBITDA share for FY22 from pharmacy, hospital and research business verticals. Deliver an outstanding presentation on the topic using this Medical Services Company Profile Ebitda And Margin. Dispense information and present a thorough explanation of Research, Business, Verticals using the slides given. This template can be altered and personalized to fit your needs. It is also available for immediate download. So grab it now.
-
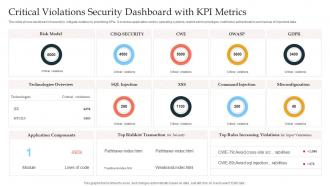 Critical Violations Security Dashboard Snapshot With KPI Metrics
This slide shows dashboard of security to mitigate violation by prioritizing KPIs. It includes application control, operating systems, restrict admin privileges, multi factor authentication and backup of important data. Introducing our Critical Violations Security Dashboard Snapshot With KPI Metrics set of slides. The topics discussed in these slides are Critical Violations Security, Dashboard, KPI Metrics. This is an immediately available PowerPoint presentation that can be conveniently customized. Download it and convince your audience.
-
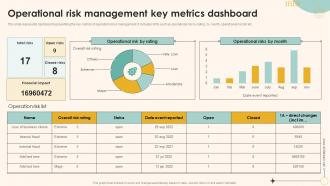 F531 Operational Risk Management Key Metrics Dashboard Snapshot Enterprise Management Mitigation Plan
This slide represents dashboard representing the key metrics of operational risk management. It includes KPIs such as operational risk by rating, by month, operational risk list etc. Present the topic in a bit more detail with this F531 Operational Risk Management Key Metrics Dashboard Snapshot Enterprise Management Mitigation Plan. Use it as a tool for discussion and navigation on Operational, Management, Dashboard. This template is free to edit as deemed fit for your organization. Therefore download it now.
-
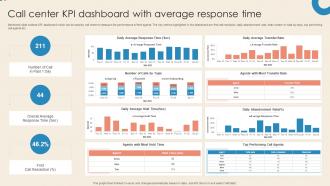 Call Center KPI Dashboard With Average Response Time
Mentioned slide outlines KPI dashboard which can be used by call center to measure the performance of their agents. The key metrics highlighted in the dashboard are first call resolution, daily abandonment rate, total number of calls by topic, top performing call agents etc. Presenting our well structured Call Center KPI Dashboard With Average Response Time. The topics discussed in this slide are First Call Resolution, Overall Average Response Time. This is an instantly available PowerPoint presentation that can be edited conveniently. Download it right away and captivate your audience.
-
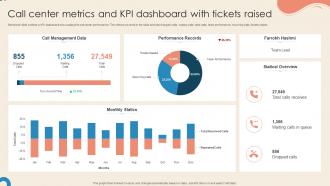 Call Center Metrics And KPI Dashboard With Tickets Raised
Mentioned slide outlines a KPI dashboard showcasing the call center performance. The metrics covered in the slide are total dropped calls, waiting calls, total calls, team performance, recurring calls, tickets raised. Introducing our Call Center Metrics And KPI Dashboard With Tickets Raised set of slides. The topics discussed in these slides are Management Data, Statical, Team Performance. This is an immediately available PowerPoint presentation that can be conveniently customized. Download it and convince your audience.
-
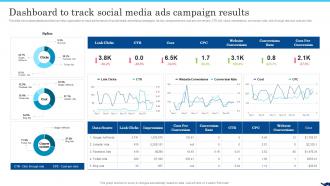 B2b Social Media Marketing For Lead Generation Dashboard To Track Social Media Ads Campaign Results
This slide showcases dashboard that can help organization to track performance of social media advertising campaigns. Its key components are cost per conversion, CTR, link clicks, impressions, conversion rate, click through rate and cost per click. Present the topic in a bit more detail with this B2b Social Media Marketing For Lead Generation Dashboard To Track Social Media Ads Campaign Results. Use it as a tool for discussion and navigation on Dashboard, Organization, Components. This template is free to edit as deemed fit for your organization. Therefore download it now.
-
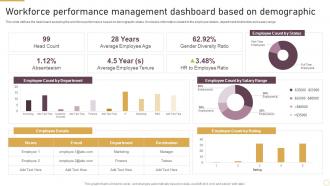 Workforce Performance Management Dashboard Based On Demographic
This slide defines the dashboard analyzing the workforce performance based on demographic status. It includes information related to the employee details, department distribution and salary range. Presenting our well structured Workforce Performance Management Dashboard Based On Demographic. The topics discussed in this slide are Workforce Performance, Management Dashboard, Based On Demographic. This is an instantly available PowerPoint presentation that can be edited conveniently. Download it right away and captivate your audience.
-
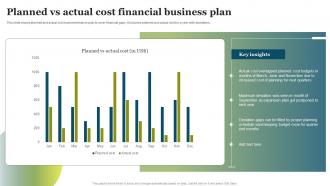 Planned Vs Actual Cost Financial Business Plan
This slide shows planned and actual cost business finance plan to cover financial gaps. It includes planned and actual cost for a year with deviations. Introducing our Planned Vs Actual Cost Financial Business Plan set of slides. The topics discussed in these slides are Planned Vs Actual, Financial Business Plan. This is an immediately available PowerPoint presentation that can be conveniently customized. Download it and convince your audience.
-
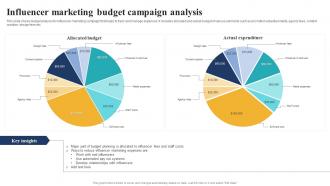 Influencer Marketing Budget Campaign Analysis
This slide shows budget analysis for influencer marketing campaign that helps to track and manage expenses. It includes allocated and actual budget of various elements such as promotion advertisements, agency fees, content creation, design fees etc. Presenting our well structured Influencer Marketing Budget Campaign Analysis. The topics discussed in this slide are Influencer Marketing, Budget Campaign, Analysis. This is an instantly available PowerPoint presentation that can be edited conveniently. Download it right away and captivate your audience.
-
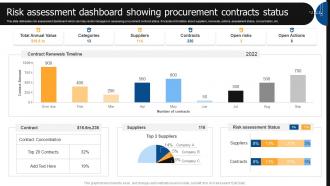 Risk Assessment Dashboard Showing Procurement Contracts Status Vendor Management Automation
This slide delineates risk assessment dashboard which can help vendor managers in assessing procurement contract status. It includes information about suppliers, renewals, actions, assessment status, concentration, etc. Deliver an outstanding presentation on the topic using this Risk Assessment Dashboard Showing Procurement Contracts Status Vendor Management Automation. Dispense information and present a thorough explanation of Assessment, Procurement, Status using the slides given. This template can be altered and personalized to fit your needs. It is also available for immediate download. So grab it now.
-
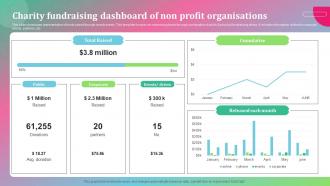 Charity Fundraising Dashboard Of Non Profit Organisations
This slide showcases representation of funds raised through charity events. This template focuses on maximizing funds through combination of public and physical fundraising drives. It includes information related to corporate events, partners, etc. Presenting our well structured Charity Fundraising Dashboard Of Non Profit Organisations. The topics discussed in this slide are Fundraising, Profit, Organisations. This is an instantly available PowerPoint presentation that can be edited conveniently. Download it right away and captivate your audience.
-
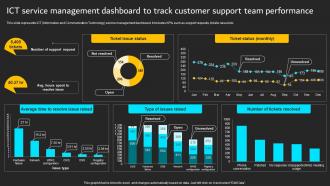 ICT Service Management Dashboard To Track Implementation Of ICT Strategic Plan Strategy SS
This slide represents ICT Information and Communication Technology service management dashboard. It includes KPIs such as support requests, tickets raised etc.Deliver an outstanding presentation on the topic using this ICT Service Management Dashboard To Track Implementation Of ICT Strategic Plan Strategy SS. Dispense information and present a thorough explanation of Ticket Issue Status, Average Time, Resolve Issue using the slides given. This template can be altered and personalized to fit your needs. It is also available for immediate download. So grab it now.
-
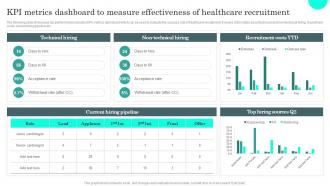 Kpi Metrics Dashboard To Measure General Administration Of Healthcare System
The following slide showcases key performance indicator KPI metrics dashboard which can be used to evaluate the success rate of healthcare recruitment. It covers information about technical and non technical hiring, recruitment costs, current hiring pipeline etc. Deliver an outstanding presentation on the topic using this Kpi Metrics Dashboard To Measure General Administration Of Healthcare System. Dispense information and present a thorough explanation of Technical Hiring, Current Hiring Pipeline, Recruitment using the slides given. This template can be altered and personalized to fit your needs. It is also available for immediate download. So grab it now.
-
 Multinational Firms Year Over Year Revenue Comparison
Introducing our premium set of slides with Multinational Firms Year Over Year Revenue Comparison. Ellicudate the three stages and present information using this PPT slide. This is a completely adaptable PowerPoint template design that can be used to interpret topics like Multinational Firms, Revenue Comparison. So download instantly and tailor it with your information.
-
 Kpi Dashboard For Tracking Customer Retention Delivering Excellent Customer Services
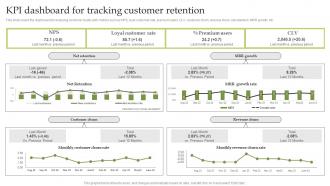
This slide covers the dashboard for analyzing customer loyalty with metrics such as NPS, loyal customer rate, premium users, CLV, customer churn, revenue churn, net retention, MRR growth, etc. Present the topic in a bit more detail with this Kpi Dashboard For Tracking Customer Retention Delivering Excellent Customer Services. Use it as a tool for discussion and navigation on Dashboard, Customer Retention. This template is free to edit as deemed fit for your organization. Therefore download it now.
-
 Overview Of Business Operating In Beverage Guide To Develop Advertising Strategy Mkt SS V
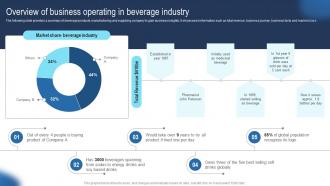
The following slide provides a summary of beverage products manufacturing and supplying company to gain business insights. It showcases information such as total revenue, business journey, business facts and market share.Present the topic in a bit more detail with this Overview Of Business Operating In Beverage Guide To Develop Advertising Strategy Mkt SS V. Use it as a tool for discussion and navigation on Determines Growth Opportunities, Competitive Advantage, Determines Business. This template is free to edit as deemed fit for your organization. Therefore download it now.
-
 Team Roles And Accountabilities Timeline In Scrum Events
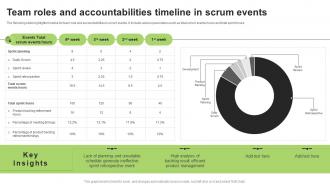
The following slide highlights timeline for team role and accountabilities in scrum events. It include various parameters such as total scrum events hours and total sprint hours. Presenting our well structured Team Roles And Accountabilities Timeline In Scrum Events. The topics discussed in this slide are Team Roles And Accountabilities, Timeline In Scrum Events. This is an instantly available PowerPoint presentation that can be edited conveniently. Download it right away and captivate your audience.
-
 Financial Projections Totspot Investor Funding Elevator Pitch Deck
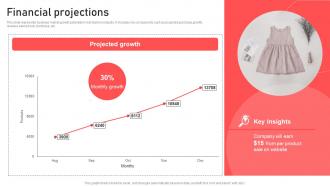
This slide represents business market growth potential in kids fashion industry. It includes key components such as projected purchase growth, revenue earned over purchase, etc. Deliver an outstanding presentation on the topic using this Financial Projections Totspot Investor Funding Elevator Pitch Deck. Dispense information and present a thorough explanation of Website, Product, Growth using the slides given. This template can be altered and personalized to fit your needs. It is also available for immediate download. So grab it now.
-
 0414 pie chart for financial result
We are proud to present our 0414 pie chart for financial result. Activate the energies of your audience with our pie chart for financial result Powerpoint Templates. Get their creative juices flowing with your words. Enhance the stature of your presentation with our pie chart for financial result Powerpoint Templates. Adorn the beauty of your thoughts with their colourful backgrounds.
-
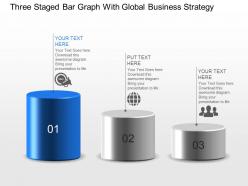 Three staged bar graph with global business strategy powerpoint template slide
We are proud to present our three staged bar graph with global business strategy powerpoint template slide. Graphic of three staged bar graph has been used to craft this power point template diagram. This PPT diagram contains the concept of business strategy .Use this PPT diagram for business and management related presentations.
-
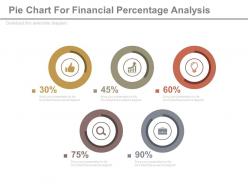 Five pie charts for financial percentage analysis powerpoint slides
Presenting five pie charts for financial percentage analysis powerpoint slides. This Power Point template slide has been crafted with graphic of five pie charts. This PPT slide contains the concept of financial percentage analysis. Use this PPT slide for business and finance related presentations.
-
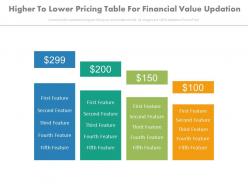 Higher to lower pricing table for financial value updation powerpoint slides
Presenting higher to lower pricing table for financial value updation powerpoint slides. This Power Point template slide has been crafted with graphic of pricing table. This PPT slide contains the concept of higher to lower financial value updation and representation. Use this PPT slide for business and finance related presentations.
-
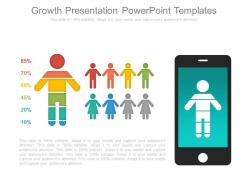 Growth presentation powerpoint templates
Presenting growth presentation powerpoint templates. This is a growth presentation powerpoint templates. This is a one stage process. The stages in this process are business, mobile, presentation,diagram, percentage.
-
 Cost improvement magnifying glass with growth icon
Presenting cost improvement magnifying glass with growth icon. This is a cost improvement magnifying glass with growth icon. This is a four stage process. The stages in this process are cost improvement, cost reduction, budget improvement.
-
 Stock market course showing zigzag arrow upward
Presenting this set of slides with name - Stock Market Course Showing Zigzag Arrow Upward. This is a three stage process. The stages in this process are Bull Market, Financial Market, Stock Market.
-
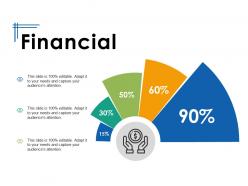 Financial management ppt powerpoint presentation show
Presenting this set of slides with name - Financial Management Ppt Powerpoint Presentation Show. This is a three stages process. The stages in this process are Business, Finance, Analysis, Investment, Marketing.
-
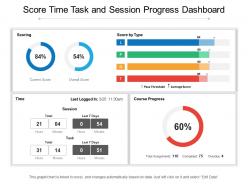 Score time task and session progress dashboard
Presenting this set of slides with name Score Time Task And Session Progress Dashboard. The topics discussed in these slides are Progress Dashboard, Chart And Graph, Finance, Marketing. This is a completely editable PowerPoint presentation and is available for immediate download. Download now and impress your audience.
-
 Piggy bank with dollar icon for savings
Presenting this set of slides with name Piggy Bank With Dollar Icon For Savings. This is a three stage process. The stages in this process are Piggy Bank With Dollar Icon For Savings. This is a completely editable PowerPoint presentation and is available for immediate download. Download now and impress your audience.
-
 Finance Background Management Business Arrows Dollar Experience
This complete deck covers various topics and highlights important concepts. It has PPT slides which cater to your business needs. This complete deck presentation emphasizes Finance Background Management Business Arrows Dollar Experience and has templates with professional background images and relevant content. This deck consists of total of eleven slides. Our designers have created customizable templates, keeping your convenience in mind. You can edit the colour, text and font size with ease. Not just this, you can also add or delete the content if needed. Get access to this fully editable complete presentation by clicking the download button below.
-
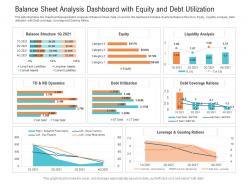 Balance sheet analysis dashboard with equity and debt utilization powerpoint template
This slide Illustrates the Graphical Representation Analysis of Balance Sheet. Data covered in this dashboard includes Quarterly Balance Structure, Equity, Liquidity Analysis, Debt utilization with Debt coverage, Leverage and Gearing Ratios. This is a Balance Sheet Analysis Dashboard With Equity And Debt Utilization Powerpoint Template drafted with a diverse set of graphics, that can be reformulated and edited as per your needs and requirements. Just download it in your system and make use of it in PowerPoint or Google Slides, depending upon your presentation preferences.
-
 Cyber risk analytics dashboard with different incidents powerpoint template
This slide Covers the Graphical Representation of Cyber Analytics. Data covered in this dashboard includes Number of incident per incident type and malware type with Number of incident per Malware type and broken by security level. This is a Cyber Risk Analytics Dashboard With Different Incidents Powerpoint Template drafted with a diverse set of graphics, that can be reformulated and edited as per your needs and requirements. Just download it in your system and make use of it in PowerPoint or Google Slides, depending upon your presentation preferences.
-
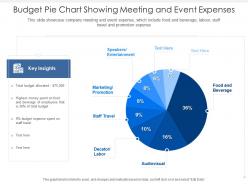 Budget pie chart showing meeting and event expenses
This slide showcase company meeting and event expense, which include food and beverage, labour, staff travel and promotion expense. Introducing our Budget Pie Chart Showing Meeting And Event Expenses set of slides. The topics discussed in these slides are Budget Pie Chart Showing Meeting And Event Expenses. This is an immediately available PowerPoint presentation that can be conveniently customized. Download it and convince your audience.
-
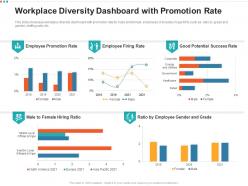 Workplace diversity dashboard with promotion rate
This slide showcase workplace diversity dashboard with promotion rate for male and female employees. It includes major KPIs such as ratio by grade and gender, staffing ratio etc. Introducing our Workplace Diversity Dashboard With Promotion Rate set of slides. The topics discussed in these slides are Workplace Diversity Dashboard With Promotion Rate. This is an immediately available PowerPoint presentation that can be conveniently customized. Download it and convince your audience.
-
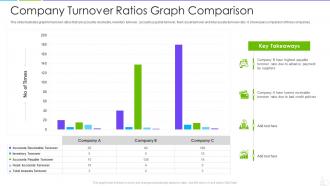 Company turnover ratios graph comparison
Introducing our Company Turnover Ratios Graph Comparison set of slides. The topics discussed in these slides are Company Turnover Ratios Graph Comparison. This is an immediately available PowerPoint presentation that can be conveniently customized. Download it and convince your audience.
-
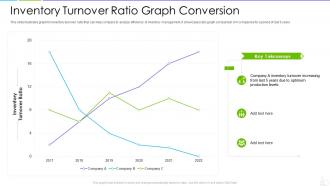 Inventory turnover ratio graph conversion
Introducing our Inventory Turnover Ratio Graph Conversion set of slides. The topics discussed in these slides are Inventory Turnover Ratio Graph Conversion. This is an immediately available PowerPoint presentation that can be conveniently customized. Download it and convince your audience.
-
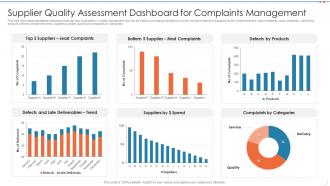 Supplier quality assessment dashboard for complaints management
Introducing our Supplier Quality Assessment Dashboard For Complaints Management set of slides. The topics discussed in these slides are Supplier Quality Assessment Dashboard For Complaints Management. This is an immediately available PowerPoint presentation that can be conveniently customized. Download it and convince your audience.
-
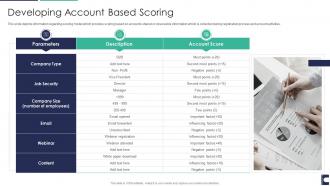 How to manage accounts to drive sales developing account based scoring
This slide depicts information regarding scoring model which provides scoring based on accounts shared or observable information which is collected during registration process and account activities. Increase audience engagement and knowledge by dispensing information using How To Manage Accounts To Drive Sales Developing Account Based Scoring. This template helps you present information on one stages. You can also present information on Parameters, Account Score, Content, Webinar using this PPT design. This layout is completely editable so personaize it now to meet your audiences expectations.


