Investment Valuation Ratios Powerpoint Presentation Slides
Searching for investment valuation ratios PowerPoint presentation slides? Our benefit cost ratio PPT templates will serve your purpose. These company valuation correlation presentation diagrams will help you estimate the attractiveness of the potential investment. Our price to earnings ratio PowerPoint illustrations cover all the relevant diagrams such as dividend yield, price to sales, cash flow coverage and enterprise value multiple. P/E ratio PPT templates can also be utilized for price/earnings to growth proportion, payout scale, venture valuation indicator, financial scale, earning indicators, accounting relationship, capital valuation indicator, price to cash flow ratio, BCR, stock valuation fraction, company valuation ratio, operating cash flow, gross margin, investment potential and many more. Our revenue valuation indicator presentation visuals have been designed by the highly qualified design team and with extensive research. Furthermore, our payout fraction PPT visuals help you figure out the investment cost with respect to the value of owning that investment. Download our investment ppt templates today!. Anticipate hassles with our Investment Valuation Ratios Powerpoint Presentation Slides. Develop a feel for difficulties ahead.
- Google Slides is a new FREE Presentation software from Google.
- All our content is 100% compatible with Google Slides.
- Just download our designs, and upload them to Google Slides and they will work automatically.
- Amaze your audience with SlideTeam and Google Slides.
-
Want Changes to This PPT Slide? Check out our Presentation Design Services
- WideScreen Aspect ratio is becoming a very popular format. When you download this product, the downloaded ZIP will contain this product in both standard and widescreen format.
-

- Some older products that we have may only be in standard format, but they can easily be converted to widescreen.
- To do this, please open the SlideTeam product in Powerpoint, and go to
- Design ( On the top bar) -> Page Setup -> and select "On-screen Show (16:9)” in the drop down for "Slides Sized for".
- The slide or theme will change to widescreen, and all graphics will adjust automatically. You can similarly convert our content to any other desired screen aspect ratio.
Compatible With Google Slides

Get This In WideScreen
You must be logged in to download this presentation.
PowerPoint presentation slides
These templates are 100% editable. Our PowerPoint presentation slides are quickly downloadable. These slide consists of 29 slides and comprises all the necessary information. High-resolution template designs. These slides have compatible presentation layout. Our PPT visuals can be easily converted to PDF and JPG formats. Our presentation visuals can be used by investors, promoters, marketers, business professionals, sales and many more. We have used standardized colors which contrast and compliment.The stages in this process are investment valuation ratios, investment potential, pe ratio.
People who downloaded this PowerPoint presentation also viewed the following :
Content of this Powerpoint Presentation
Slide 1: This slide introduces Investment Valuation Ratios. State your company name and begin.
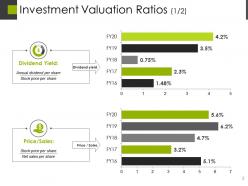
Slide 2: This slide presents Investment Valuation Ratios (1/2) in a graphical form showing- Dividend Yield, Price / Sales.
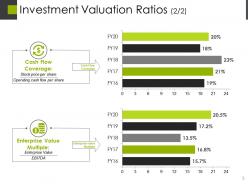
Slide 3: This is also Investment Valuation Ratios (2/2) graph slide showing- Enterprise value Multiple, Cash Flow Coverage.
Slide 4: This slide is titled Additional Slides to move forward. You can change the slide content as per need.
Slide 5: This slide showcases Our Mission. Show your company mission and goals here.
Slide 6: This slide helps depict Our Team with text boxes.
Slide 7: This is an About Us slide. State team/ company specifications here.
Slide 8: This is a Comparison slide with mind map imagery showing Maximum %, Minimum %.
Slide 9: This is Our Goal slide. State your goals here.
Slide 10: This is a Financial slide with- Minimum, Medium and Maximum parameters.
Slide 11: This is a Quotes slide to convey company/ organization message, beliefs etc. You may change the slide content as per need.
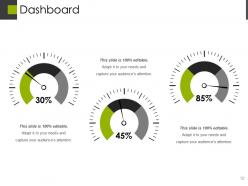
Slide 12: This is a Dashboard slide to show information in percentages etc.
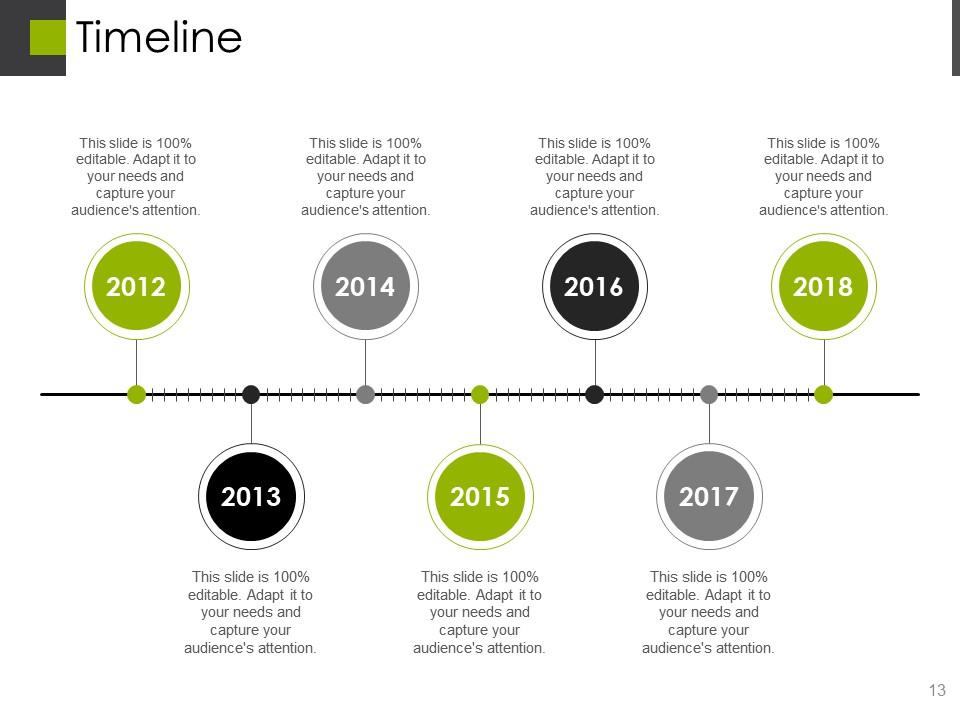
Slide 13: This slide presents a Timeline to show growth, milestones etc.
Slide 14: This is a Location slide to show growth, presence etc.
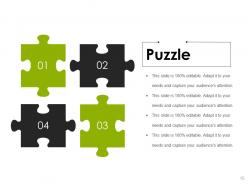
Slide 15: This is a Puzzle pieces slide to show information, specifications etc.
Slide 16: This is a Target image slide. State targets, etc. here.
Slide 17: This is a Coffee Break image slide to halt. Modify/ alter content as per need.
Slide 18: This is a Mind map image slide to show information, specifications etc.
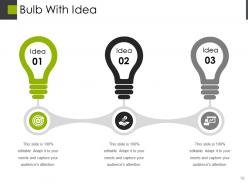
Slide 19: This is a Bulb With Idea image slide to show ideas, innovative information etc.
Slide 20: This is a Magnifying Glass image slide to show information, specifications etc.
Slide 21: This slide forwards to Charts & Graphs. Modify/ alter content as per need.
Slide 22: This is a Clustered Column slide to present product/ entity comparison, specifications etc.
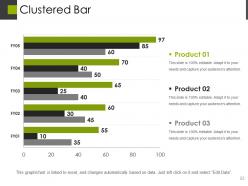
Slide 23: This slide shows a Clustered Bar for product/ entity comparison.
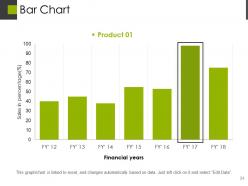
Slide 24: This is a Bar Chart slide to showcase product/ entity comparison.
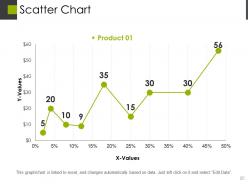
Slide 25: This is a Scatter Chart slide to show product/ entity growth, comparison etc.
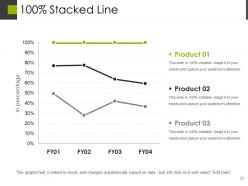
Slide 26: This slide presents 100% Stacked Line chart to show product/ entity growth, comparison etc.
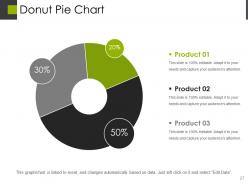
Slide 27: This is a Donut Pie Chart slide to present product/ entity comparison, specifications etc.
Slide 28: This slide presents Stack Area Chart to show product/ entity comparison, specifications etc.
Slide 29: This is Thank You slide stating Address# street number, city, state, Contact Numbers, Email Address.
Investment Valuation Ratios Powerpoint Presentation Slides with all 29 slides:
Give folks hints on how to improve with our Investment Valuation Ratios Powerpoint Presentation Slides. Advise folks to introspect.
-
Excellent work done on template design and graphics.
-
Amazing product with appealing content and design.


