Financial Services Advisor PowerPoint Templates, Presentation Images & PPT Templates
- Sub Categories
-
- 30 60 90 Day Plan
- About Us Company Details
- Action Plan
- Agenda
- Annual Report
- Audit Reports
- Balance Scorecard
- Brand Equity
- Business Case Study
- Business Communication Skills
- Business Plan Development
- Business Problem Solving
- Business Review
- Capital Budgeting
- Career Planning
- Change Management
- Color Palettes
- Communication Process
- Company Location
- Company Vision
- Compare
- Competitive Analysis
- Corporate Governance
- Cost Reduction Strategies
- Custom Business Slides
- Customer Service
- Dashboard
- Data Management
- Decision Making
- Digital Marketing Strategy
- Digital Transformation
- Disaster Management
- Diversity
- Equity Investment
- Financial Analysis
- Financial Services
- Financials
- Growth Hacking Strategy
- Human Resource Management
- Innovation Management
- Interview Process
- Knowledge Management
- Leadership
- Lean Manufacturing
- Legal Law Order
- Management
- Market Segmentation
- Marketing
- Media and Communication
- Meeting Planner
- Mergers and Acquisitions
- Metaverse
- Newspapers
- Operations and Logistics
- Organizational Structure
- Our Goals
- Performance Management
- Pitch Decks
- Pricing Strategies
- Process Management
- Product Development
- Product Launch Ideas
- Product Portfolio
- Project Management
- Purchasing Process
- Quality Assurance
- Quotes and Testimonials
- Real Estate
- Risk Management
- Sales Performance Plan
- Sales Review
- SEO
- Service Offering
- Six Sigma
- Social Media and Network
- Software Development
- Solution Architecture
- Stock Portfolio
- Strategic Management
- Strategic Planning
- Supply Chain Management
- Swimlanes
- System Architecture
- Team Introduction
- Testing and Validation
- Thanks-FAQ
- Time Management
- Timelines Roadmaps
- Value Chain Analysis
- Value Stream Mapping
- Workplace Ethic
-
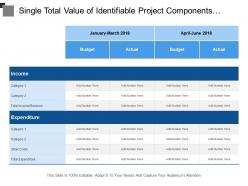 Single total value of identifiable project components estimating budget vs actual on monthly basis
Presenting this set of slides with name - Single Total Value Of Identifiable Project Components Estimating Budget Vs Actual On Monthly Basis. This is a two stage process. The stages in this process are Forecast Vs Actual Budget, Actual Vs Budget, Marketing Budget.
-
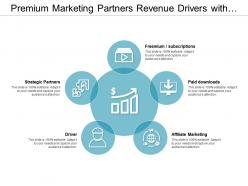 Premium marketing partners revenue drivers with icons
Presenting this set of slides with name - Premium Marketing Partners Revenue Drivers With Icons. This is a five stage process. The stages in this process are Revenue Drivers, Income Drivers, Earning Drivers.
-
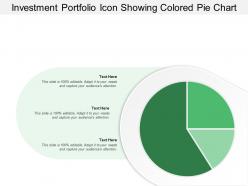 Investment portfolio icon showing colored pie chart
Presenting this set of slides with name - Investment Portfolio Icon Showing Colored Pie Chart. This is a three stage process. The stages in this process are Investment Portfolio, Funding Portfolio, Expenditure Portfolio.
-
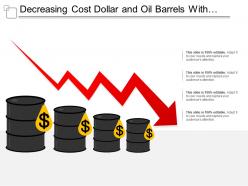 Decreasing cost dollar and oil barrels with graph falling
Presenting this set of slides with name - Decreasing Cost Dollar And Oil Barrels With Graph Falling. This is a four stage process. The stages in this process are Data Science, Information Science, Data Analysis.
-
 Decreasing cost showing dollar and downward arrow
Presenting this set of slides with name - Decreasing Cost Showing Dollar And Downward Arrow. This is a two stage process. The stages in this process are Data Science, Information Science, Data Analysis.
-
 Portfolio risk and return analysis powerpoint presentation slides
Presenting this set of slides with name - Portfolio Risk And Return Analysis Powerpoint Presentation Slides. Enhance your audiences knowledge with this well researched complete deck. Showcase all the important features of the deck with perfect visuals. This deck comprises of total of twenty nine slides with each slide explained in detail. Each template comprises of professional diagrams and layouts. Our professional PowerPoint experts have also included icons, graphs and charts for your convenience. All you have to do is DOWNLOAD the deck. Make changes as per the requirement. Yes, these PPT slides are completely customizable. Edit the colour, text and font size. Add or delete the content from the slide. And leave your audience awestruck with the professionally designed Portfolio Risk And Return Analysis Powerpoint Presentation Slides complete deck.
-
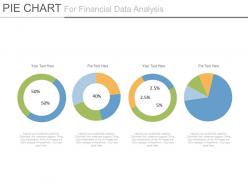 Four pie charts for financial data analysis powerpoint slides
Presenting four pie charts for financial data analysis powerpoint slides. This Power Point template diagram has been crafted with graphic of four pie charts diagram. This PPT diagram contains the concept of financial data analysis. Use this PPT diagram for business and finance related presentations.
-
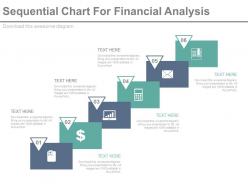 Six staged sequential chart for financial analysis powerpoint slides
Presenting six staged sequential chart for financial analysis powerpoint slides. This Power Point template diagram has been crafted with graphic of six staged sequential chart and percentage diagram. This PPT diagram contains the concept of financial analysis. Use this PPT diagram for business and finance related presentations.
-
 Computer with dollar financial literacy icon
Presenting this set of slides with name - Computer With Dollar Financial Literacy Icon. This is a three stage process. The stages in this process are Financial Literacy, Financial Education, Financial Knowledge.
-
 Bank icon black image with dollar on top
Presenting this set of slides with name - Bank Icon Black Image With Dollar On Top. This is a one stage process. The stages in this process are Bank Icon, Finance Icons, Money Icon.
-
 Atm icon showing machine with cash
Presenting this set of slides with name - Atm Icon Showing Machine With Cash. This is a four stages process. The stages in this process are Atm Icon, Payment Card Icon, Bank Card Icon.
-
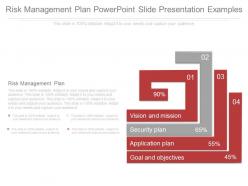 Risk management plan powerpoint slide presentation examples
Presenting risk management plan powerpoint slide presentation examples. This is a risk management plan powerpoint slide presentation examples. This is a four stage process. The stages in this process are vision and mission, security plan, application plan, goal and objectives.
-
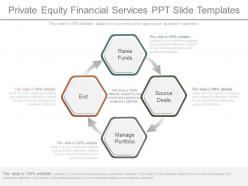 Private equity financial services ppt slide templates
Presenting private equity financial services ppt slide templates. This is a private equity financial services ppt slide templates. This is a four stage process. The stages in this process are raise funds, source deals, manage portfolio, exit.
-
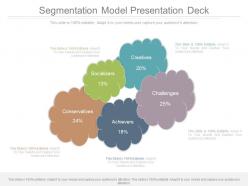 Segmentation model presentation deck
Presenting segmentation model presentation deck. This is a segmentation model presentation deck. This is a five stage process. The stages in this process are creatives, socializers, conservatives, challenges, achievers.
-
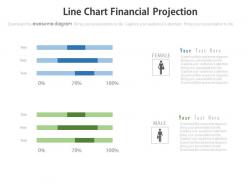 Two line charts financial projection powerpoint slides
Presenting two line charts financial projection powerpoint slides. This Power Point template slide has been crafted with graphic of two line chart. This PPT slide contains the concept of financial projection. Use this PPT slide for business and finance related presentations.
-
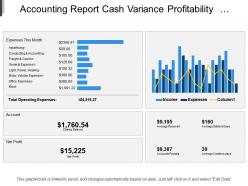 Accounting report cash variance profitability balance sheet performance position
Presenting, accounting report cash variance profitability balance sheet performance position PPT deck. Comprising of high-quality design which is completely editable in terms of adjusting the font type and size, including the text with your data or changing the color schemes. The content has been well-researched by our team to include your flexible data. All these slides are fully editable in PowerPoint and well compatible with Google Slides and available in the fullscreen version.
-
 Machine learning use cases financial services manufacturing ppt powerpoint presentation layouts examples
Presenting this set of slides with name Machine Learning Use Cases Financial Services Manufacturing Ppt Powerpoint Presentation Layouts Examples. This is a six stage process. The stages in this process are Manufacturing, Retail, Financial Services, Technology, Strategy. This is a completely editable PowerPoint presentation and is available for immediate download. Download now and impress your audience.
-
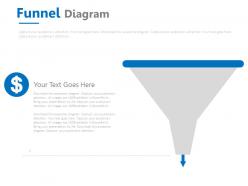 Funnel diagram with dollar symbol powerpoint slides
Presenting funnel diagram with dollar symbol powerpoint slides. This Power Point template slide has been crafted with graphic of funnel diagram and dollar symbol. This PPT slide contains the concept of financial analysis and process flow. Use this PPT slide for business and finance related presentations.
-
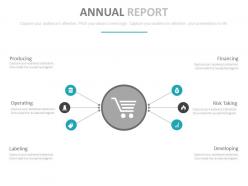 Annual report with financial analysis powerpoint slides
Presenting annual report with financial analysis powerpoint slides. This Power Point template diagram has been crafted with graphic of annual report diagram. This PPT diagram contains the concept of financial analysis. Use this PPT diagram for business and finance related presentations.
-
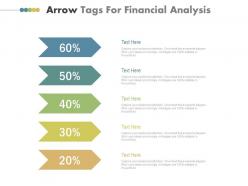 Five tags arrow tags for financial analysis powerpoint slides
Presenting five tags arrow tags for financial analysis powerpoint slides. This Power Point template diagram has been crafted with graphic of five arrow tags diagram. This PPT diagram contains the concept of financial analysis. Use this PPT diagram for business and finance related presentations.
-
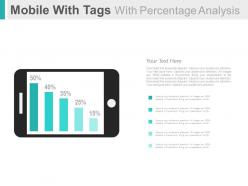 Mobile with tags with percentage analysis powerpoint slides
Presenting mobile with tags with percentage analysis powerpoint slides. This Power Point template diagram has been crafted with graphic of mobile with tags and percentage diagram. This PPT diagram contains the concept of banking solutions analysis. Use this PPT diagram for business and finance related presentations.
-
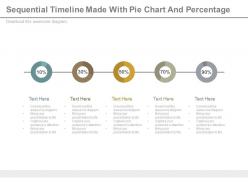 Sequential timeline made with pie chart and percentage powerpoint slides
Presenting sequential timeline made with pie chart and percentage powerpoint slides. This Power Point template slide has been crafted with graphic of sequential timeline and pie chart This PPT slide contains the concept of financial data analysis and planning. Use this PPT slide for business and finance related presentations.
-
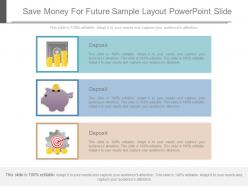 Original save money for future sample layout powerpoint slide
Presenting original save money for future sample layout powerpoint slide. This is a save money for future sample layout powerpoint slide. This is a three stage process. The stages in this process are deposit.
-
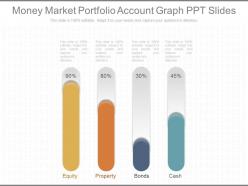 Different money market portfolio account graph ppt slides
Presenting different money market portfolio account graph ppt slides. This is a money market portfolio account graph ppt slides. This is a four stage process. The stages in this process are equity, property, bonds, cash.
-
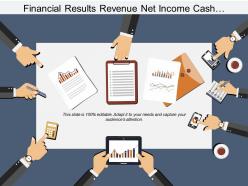 Financial results revenue net income cash flow hands
Presenting this set of slides with name - Financial Results Revenue Net Income Cash Flow Hands. This is a eight stage process. The stages in this process are Financial Results, Financial Report, Accounting Results.
-
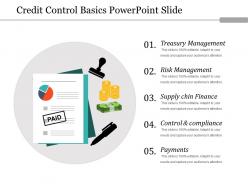 Credit control basics powerpoint slide
Presenting credit control basics powerpoint slide. This is a credit control basics powerpoint slide. This is a five stage process. The stages in this process are financial control, credit control.
-
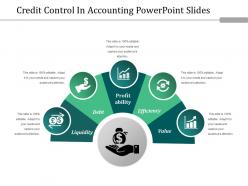 Credit control in accounting powerpoint slides
Presenting credit control in accounting powerpoint slides. This is a credit control in accounting powerpoint slides. This is a five stage process. The stages in this process are financial control, credit control.
-
 Five major steps of accounting process cycle 3d man holding stick
Presenting this set of slides with name - Five Major Steps Of Accounting Process Cycle 3d Man Holding Stick. This is a five stage process. The stages in this process are Accounting Process, Accounting Cycle, Accounting Management.
-
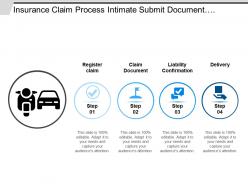 Insurance claim process intimate submit documents security pay
Presenting this set of slides with name - Insurance Claim Process Intimate Submit Documents Security Pay. This is a four stage process. The stages in this process are Insurance Claim Process, Insurance Claim Steps, Insurance Claim Procedure.
-
 Financial management icon ppt layout
Presenting this set of slides with name - Financial Management Icon Ppt Layout. This is a two stage process. The stages in this process are Financial State, Financial Management, Economy.
-
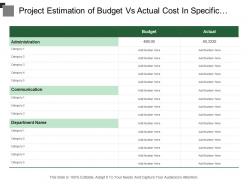 Project estimation of budget vs actual cost in specific departments include administration and communication
Presenting this set of slides with name - Project Estimation Of Budget Vs Actual Cost In Specific Departments Include Administration And Communication. This is a five stage process. The stages in this process are Forecast Vs Actual Budget, Actual Vs Budget, Marketing Budget.
-
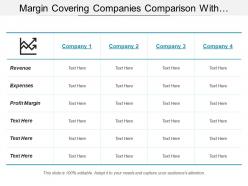 Margin covering companies comparison with revenue expenses and profit
Presenting this set of slides with name - Margin Covering Companies Comparison With Revenue Expenses And Profit. This is a four stage process. The stages in this process are Edges, Margin, Limits.
-
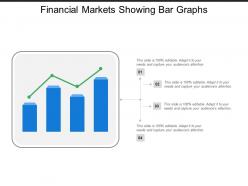 Financial markets showing bar graphs
Presenting this set of slides with name - Financial Markets Showing Bar Graphs. This is a four stage process. The stages in this process are Bull Market, Financial Markets, Stock Market.
-
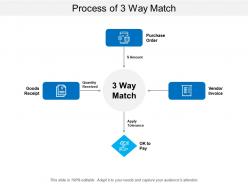 Process of 3 way match
Presenting this set of slides with name - Process Of 3 Way Match. This is a four stage process. The stages in this process are Three Way Match,Three Document,Accounting.
-
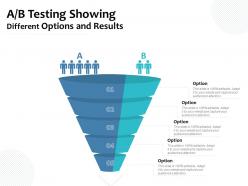 Ab testing showing different options and results
Presenting this set of slides with name AB Testing Showing Different Options And Results. This is a five stage process. The stages in this process are AB Testing, Graphical Representation, Social. This is a completely editable PowerPoint presentation and is available for immediate download. Download now and impress your audience.
-
 Time Reduction Gear Financial Service Analogue Downward Arrow
Deliver a lucid presentation by utilizing this Time Reduction Gear Financial Service Analogue Downward Arrow. Use it to present an overview of the topic with the right visuals, themes, shapes, and graphics. This is an expertly designed complete deck that reinforces positive thoughts and actions. Use it to provide visual cues to your audience and help them make informed decisions. A wide variety of discussion topics can be covered with this creative bundle such as Time Reduction, Gear, Financial, Service, Analogue. All the twelve slides are available for immediate download and use. They can be edited and modified to add a personal touch to the presentation. This helps in creating a unique presentation every time. Not only that, with a host of editable features, this presentation can be used by any industry or business vertical depending on their needs and requirements. The compatibility with Google Slides is another feature to look out for in the PPT slideshow.
-
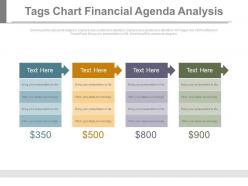 Four tags chart for financial agenda analysis powerpoint slides
Presenting four tags chart for financial agenda analysis powerpoint slides. This Power Point template slide has been crafted with graphic of four tags chart. This PPT slide contains the concept of financial agenda analysis. Use this PPT slide for business and finance related presentations.
-
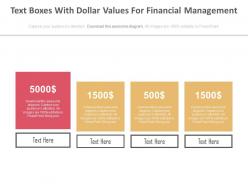 Four text boxes with dollar values for financial management powerpoint slides
Presenting four text boxes with dollar values for financial management powerpoint slides. This Power Point template slide has been crafted with graphic of four text boxes and dollar diagram. This PPT slide contains the concept of financial management. Use this PPT slide for business and finance related presentations.
-
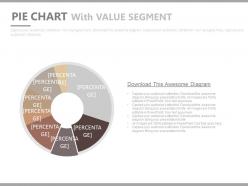 Pie chart with seven staged value segment powerpoint slides
Presenting pie chart with seven staged value segment powerpoint slides. This is a pie chart with seven staged value segment powerpoint slides. This is a one stage process. The stages in this process are financials.
-
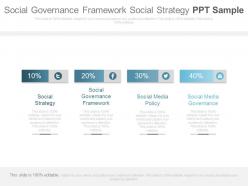 Social governance framework social strategy ppt sample
Presenting social governance framework social strategy ppt sample. This is a social governance framework social strategy ppt sample. This is a four stage process. The stages in this process are strategy, finance, marketing, business.
-
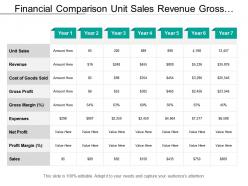 Financial comparison unit sales revenue gross profit expenses
Presenting this set of slides with name - Financial Comparison Unit Sales Revenue Gross Profit Expenses. This is a seven stage process. The stages in this process are Financial Comparison, Financial Analysis, Financial Statement.
-
 Financial comparison weighting bit coin crypto currency dollar
Presenting this set of slides with name - Financial Comparison Weighting Bit Coin Crypto Currency Dollar. This is a two stage process. The stages in this process are Financial Comparison, Financial Analysis, Financial Statement.
-
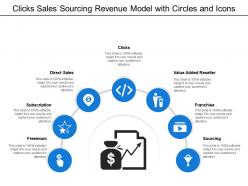 Clicks sales sourcing revenue model with circles and icons
Presenting this set of slides with name - Clicks Sales Sourcing Revenue Model With Circles And Icons. This is a seven stage process. The stages in this process are Revenue Framework, Revenue Model, Business Model.
-
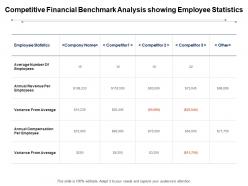 Competitive financial benchmark analysis showing employee statistics
Presenting this set of slides with name - Competitive Financial Benchmark Analysis Showing Employee Statistics. This is a five stage process. The stages in this process are Financial Benchmark, Financial Analysis, Financial Management.
-
 Payment card showing online shopping
Presenting this set of slides with name - Payment Card Showing Online Shopping. This is a two stage process. The stages in this process are Payment Card, Cash Card, Bank Card.
-
 Payment card with mobile and dollar
Presenting this set of slides with name - Payment Card With Mobile And Dollar. This is a three stage process. The stages in this process are Payment Card, Cash Card, Bank Card.
-
 Four colored arrows in envelop for communication strategy powerpoint slides
Presenting four colored arrows in envelop for communication strategy powerpoint slides. This Power Point template slide has been crafted with graphic of four colored arrows in envelop. This PPT slide contains the concept of business communication strategy. Use this PPT slide for business and finance related presentations.
-
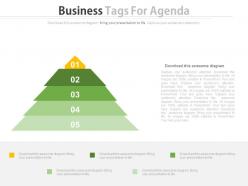 Five staged business tags for agenda powerpoint slides
Presenting five staged business tags for agenda powerpoint slides. This Power Point template diagram has been crafted with graphic of five staged business tags diagram. This PPT diagram contains the concept of business agenda analysis. Use this PPT diagram for business and finance related presentations.
-
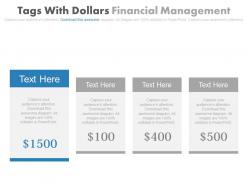 Four staged tags with dollars financial management powerpoint slides
Presenting four staged tags with dollars financial management powerpoint slides. This Power Point template diagram has been crafted with graphic of four staged tags and dollar diagram. This PPT diagram contains the concept of financial management representation. Use this PPT diagram for business and finance related presentations.
-
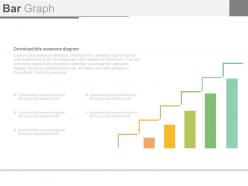 Colored bar graph for growth of business powerpoint slides
Presenting colored bar graph for growth of business powerpoint slides. This Power Point template diagram slide has been crafted with graphic of colored bar graph diagram. This PPT diagram contains the concept of business growth representation. Use this PPT diagram for business and finance related presentations.
-
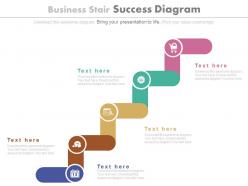 Five staged business stair success diagram powerpoint slides
Presenting five staged business stair success diagram powerpoint slides. This Power Point template diagram slide has been crafted with graphic of five staged business stair diagram. This PPT diagram contains the concept of business success representation. Use this PPT diagram for business and marketing related presentations.
-
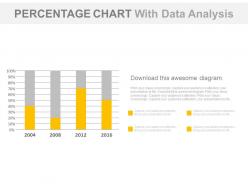 Percentage chart with data analysis powerpoint slides
Presenting percentage chart with data analysis powerpoint slides. This Power Point template slide has been crafted with graphic of percentage chart. This PPT slide contains the concept of data analysis. Use this PPT slide for business and finance related presentations.
-
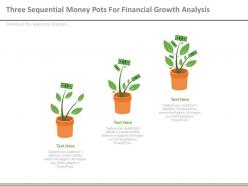 Three sequential money pots for financial growth analysis powerpoint slides
Presenting three sequential money pots for financial growth analysis powerpoint slides. This Power Point template slide has been crafted with graphic of three sequential money pots. This PPT slide contains the concept of financial growth analysis. Use this PPT slide for business and finance related presentations.
-
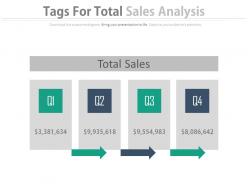 Four tags for total sales analysis powerpoint slides
Presenting four tags for total sales analysis powerpoint slides. This Power Point template diagram with graphic of four tags and icons. This PPT diagram contains the concept of total sales analysis. Use this PPT diagram for business and finance related presentations.
-
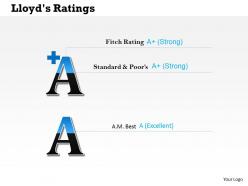 0414 financial result ratings diagram
We are proud to present our 0414 financial result ratings diagram. Our financial result ratings diagram Powerpoint Templates will provide weight to your words. They will bring out the depth of your thought process. Words like arrows fly straight and true. Use our financial result ratings diagram Powerpoint Templates to make them hit bullseye everytime.
-
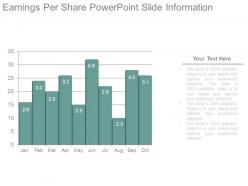 Earnings per share powerpoint slide information
Presenting earnings per share powerpoint slide information. This is a earnings per share powerpoint slide information. This is a ten stage process. The stages in this process are business, growth, strategy, management, success.
-
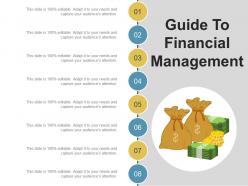 Guide to financial management ppt design
SlideTeam would like to present to all of you its totally adjustable guide to financial management PPT design. The business template has been designed in such a manner that you can alter the font style, font color, and font size of the text used in it. The slideshow after being downloaded can be viewed in standard size display ratio of 4:3 or widescreen display ratio of 16:9. The size, color, and orientation of all the other diagrams in the slides are also customizable.
-
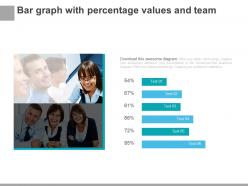 Bar graph with percentage values and team powerpoint slides
Presenting bar graph with percentage values and team powerpoint slides. This is a bar graph with percentage values and team powerpoint slides. This is a six stage process. The stages in this process are financials.
-
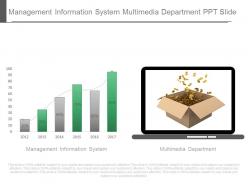 Management information system multimedia department ppt slide
Presenting management information system multimedia department ppt slide. This is a management information system multimedia department ppt slide. This is a two stage process. The stages in this process are management, finance, technology.
-
 Financial strategy arrow upwards dollar icon
Presenting this set of slides with name Financial Strategy Arrow Upwards Dollar Icon. This is a one stage process. The stages in this process are Financial Strategy, Business Strategy, Cash Management. This is a completely editable PowerPoint presentation and is available for immediate download. Download now and impress your audience.


