Actual Cost Vs Plan Projection Powerpoint Presentation Slides
Are you facing trouble in creating a professional presentation on the concept of actual cost vs plan projection? Do not worry! SlideTeam has come up with the predesigned actual cost vs plan projection PowerPoint presentation slides. Using this actual vs forecast PPT presentation, you can represent an organization future revenue and expenditure. This planning budgeting and forecasting presentation PPT includes a template on relevant sub-topics such as actual cost vs budget, month wise budget forecasting, overhead cost budget analysis, quarterly budget analysis, master budget vs actual variance analysis, actual vs budget analysis, actual vs target variance, budget vs plan vs forecast, forecast vs actual budget, and forecast and project. It also covers a template on budget vs forecast vs. actual. With the assistance of these financial planning PPT slides, you will be able to achieve an organization economic prosperity. Employ this PPT presentation to compare the past and present report to predict the future performance of an organization. Our PowerPoint designers have used visuals and images of charts and graphs so that you can quickly represent the financial statistics of the business. So, do not wait; download this actual vs. forecast PPT presentation. Achieve the correct ambiance with our Actual Cost Vs Plan Projection Powerpoint Presentation Slides. Create the exact atmosphere you desire.
Are you facing trouble in creating a professional presentation on the concept of actual cost vs plan projection? Do not wor..
- Google Slides is a new FREE Presentation software from Google.
- All our content is 100% compatible with Google Slides.
- Just download our designs, and upload them to Google Slides and they will work automatically.
- Amaze your audience with SlideTeam and Google Slides.
-
Want Changes to This PPT Slide? Check out our Presentation Design Services
- WideScreen Aspect ratio is becoming a very popular format. When you download this product, the downloaded ZIP will contain this product in both standard and widescreen format.
-

- Some older products that we have may only be in standard format, but they can easily be converted to widescreen.
- To do this, please open the SlideTeam product in Powerpoint, and go to
- Design ( On the top bar) -> Page Setup -> and select "On-screen Show (16:9)” in the drop down for "Slides Sized for".
- The slide or theme will change to widescreen, and all graphics will adjust automatically. You can similarly convert our content to any other desired screen aspect ratio.
Compatible With Google Slides

Get This In WideScreen
You must be logged in to download this presentation.
PowerPoint presentation slides
Presenting Actual Cost Vs Plan Projection PowerPoint Presentation Slides. This presentation comprises 25 professionally designed PowerPoint templates, all of them being hundred percent adjustable in PowerPoint. Fonts type and dimension, colors and slide background of the PowerPoint slides are adjustable. Employ data driven charts and graphs to highlight the stats. You can download the PPT slides in both broad view (16:9) and standard screen (4:3) aspect dimension. The PowerPoint slides are entirely flexible with Google Slides and other online programmes. The presentation can be saved in JPG or PDF format. The presentation slides can be personalized by adding an organization name or logo. Premium product support is provided.
People who downloaded this PowerPoint presentation also viewed the following :
Content of this Powerpoint Presentation
Slide 1: This slide introduces Actual Cost Vs Plan Projection. State Your Company Name and begin.
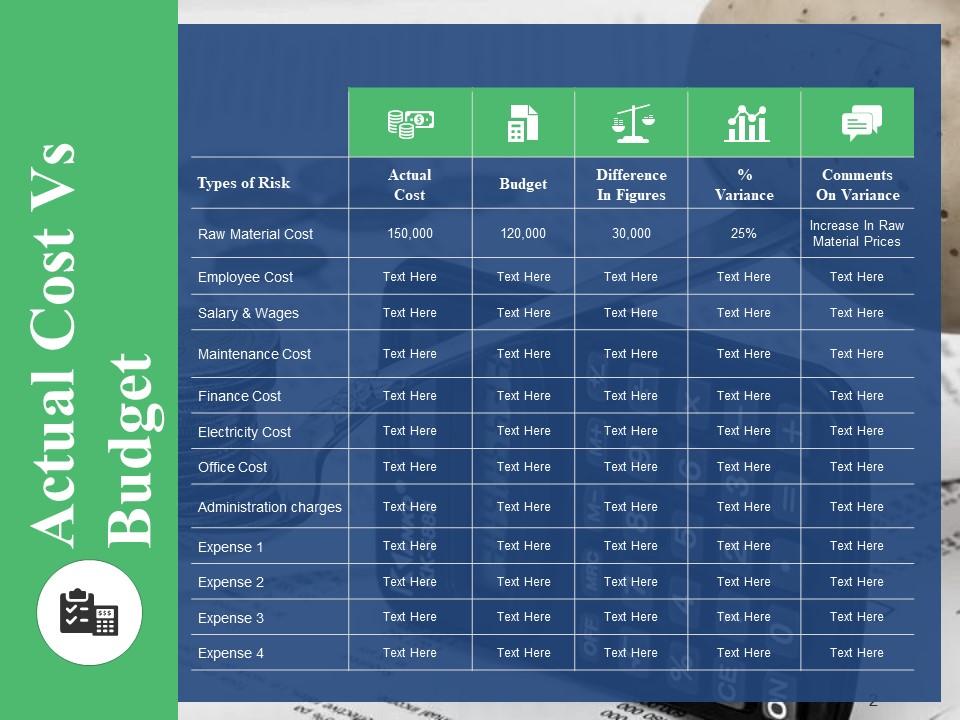
Slide 2: This slide presents Actual Cost Vs Budget table and use it to add the data.
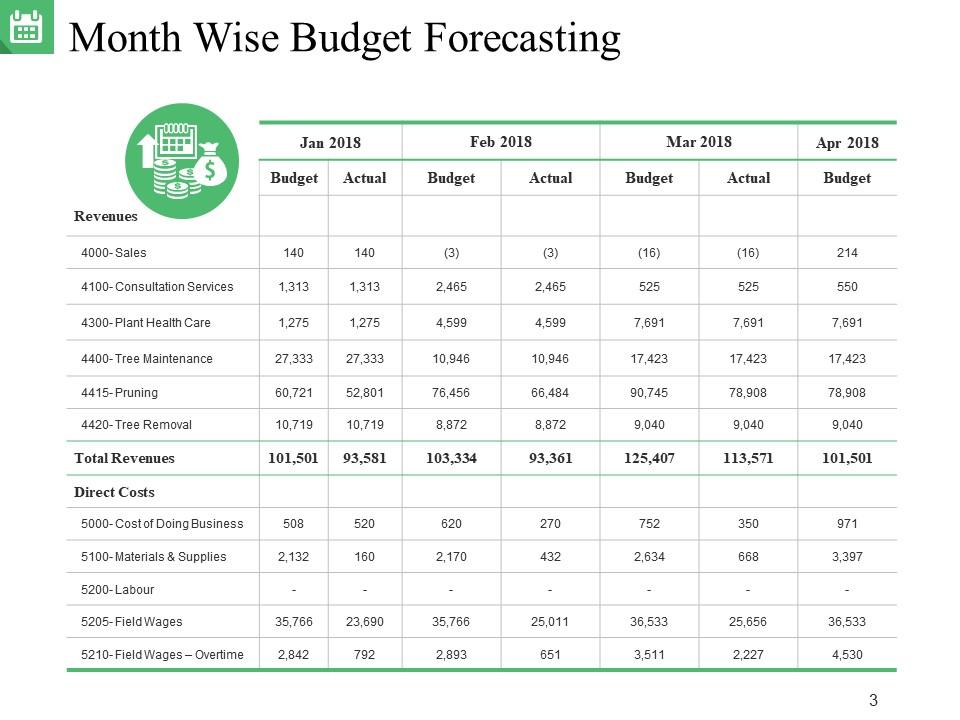
Slide 3: This slide showcases Month Wise Budget Forecasting with these information and add the different month budget calculations.
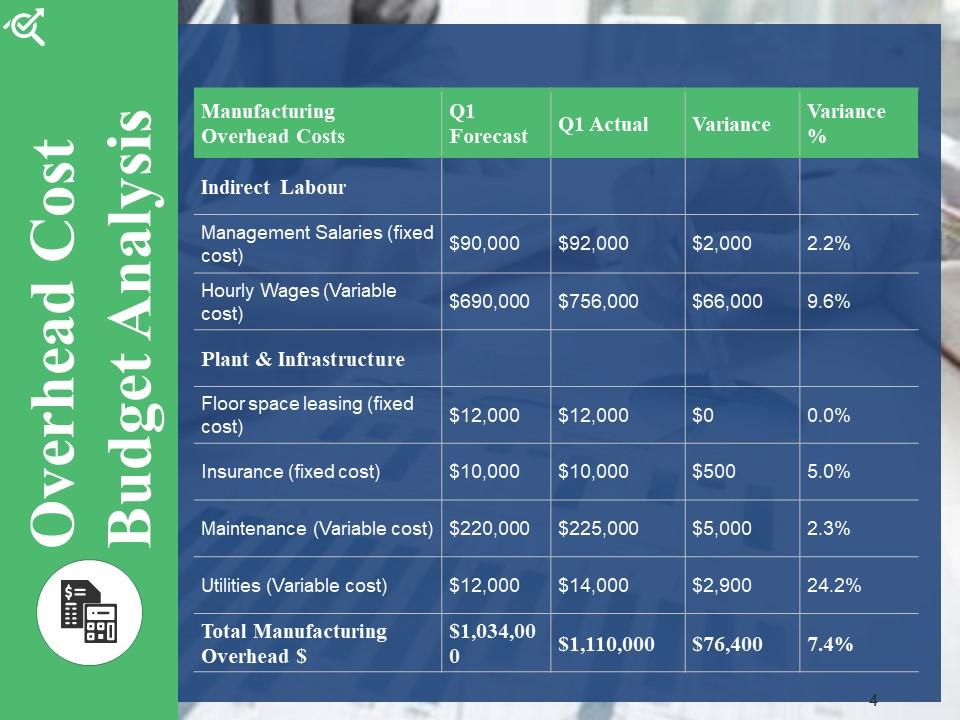
Slide 4: This slide presents Overhead Cost Budget Analysis.
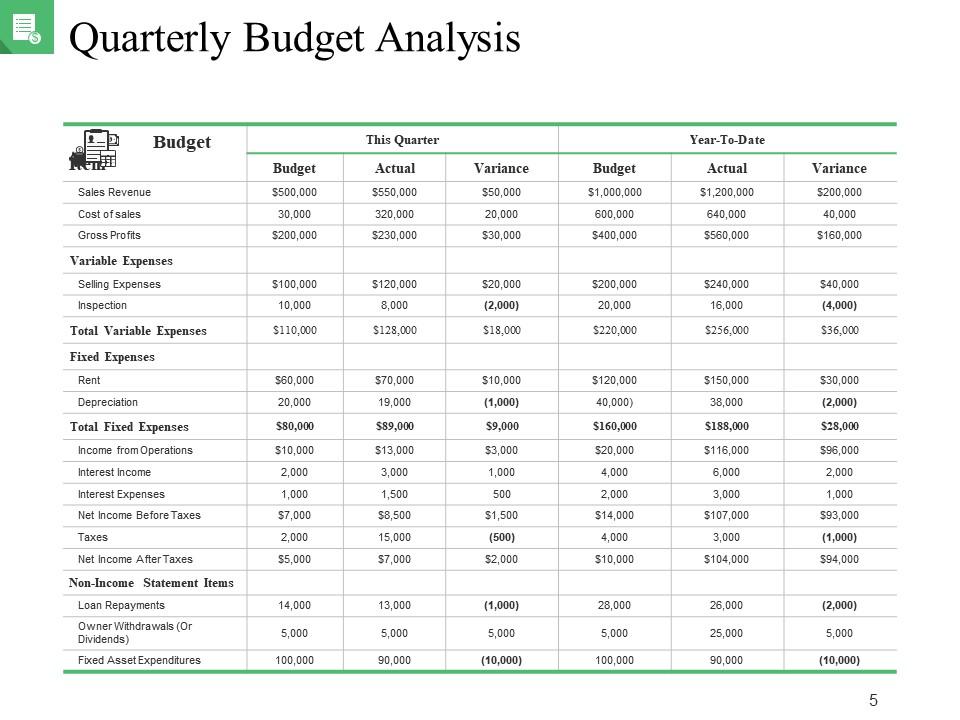
Slide 5: This slide showcases Quarterly Budget Analysis. You can add the budget for this quater and year to date.
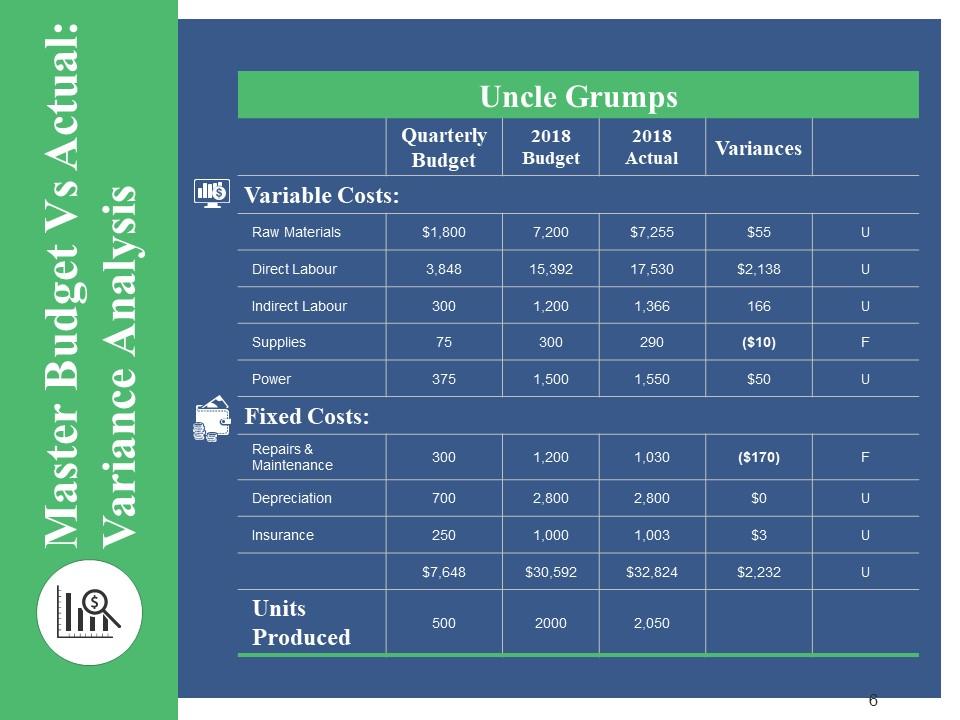
Slide 6: This slide presents Master Budget Vs Actual: Variance Analysis with variable cost and fixed cost.
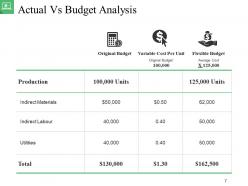
Slide 7: This slide presents Actual Vs Budget Analysis which further presents Original Budget.
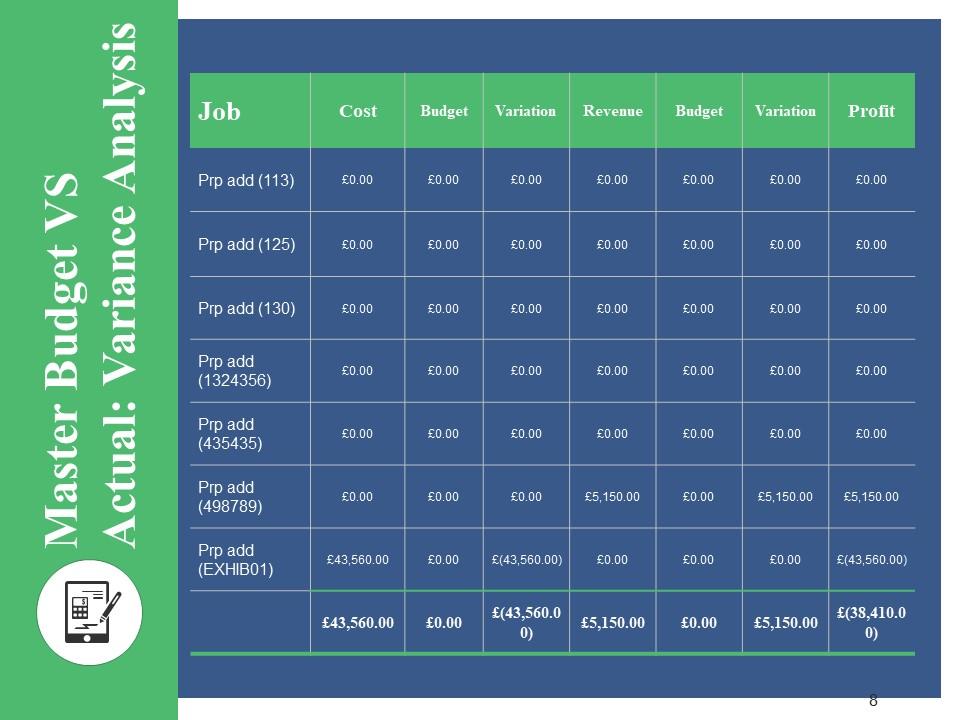
Slide 8: This slide showcases Master Budget VS Actual: Variance Analysis.
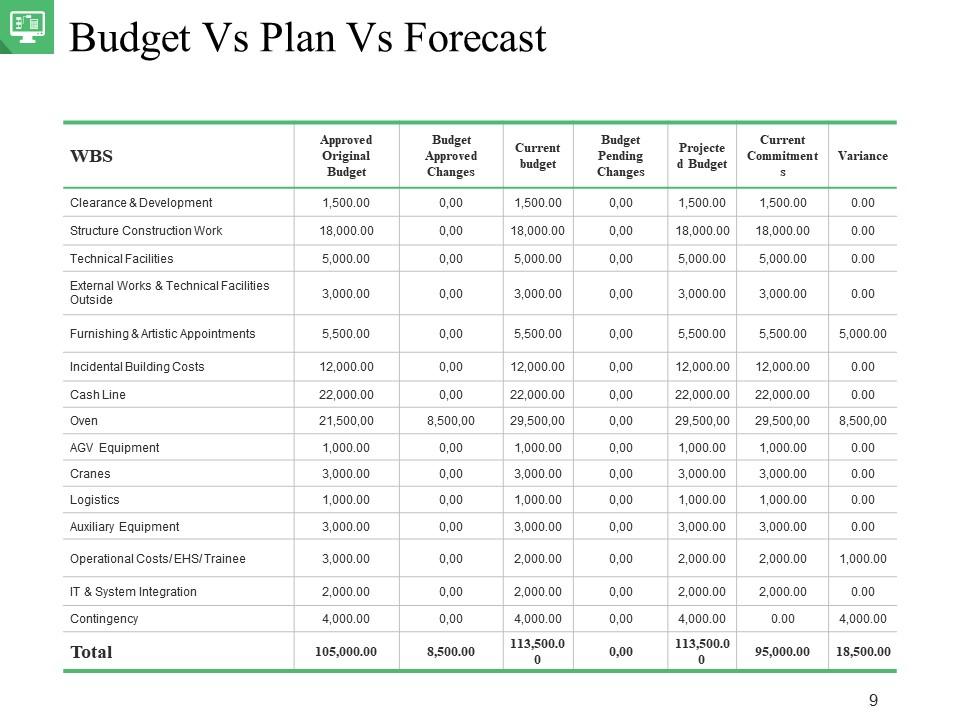
Slide 9: This slide showcases Budget Vs Plan Vs Forecast.
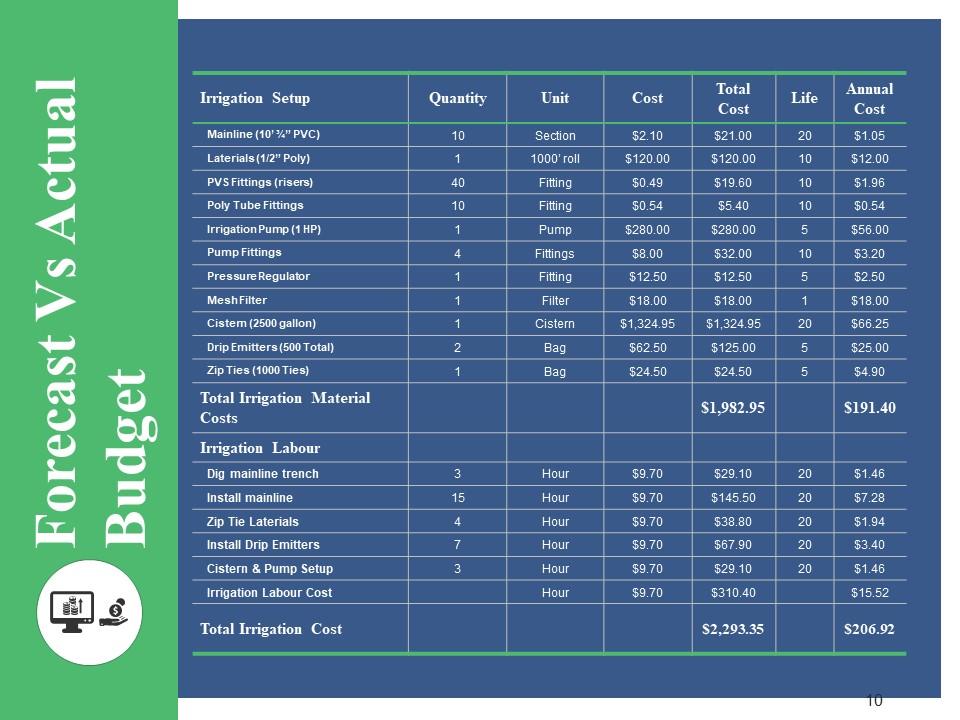
Slide 10: This slide presents Forecast Vs Actual Budget. Add the data and use it.
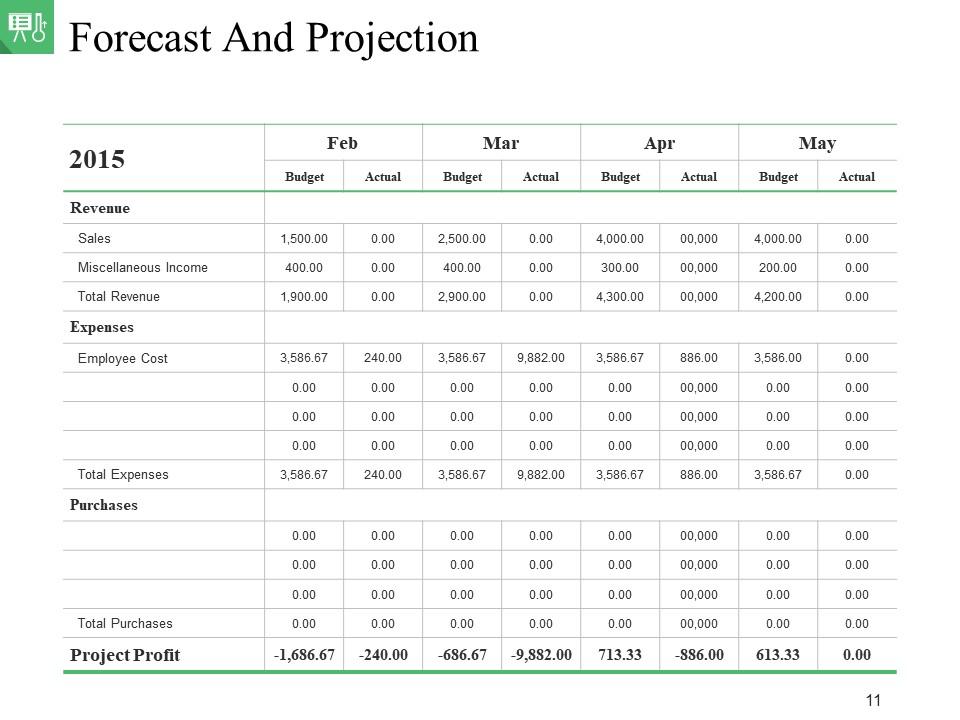
Slide 11: This slide shows Forecast And Projection.
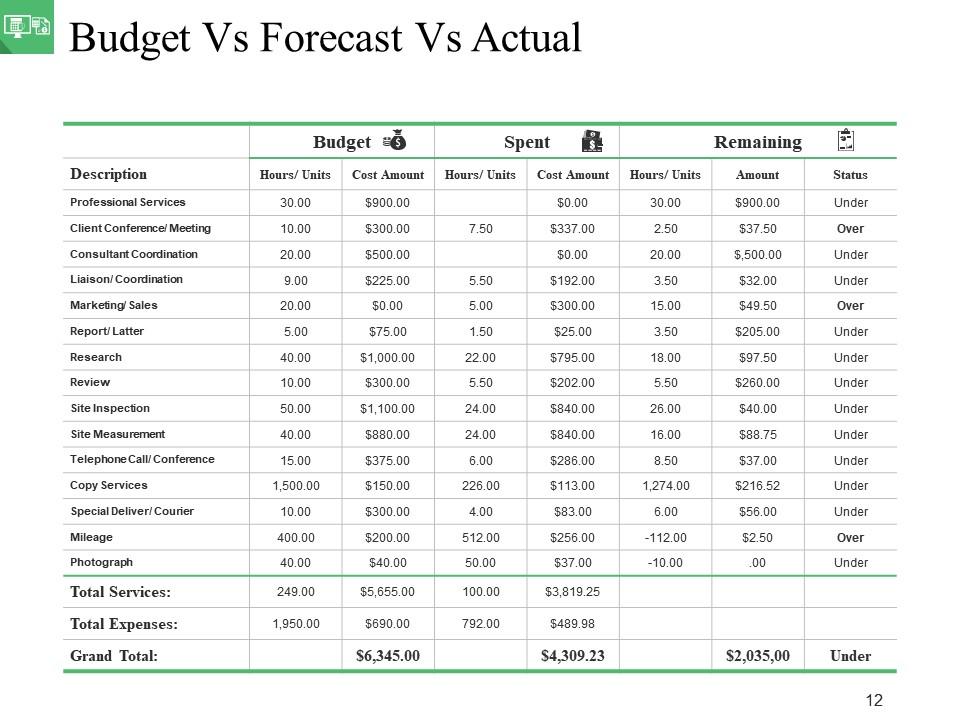
Slide 12: This slide showcases Budget Vs Forecast Vs Actual. Use it accordingly.
Slide 13: This slide We’ll Come Back After 15 Minutes.
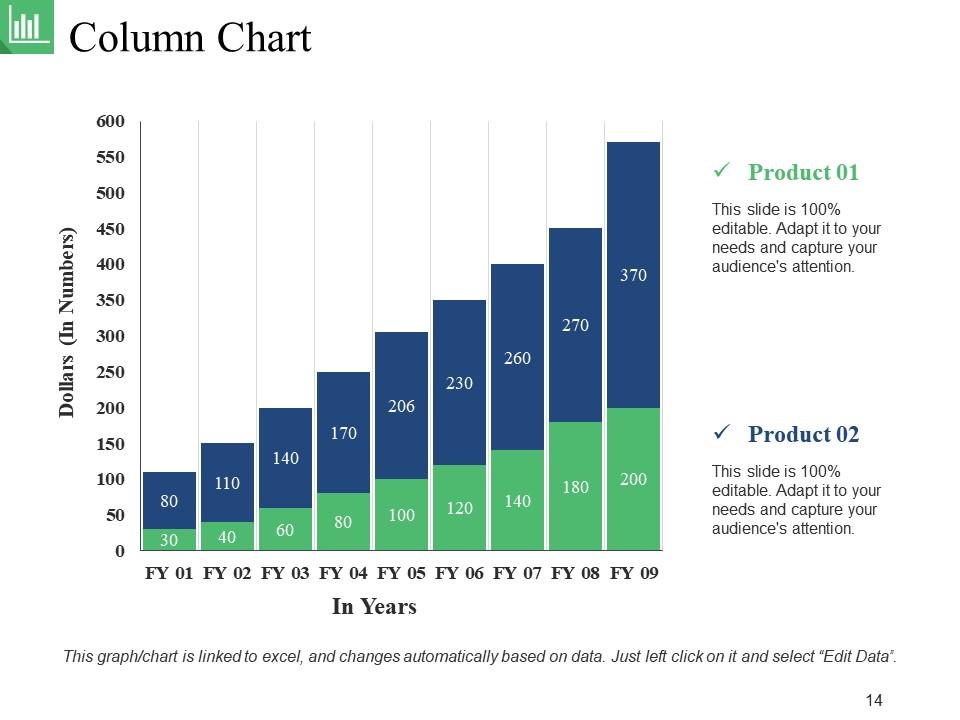
Slide 14: This slide presents Column Chart with the comparison table.
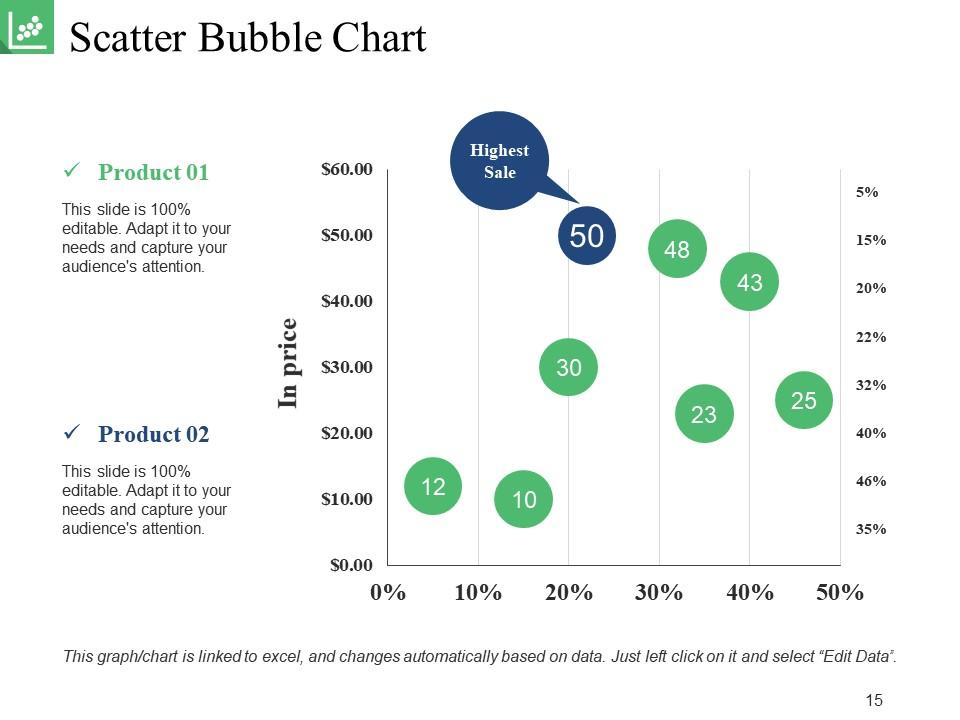
Slide 15: This slide showcases Scatter Bubble Chart. Add the data and use it.
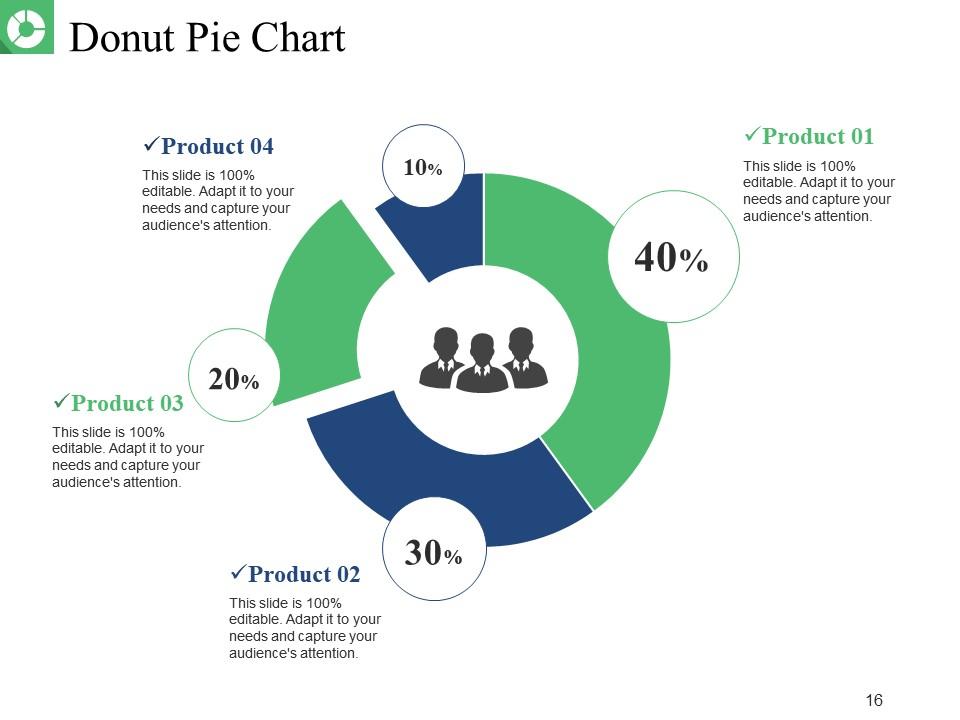
Slide 16: This slide shows Donut Pie Chart.
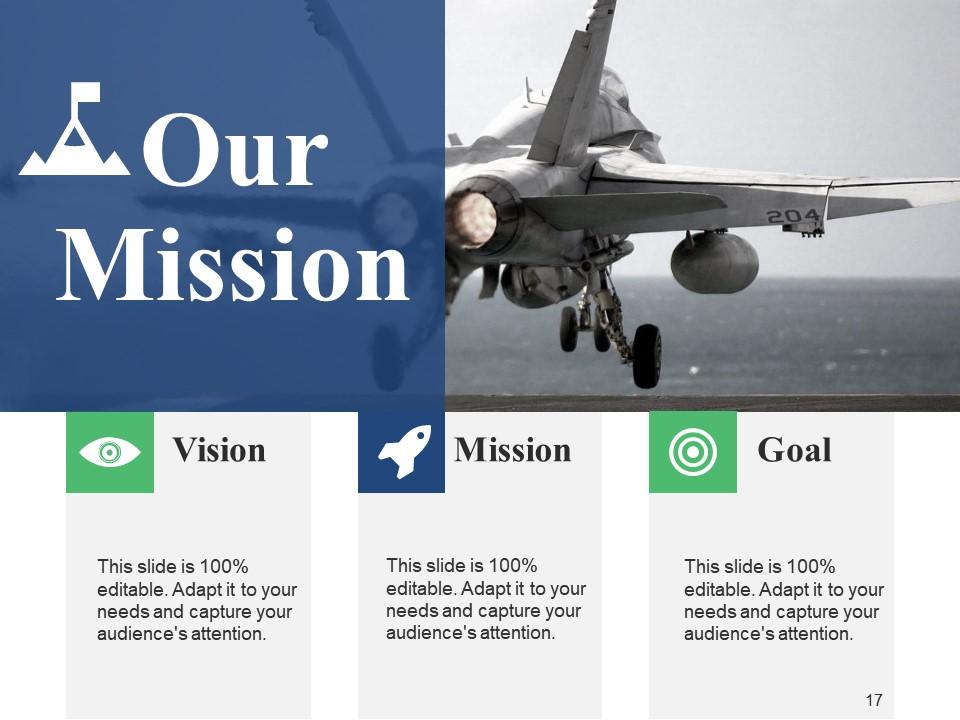
Slide 17: This is a Vision, Mission and Goals slide. State them here.
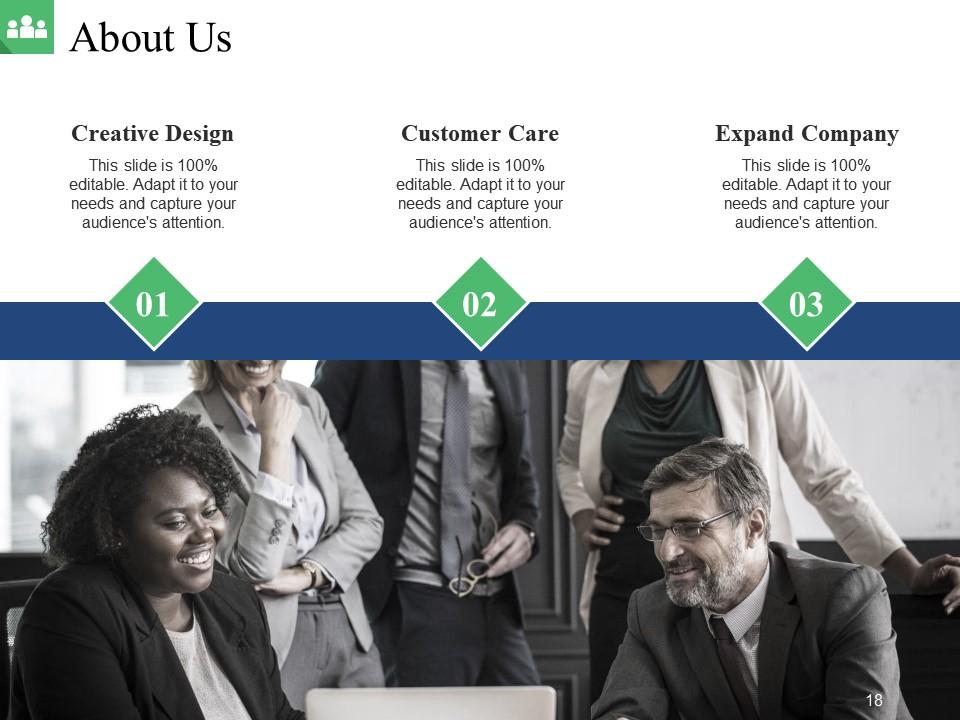
Slide 18: This is an About Us slide showing Our Company, Value Client, and Premium services as examples.
Slide 19: This slide showcases Our Team with Name and Designation to fill.
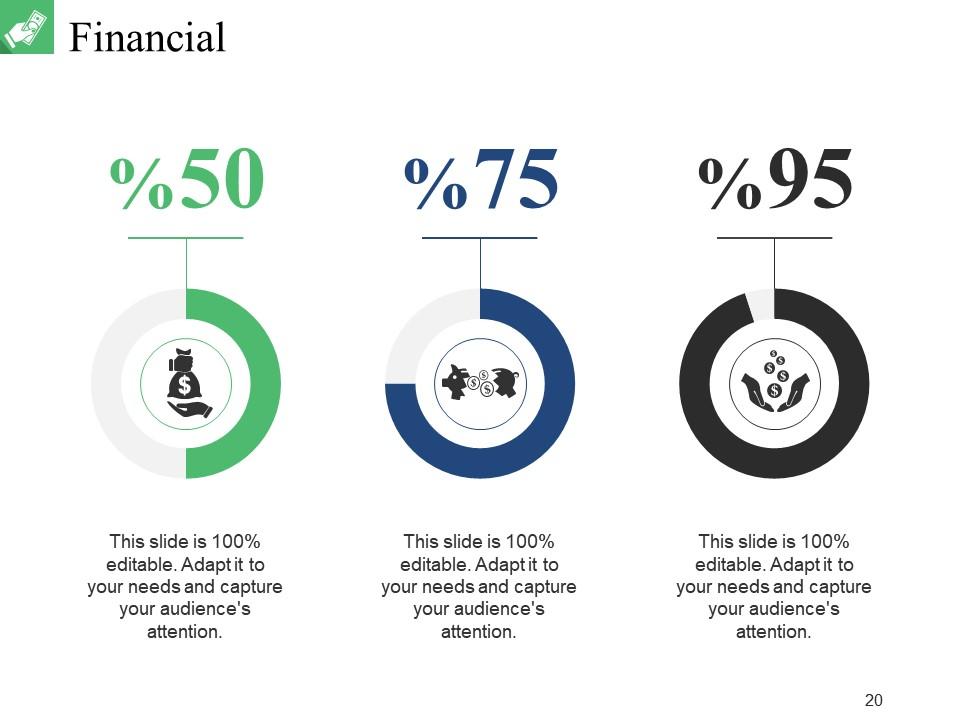
Slide 20: State your Financial score in this slide with relevant imagery and text.
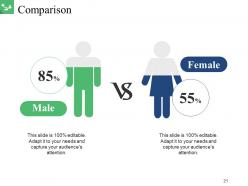
Slide 21: This slide shows Comparison of Positive Factors v/s Negative Factors with thumbsup and thumb down imagery.
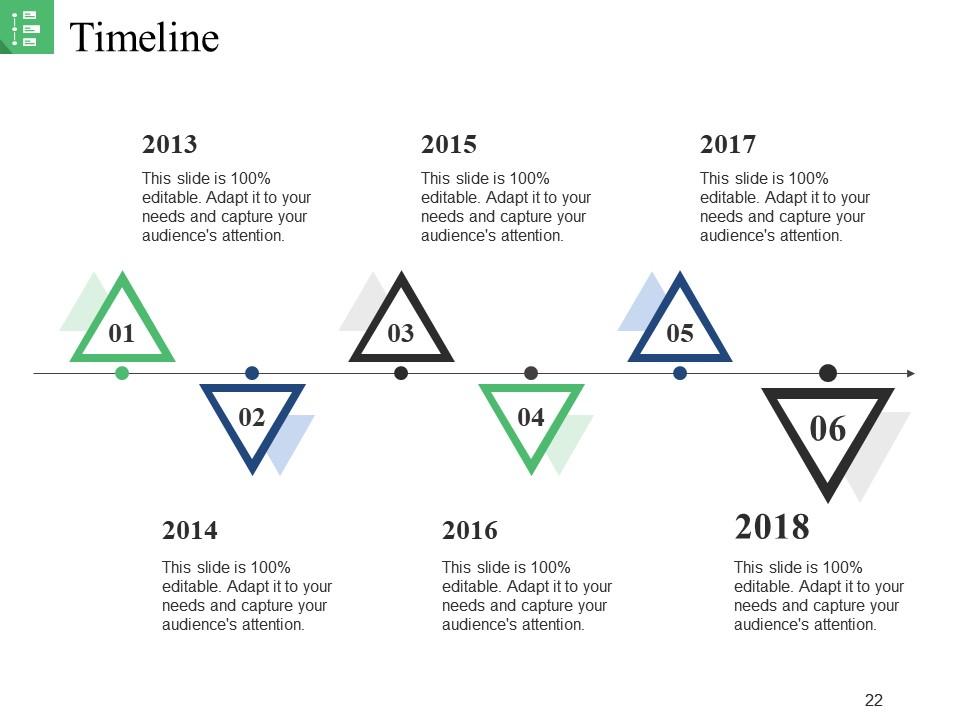
Slide 22: This is a Timelines slide to show- Plan, Budget, Schedule, Review.
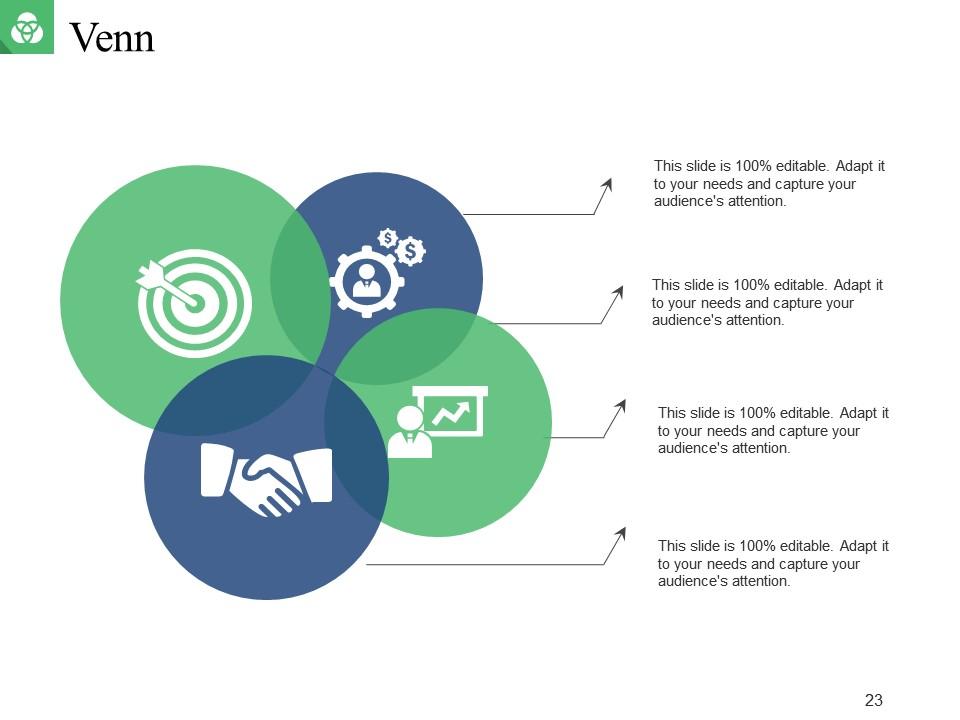
Slide 23: This slide displays a Venn diagram image.
Slide 24: This slide displays a Magnifying Glass with icon imagery.
Slide 25: This is a Thank You slide with Address# street number, city, state, Contact Numbers, Email Address.
Actual Cost Vs Plan Projection Powerpoint Presentation Slides with all 25 slides:
Transform the difficult into the elementary. Our Actual Cost Vs Plan Projection Powerpoint Presentation Slides will do the conversion.
-
The Designed Graphic are very professional and classic.
-
Excellent work done on template design and graphics.


