Project Investment Analysis And Appraisal Powerpoint Presentation Slides
Get folks to exchange individual ideas with our Project Investment Analysis And Appraisal Powerpoint Presentation Slides. Encourage folks to interact.
You must be logged in to download this presentation.
 Impress your
 audience
Editable
of Time
PowerPoint presentation slides
Presenting Project Investment Analysis and Appraisal PowerPoint Presentation Slides.
People who downloaded this PowerPoint presentation also viewed the following :
Content of this Powerpoint Presentation
Slide 1: This slide introduces Project Investment Analysis and Appraisal. State Your Company Name and get started.
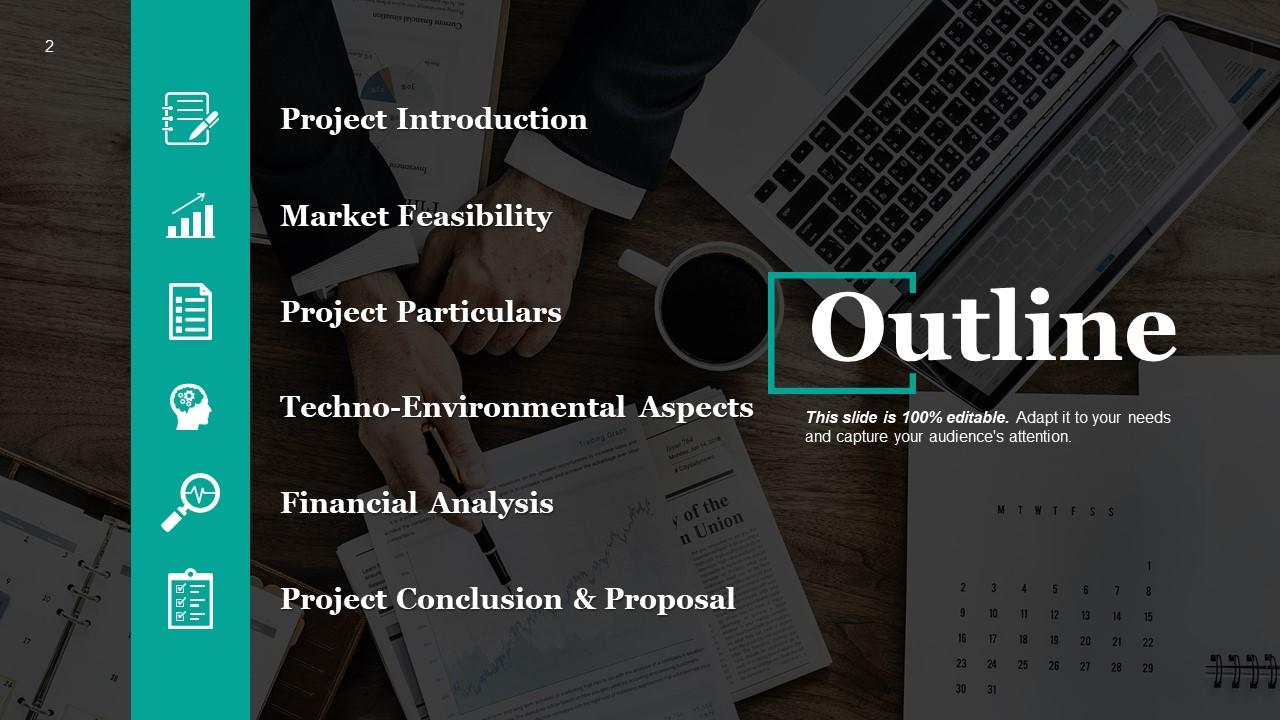
Slide 2: This is an Outline slide to show the following aspects- Project Introduction, Market Feasibility, Project Particulars, Techno-Environmental Aspects, Financial Analysis, Project Conclusion & Proposal.
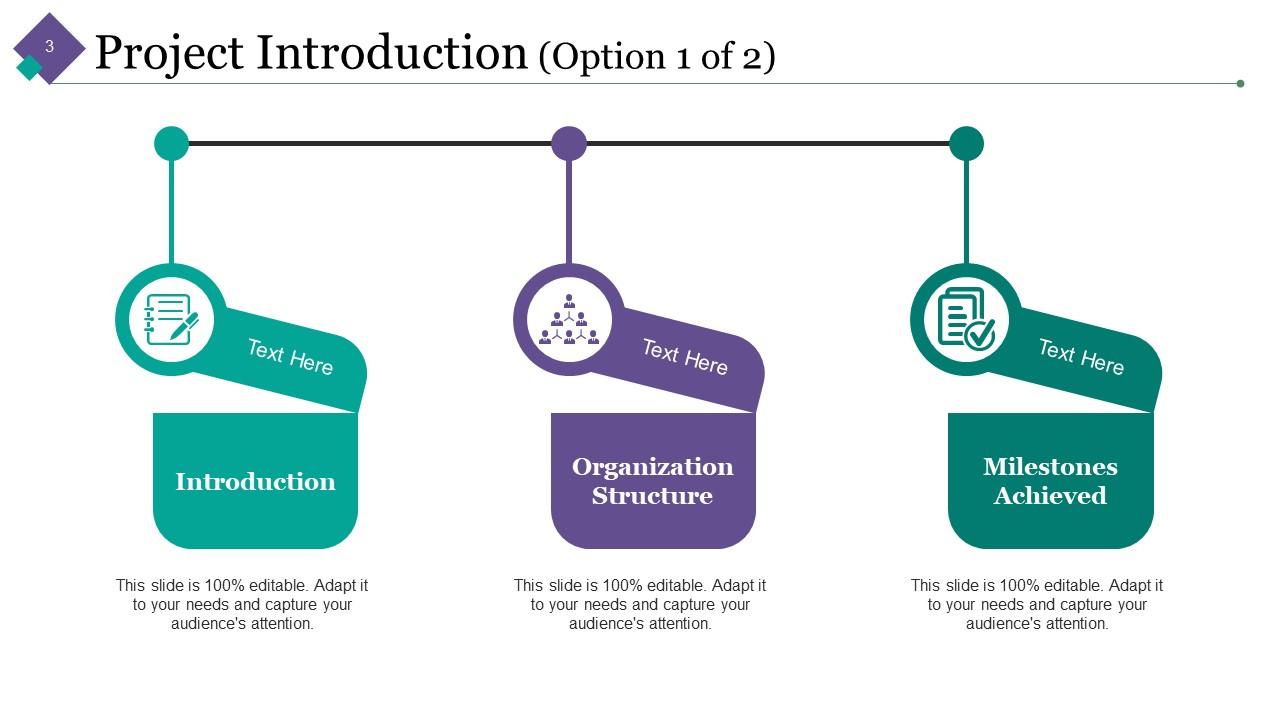
Slide 3: This is Project Introduction (Option 1 of 2) slide to state- Introduction, Organization Structure, Milestones Achieved.
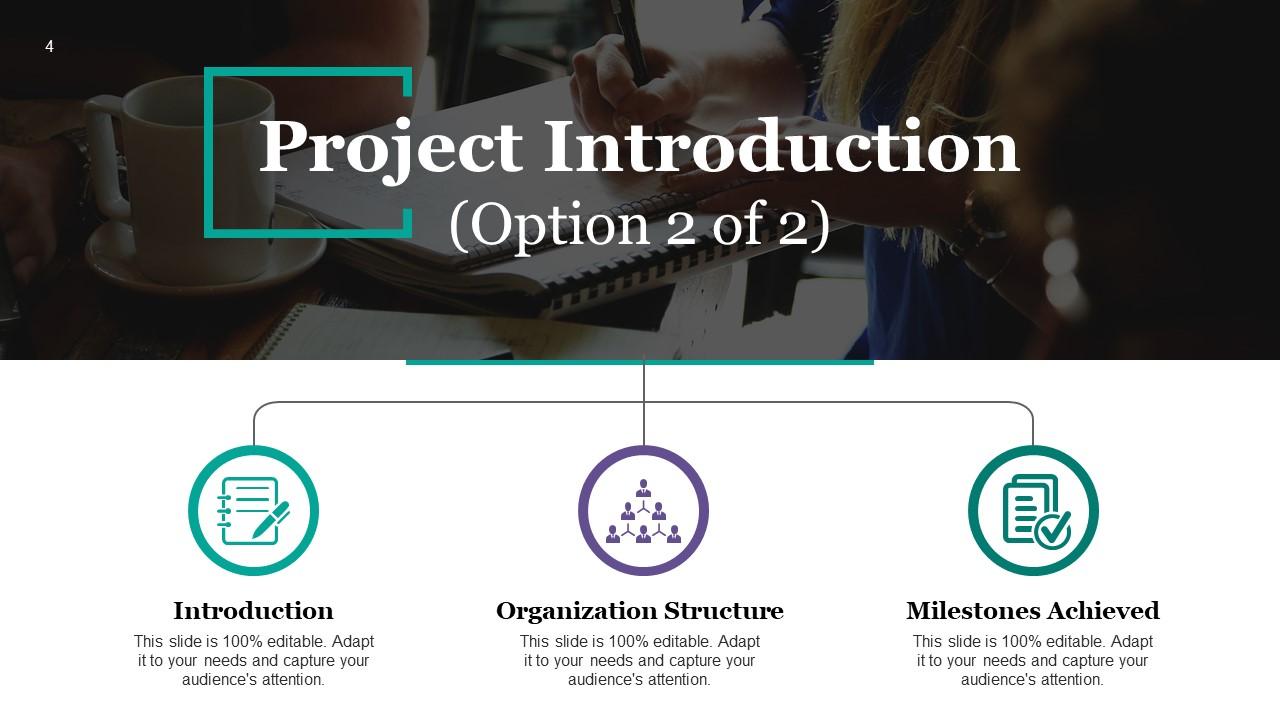
Slide 4: This slide also presents Project Introduction (Option 2 of 2).
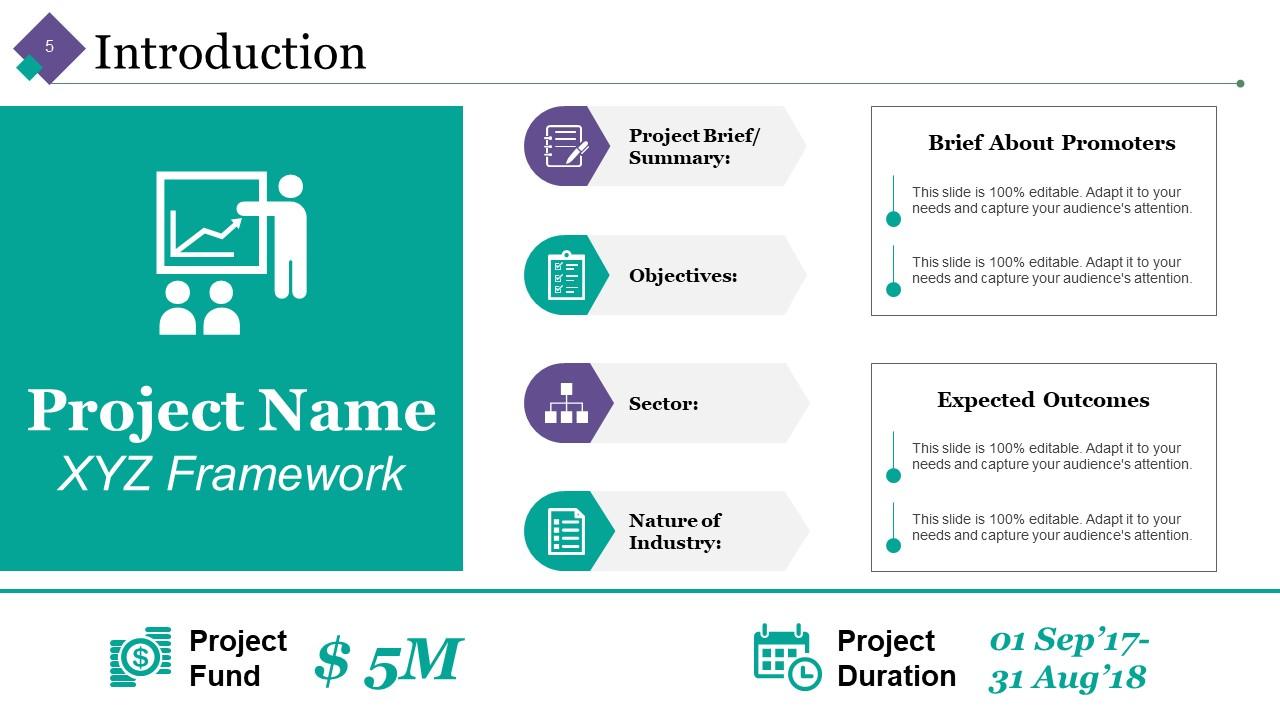
Slide 5: This is an Introduction slide presenting- Project Brief/ Summary, Objectives, Sector, Nature of Industry, Project Name, Brief About Promoters, Expected Outcomes, Project Fund, Project Duration. State the following aspects here and make use of it.
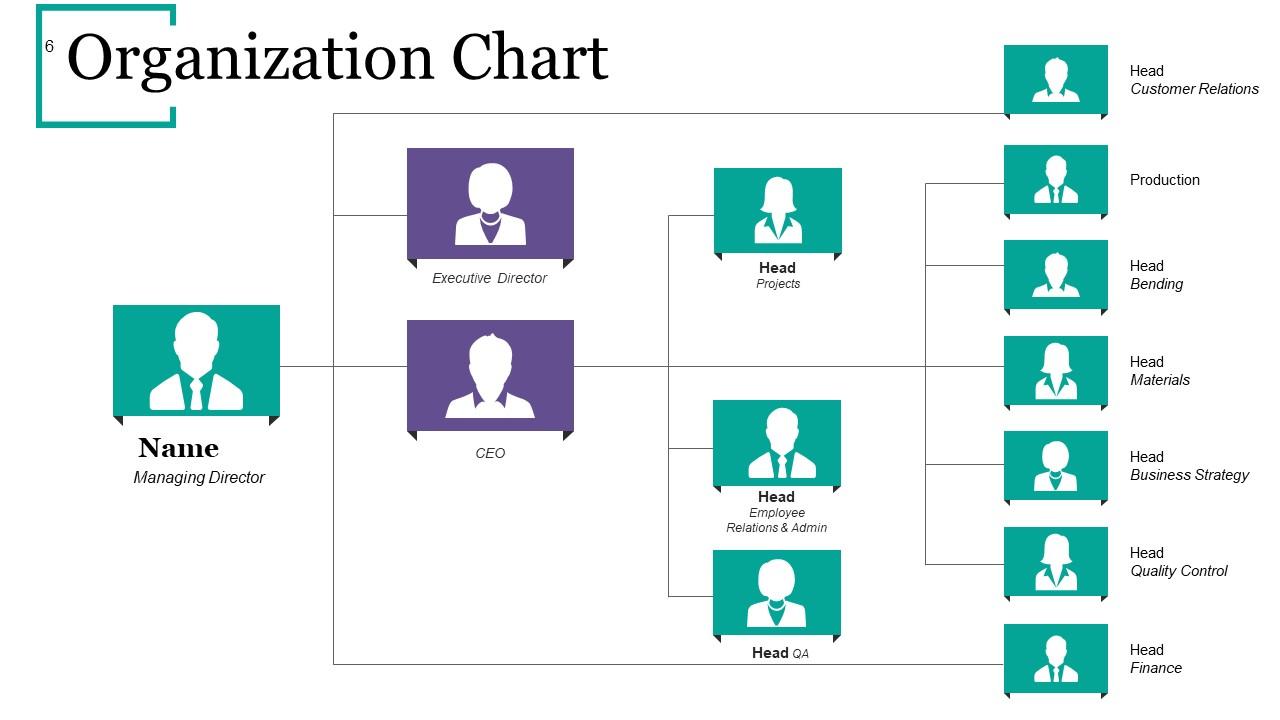
Slide 6: This slide displays an Organization Chart. Show team members, project manager etc. here.
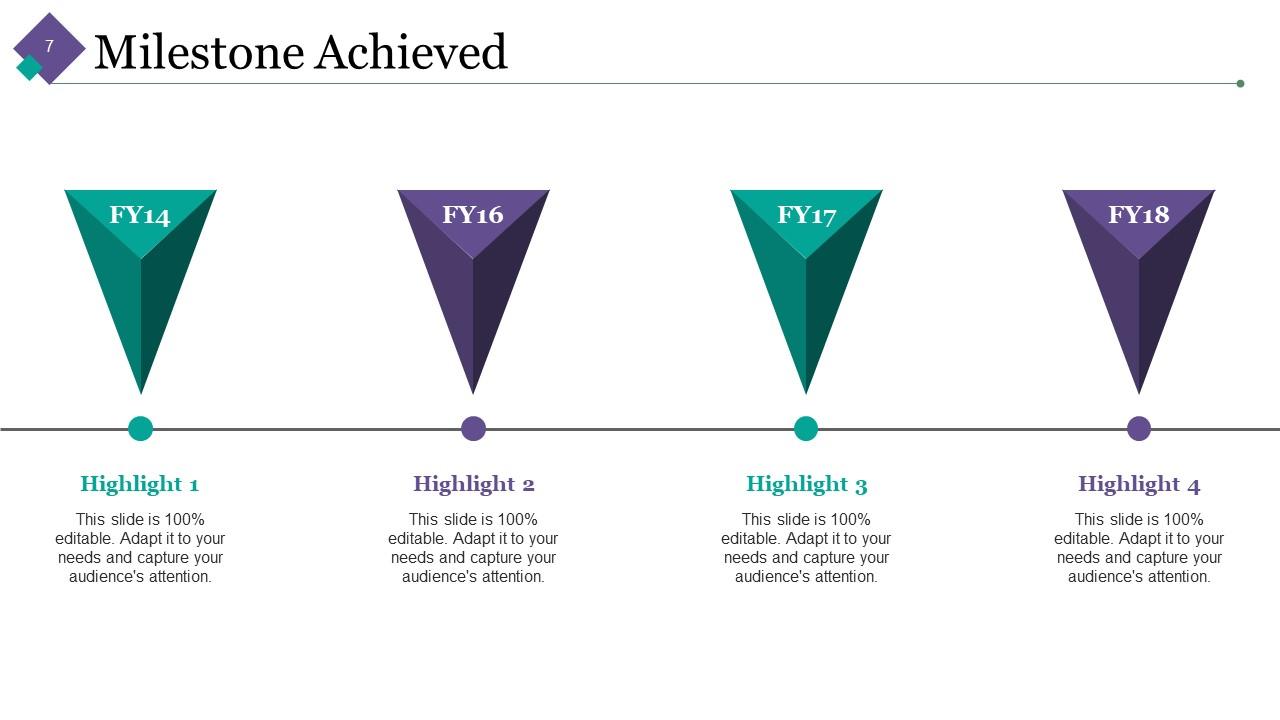
Slide 7: This is Milestone Achieved slide in a timeline form. Showcase your milestones, growth aspects etc. here.
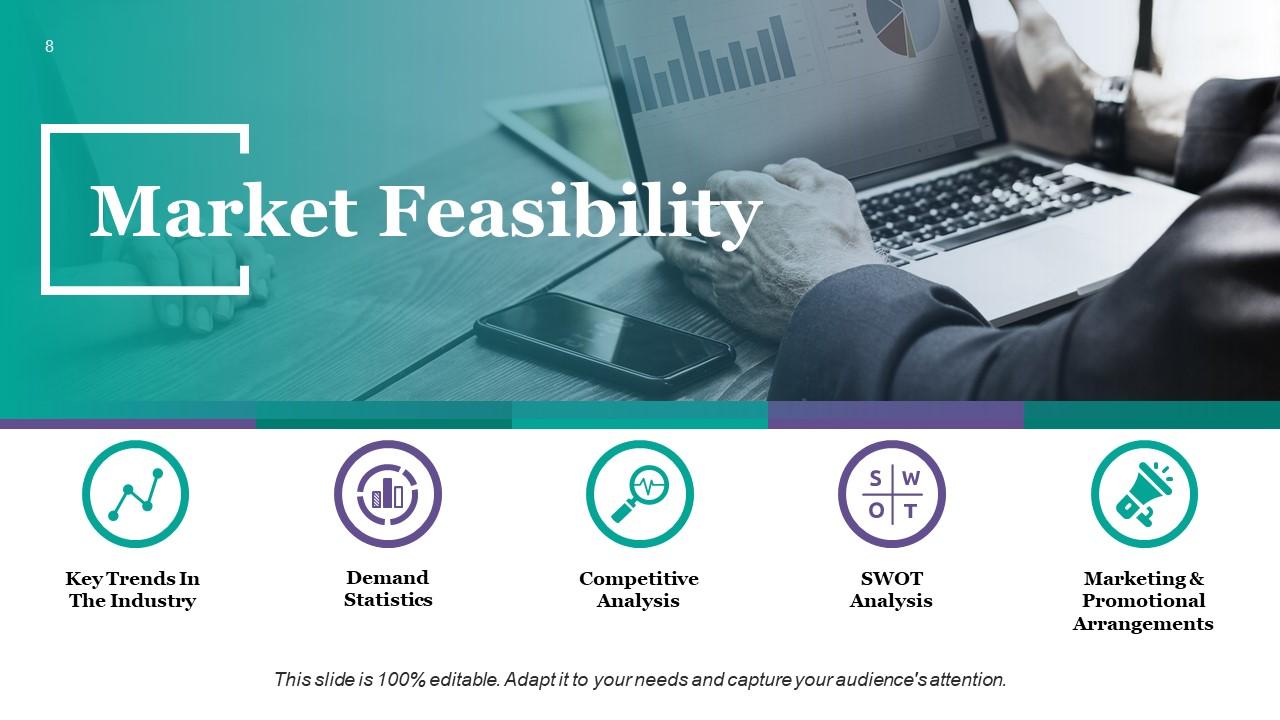
Slide 8: This slide shows Market Feasibility with- Key Trends In The Industry, Demand Statistics, Competitive Analysis, SWOT Analysis, Marketing & Promotional Arrangements.
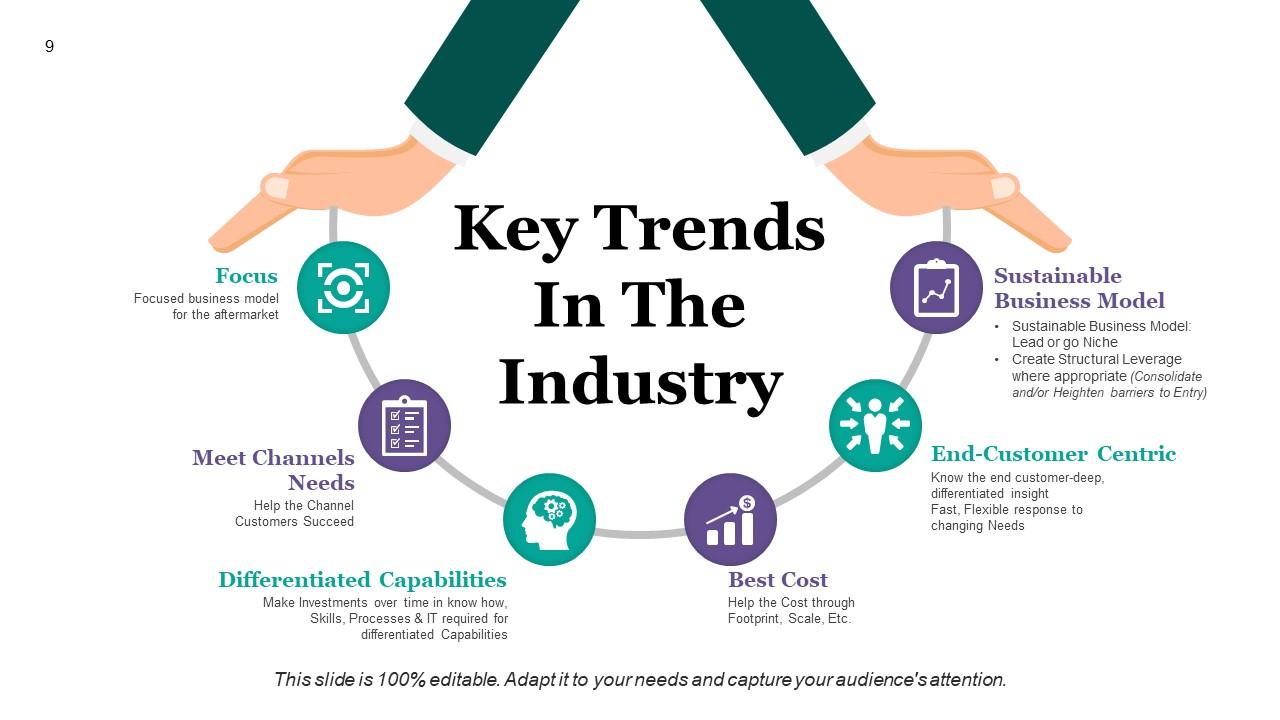
Slide 9: This slide shows Key Trends In The Industry. We have listed a few to give you an idea. Either make use of them or add your own.
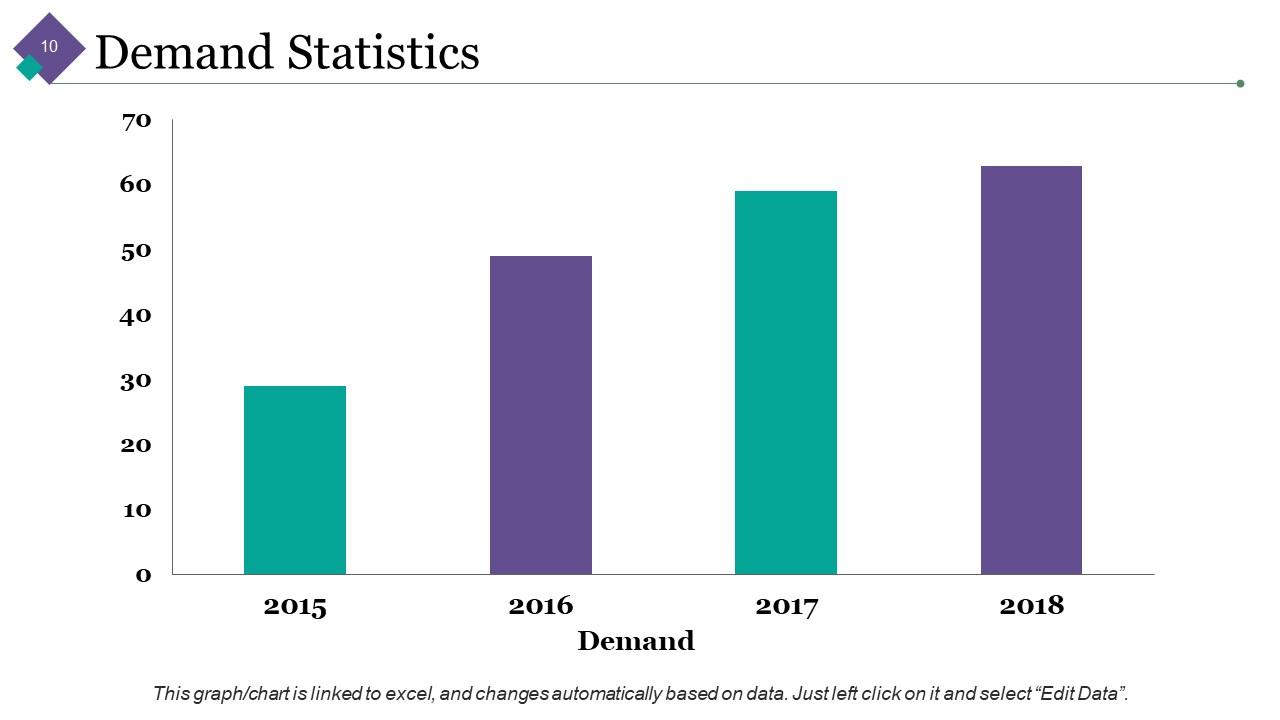
Slide 10: This slide presents Demand Statistics graph. Showcase your demand in this graph and use it.
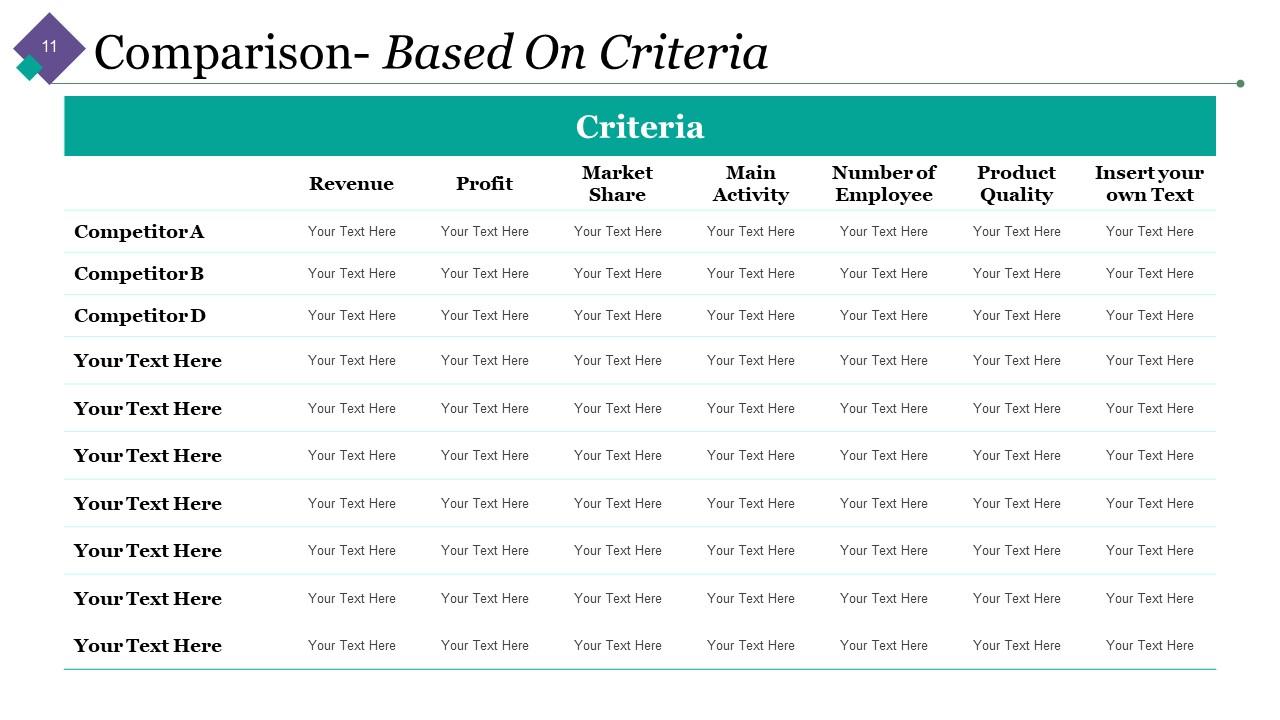
Slide 11: This slide shows Comparison- Based On Criteria.
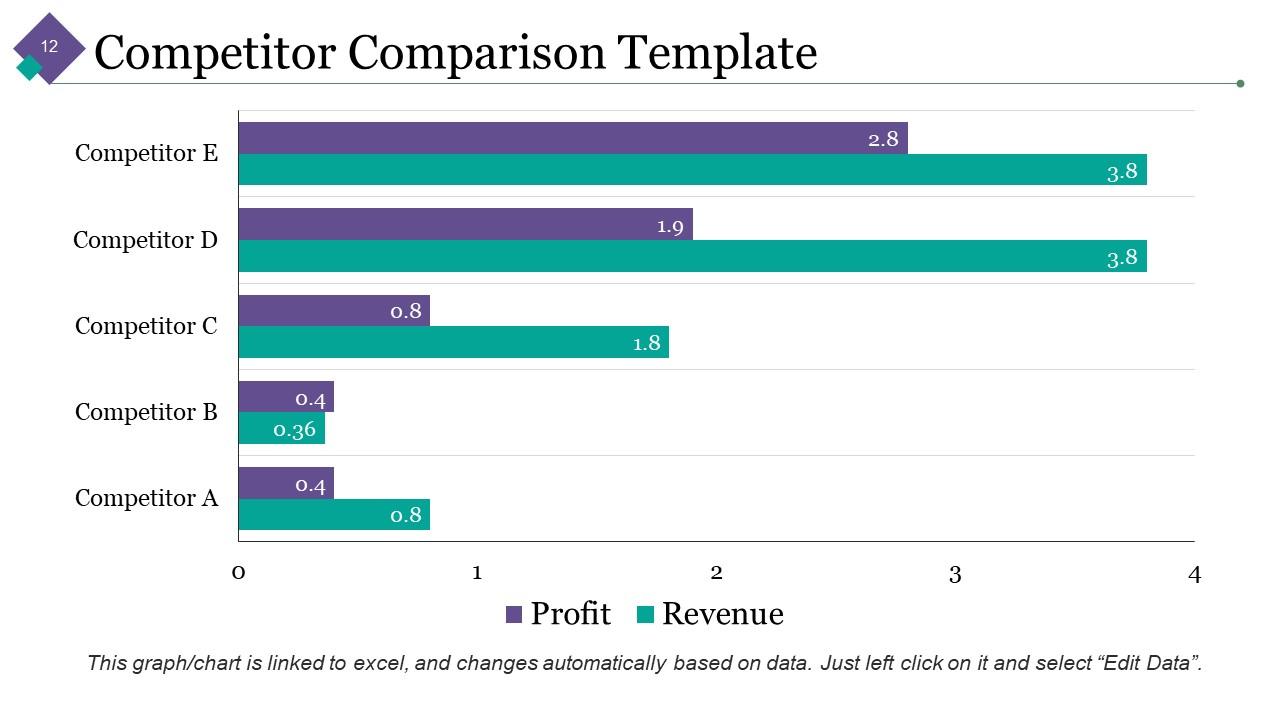
Slide 12: This slide presents Competitor Comparison Template in a graphical form. State your Competitor stats here.
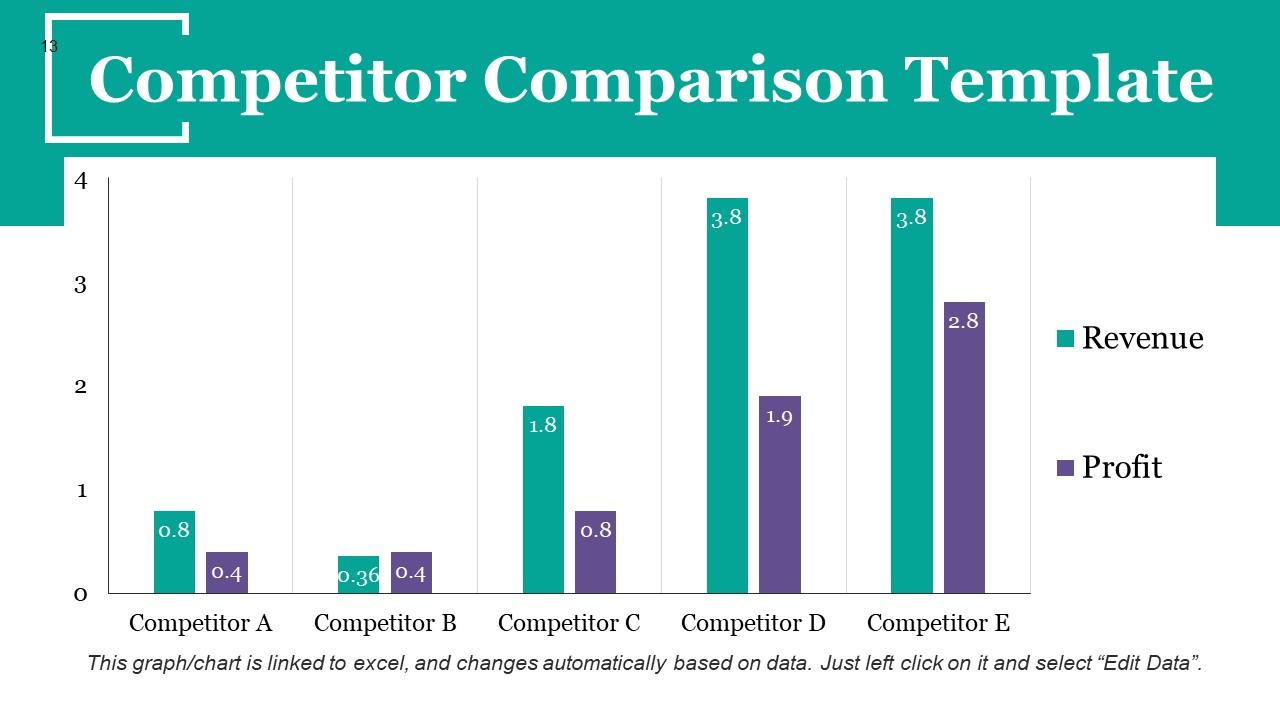
Slide 13: This slide also shows Competitor Comparison Template. Add relevant data and make use of it.
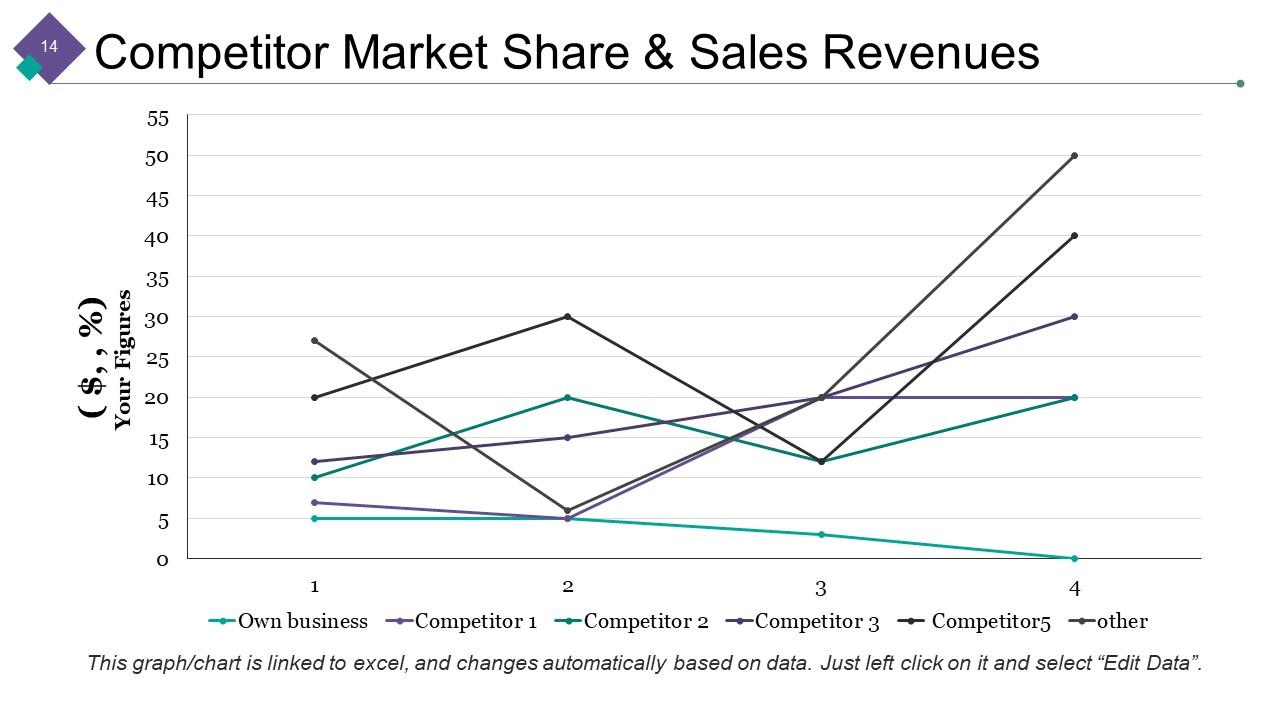
Slide 14: This slide shows Competitor Market Share & Sales Revenues in a line graph/ chart form.
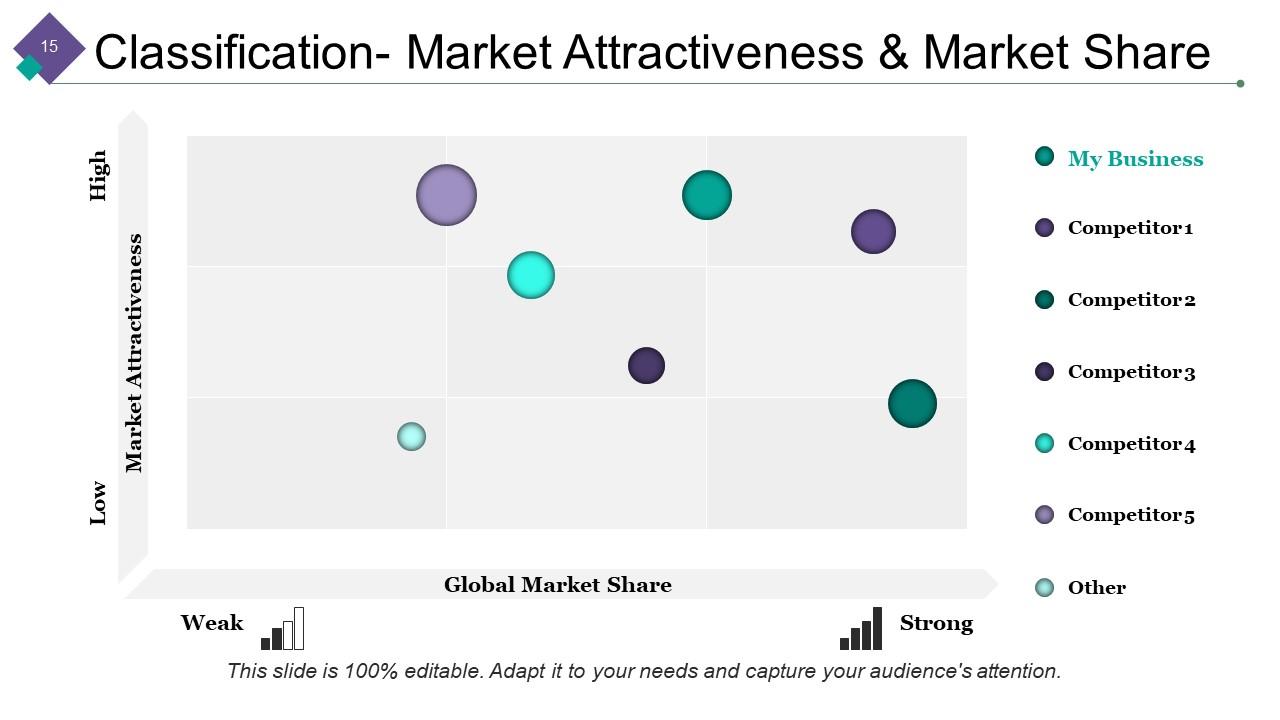
Slide 15: This slide shows Classification- Market Attractiveness & Market Share matrix. Put relevant comparing data here.
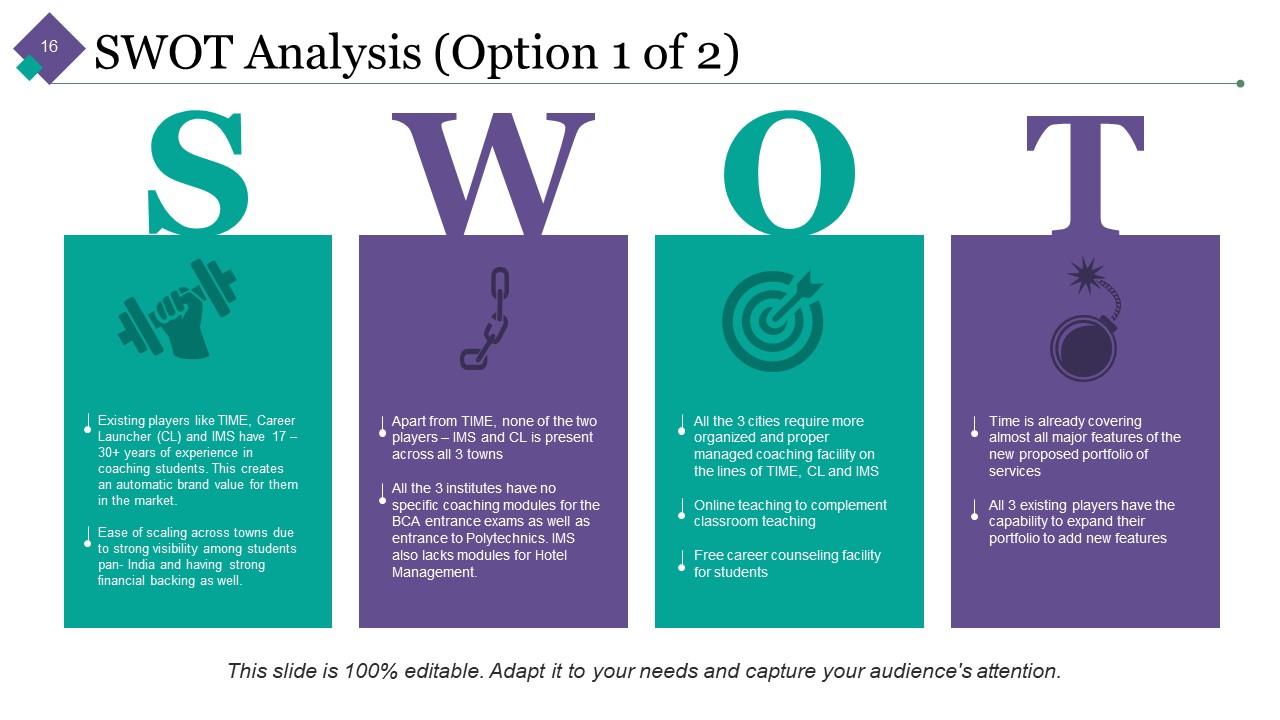
Slide 16: This slide shows SWOT Analysis.
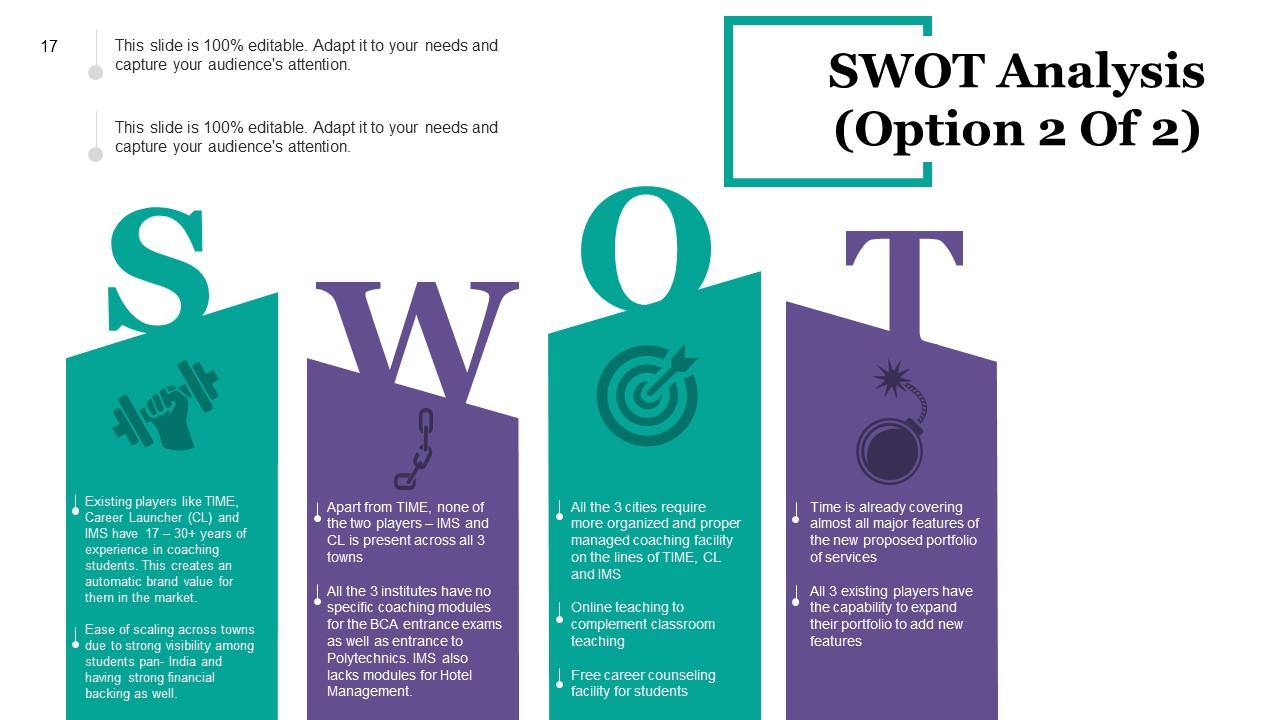
Slide 17: This slide also shows SWOT Analysis.
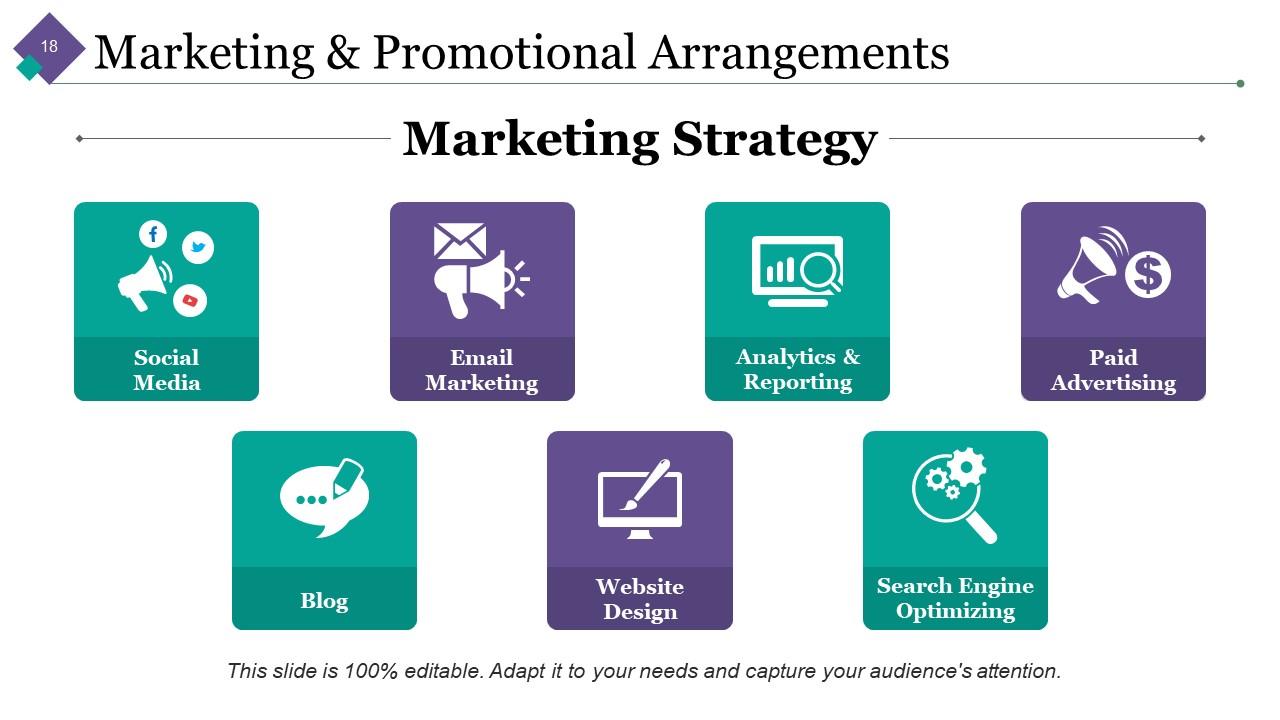
Slide 18: This slide shows Marketing & Promotional Arrangements with Marketing Strategy.
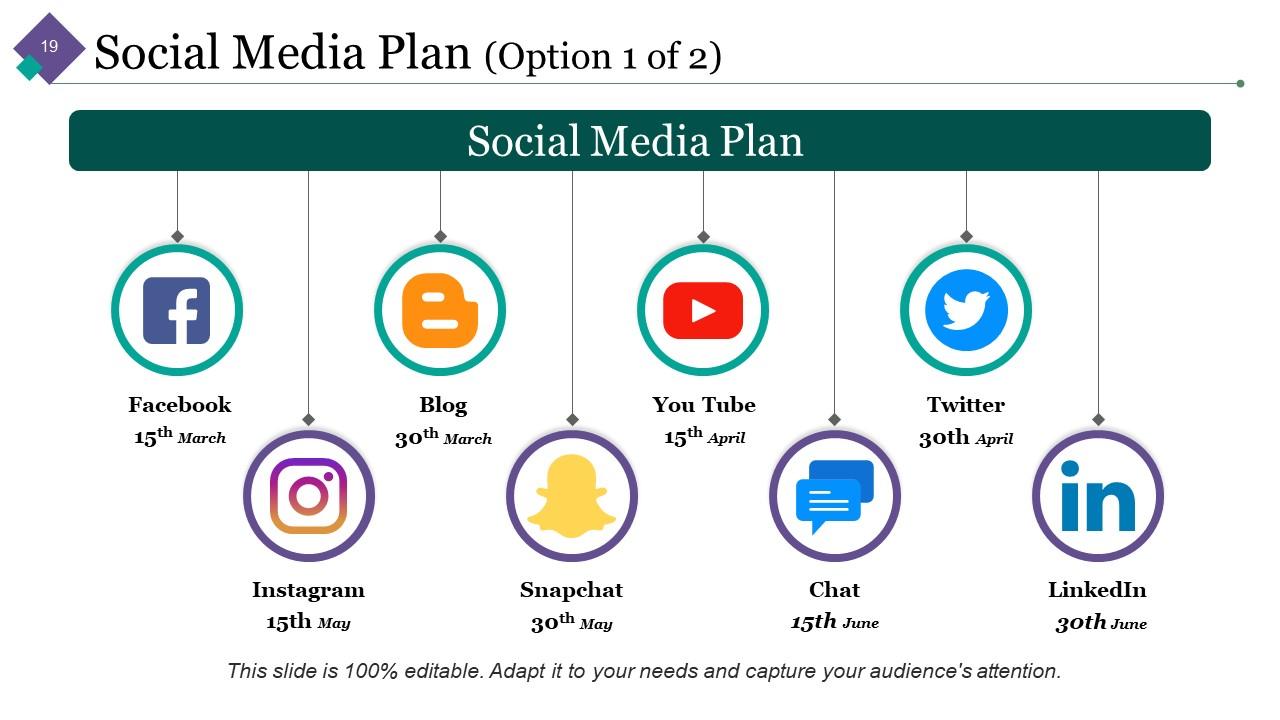
Slide 19: This slide shows Social Media Plan (Option 1 of 2) with some of the popular social media handle icons such as- Facebook Blog Twitter Instagram Snapchat etc.
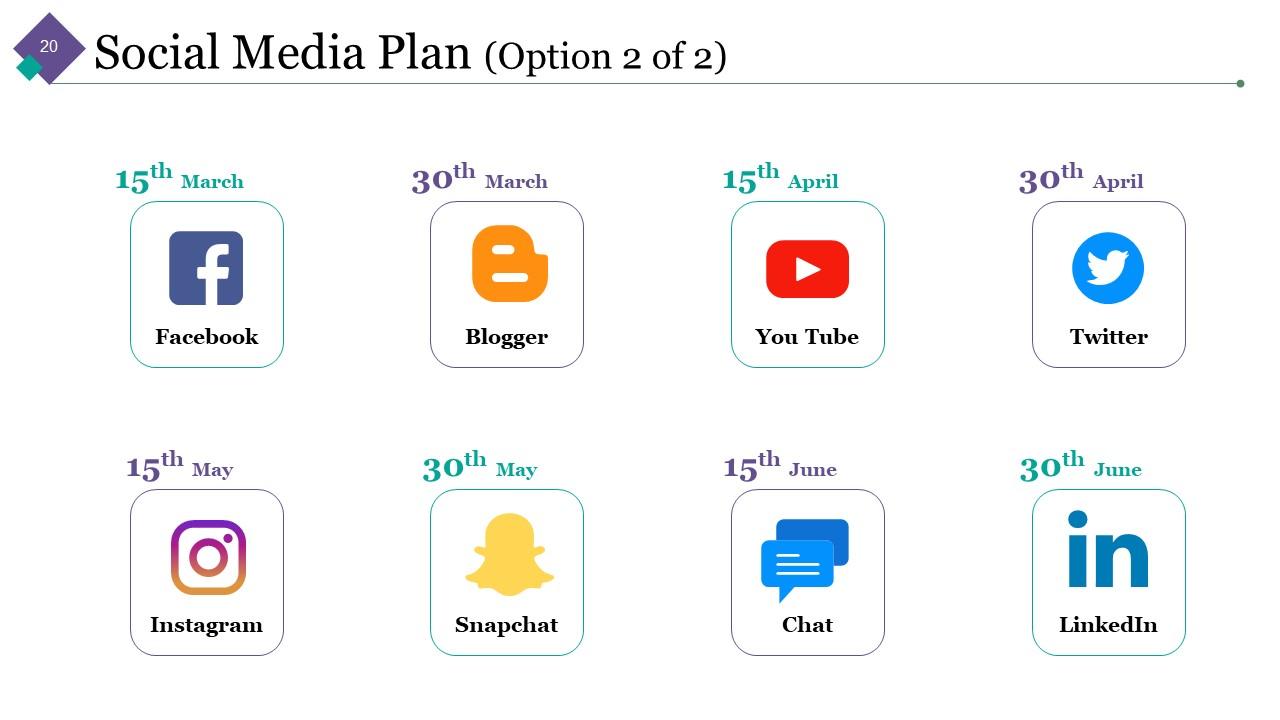
Slide 20: This slide also shows Social Media Plan (Option 2 of 2) with relevant icon imagery.
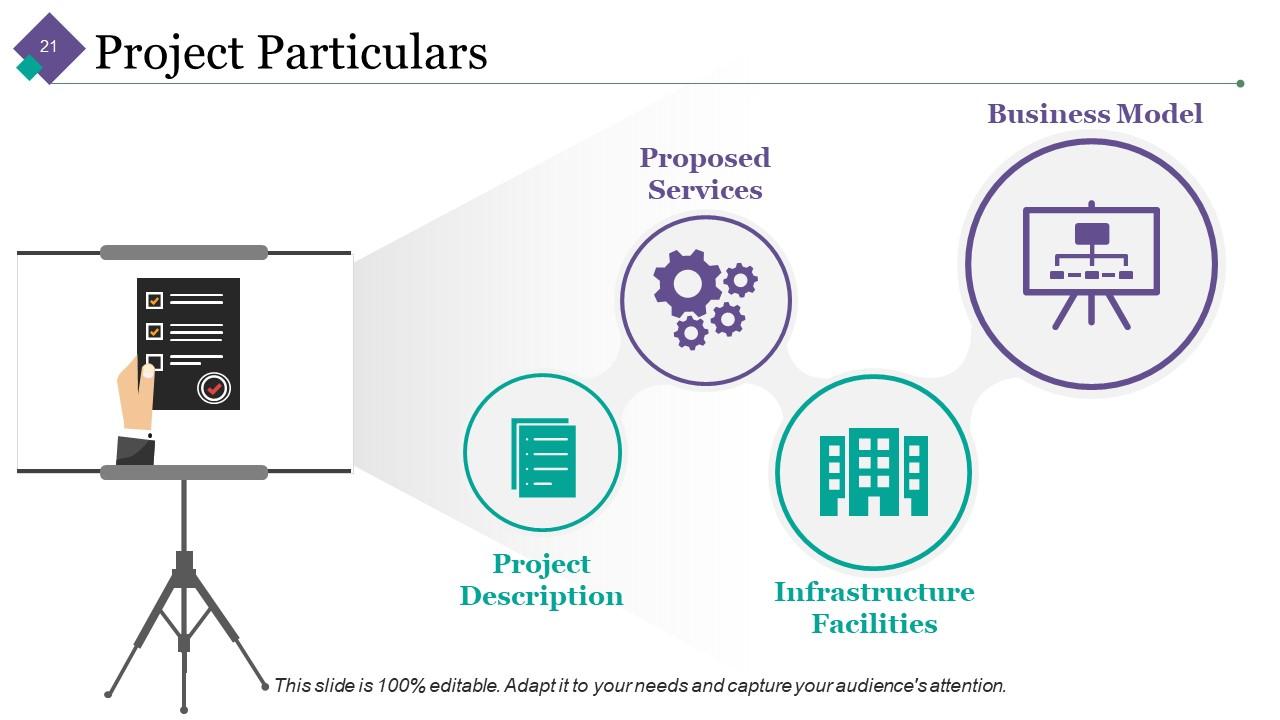
Slide 21: This slide shows Project Particulars with- Proposed Services Infrastructure Facilities Business Model Project Description
Slide 22: This slide showcases Project Description. Add your description and make use of it.
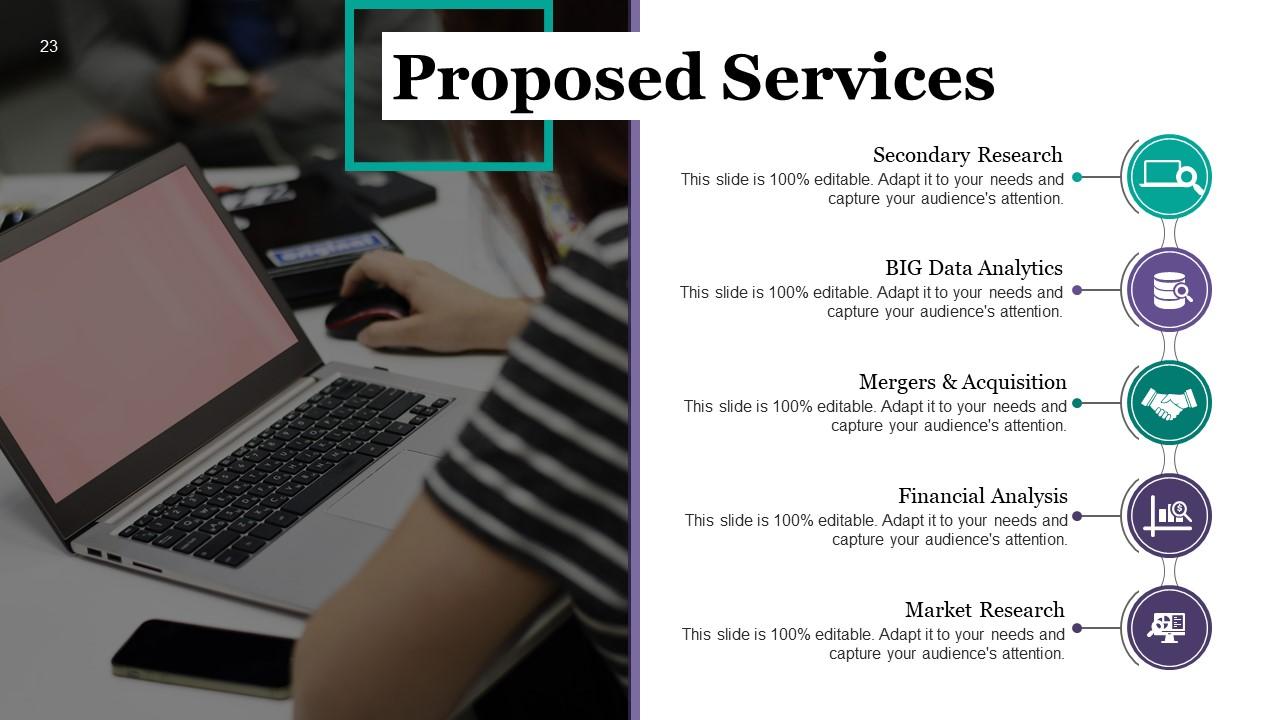
Slide 23: This slide shows Proposed Services which involve- Secondary Research, BIG Data Analytics, Mergers & Acquisition, Financial Analysis, Market Research.
Slide 24: This slide shows Infrastructure Facilities with imagery and text boxes.
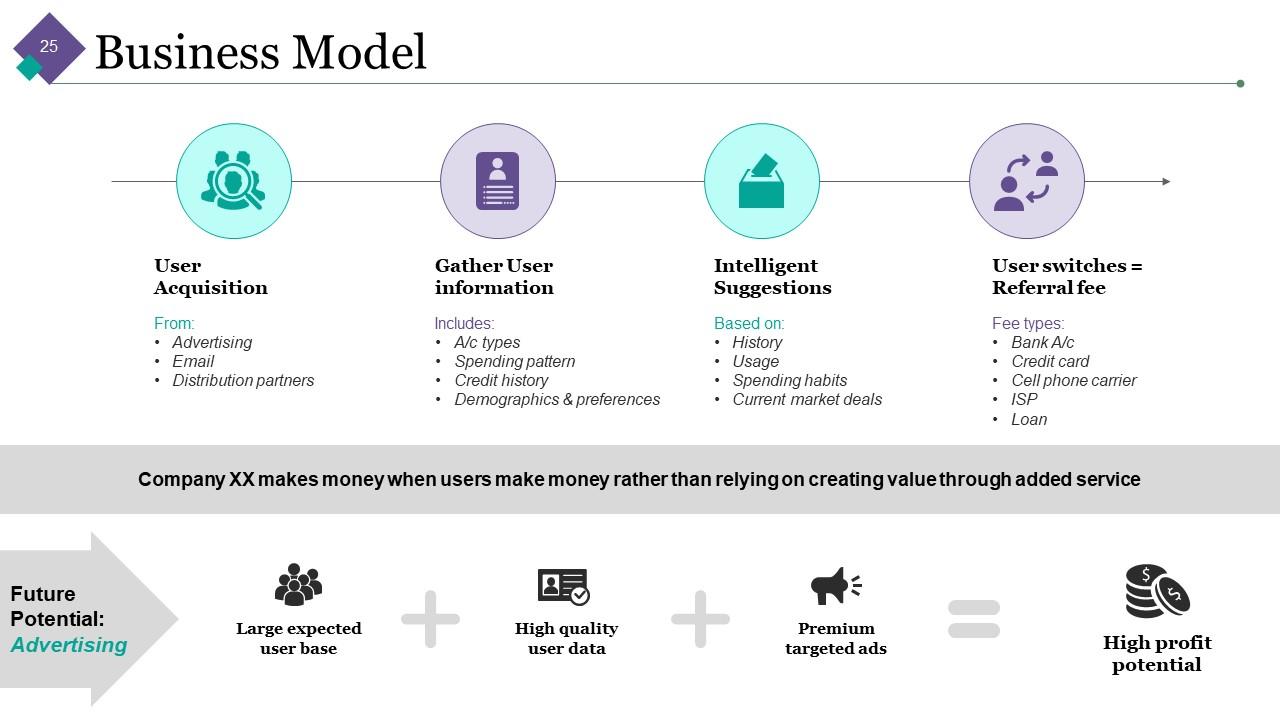
Slide 25: This slide presents Business Model with its steps. You can alter them as per your requirement.
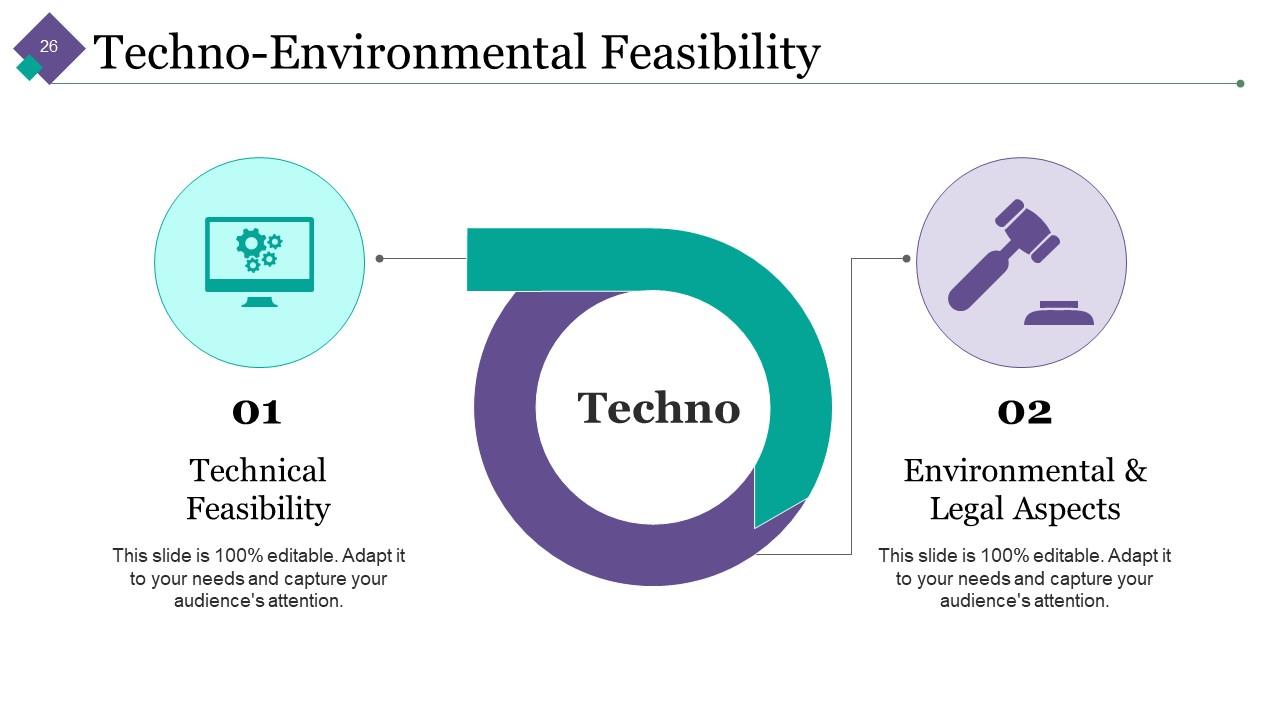
Slide 26: This is Techno-Environmental Feasibility slide to show two of its factors- Technical Feasibility, Environmental & Legal Aspects. Alter as per need.
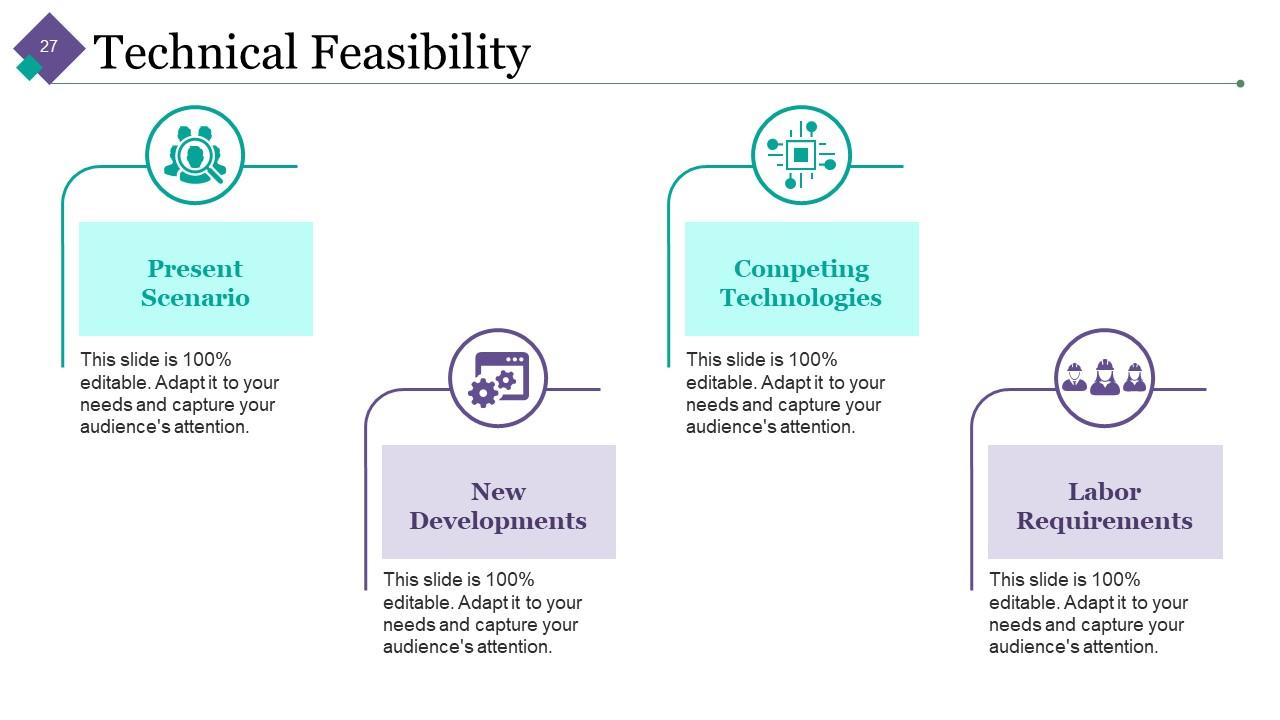
Slide 27: This is Technical Feasibility slide showing- New Developments, Competing Technologies, Labor Requirements, Present Scenario.
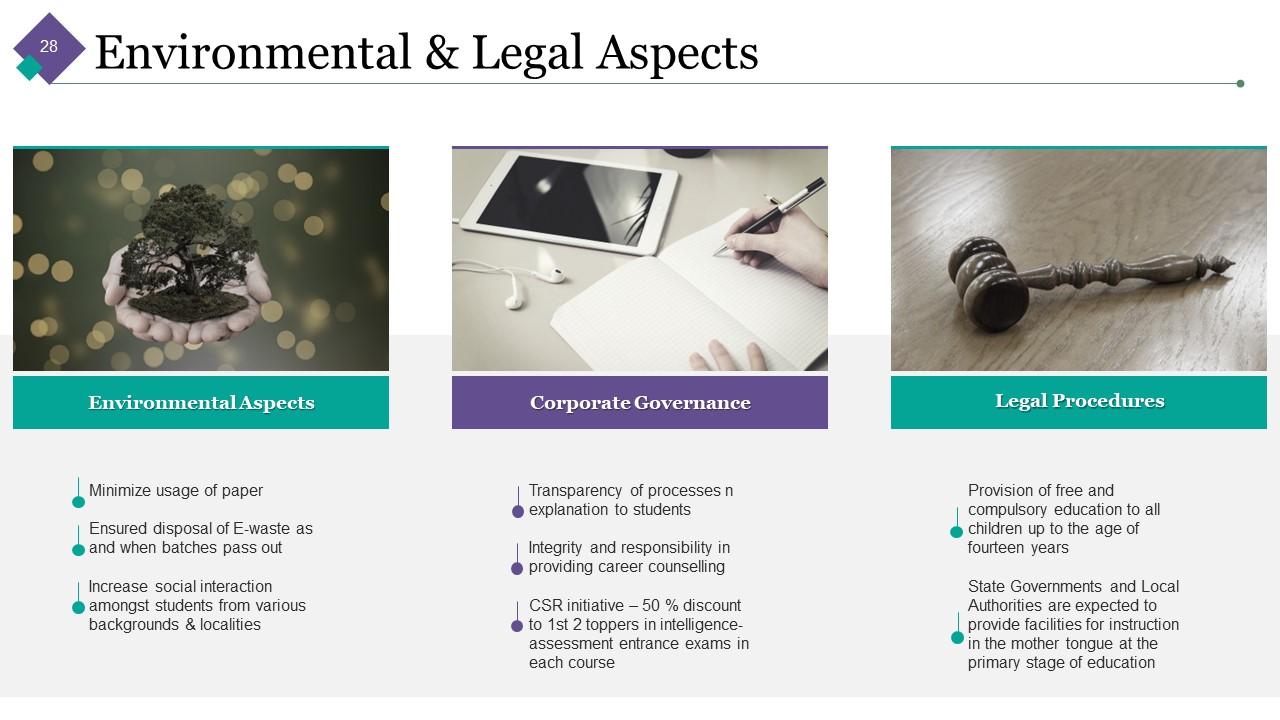
Slide 28: This slide shows Environmental & Legal Aspects.
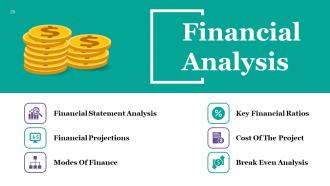
Slide 29: This slide shows Financial Analysis with the following- Key Financial Ratios Cost Of The Project Break Even Analysis Financial Statement Analysis Financial Projections Modes Of Finance
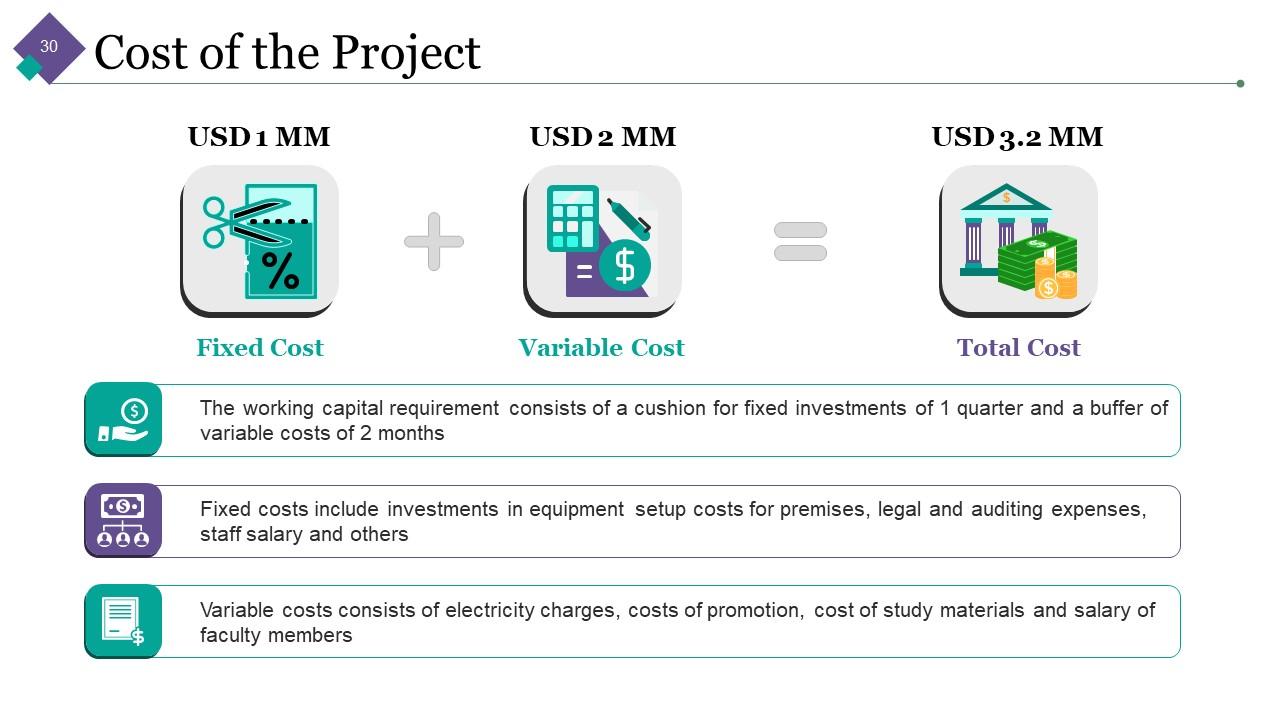
Slide 30: This slide states the Cost of the Project. Add relevant data and use it.
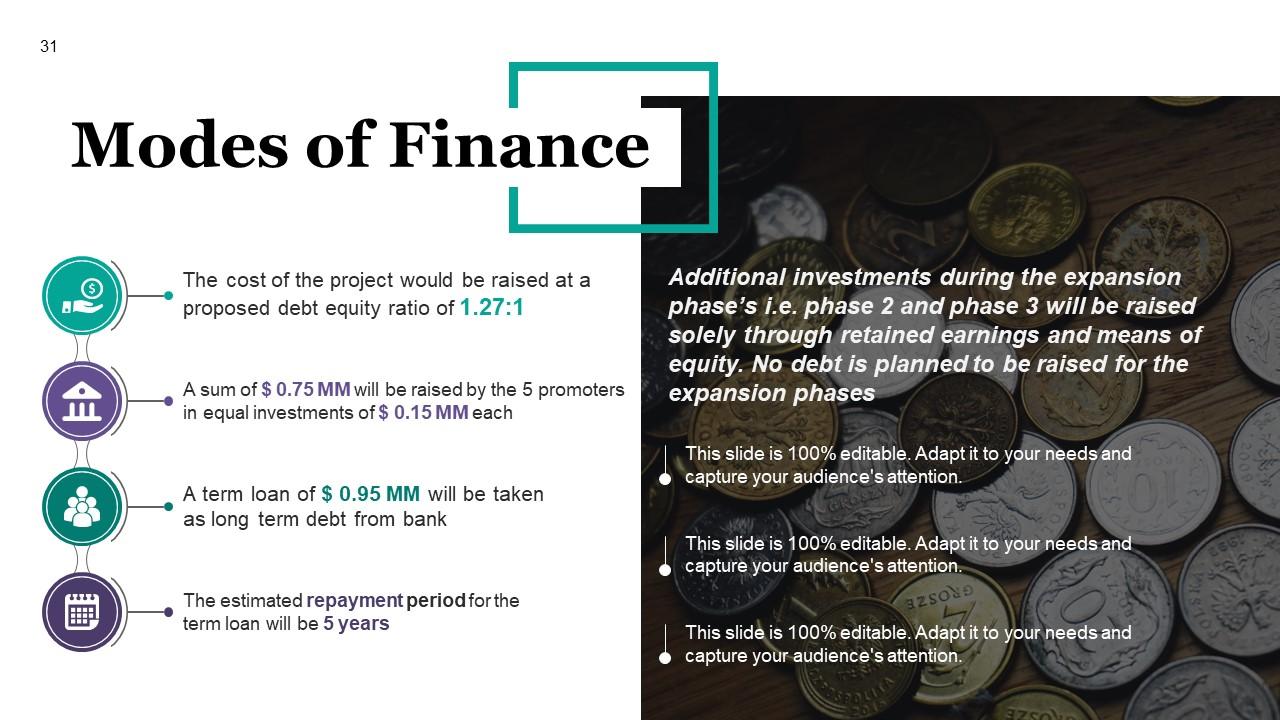
Slide 31: This slide states the Modes of Finance.
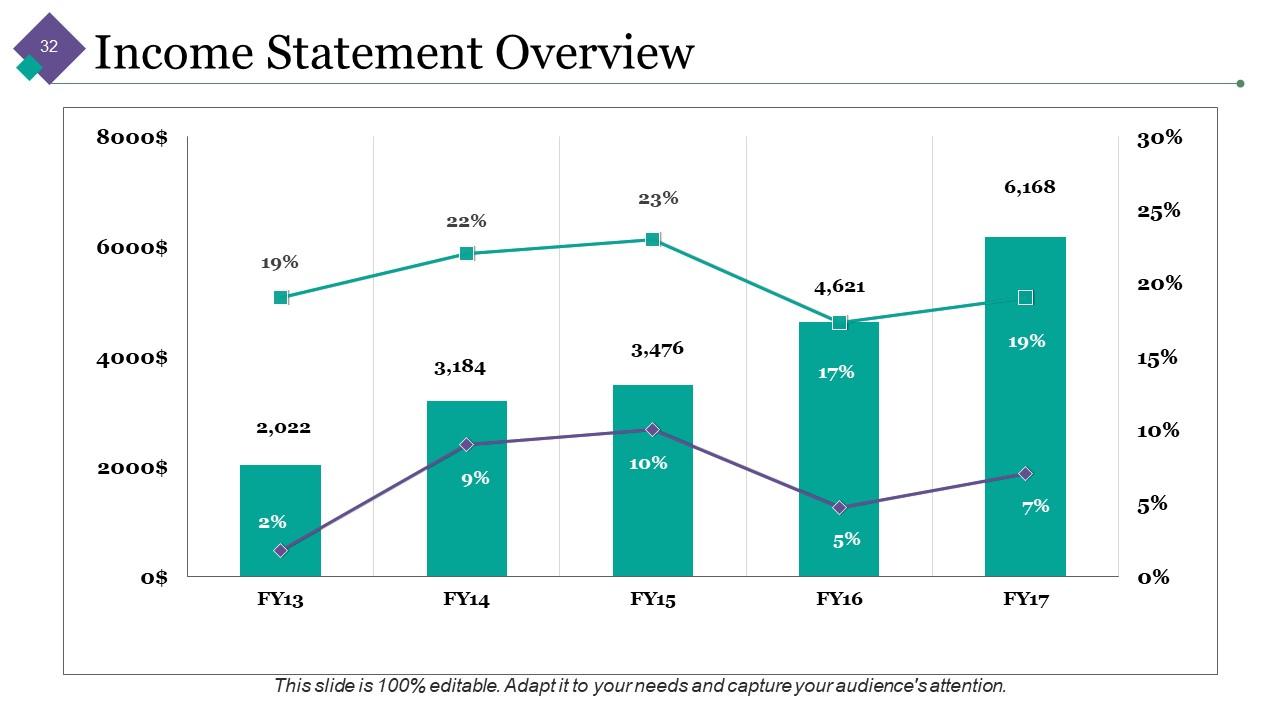
Slide 32: This slide presents Income Statement Overview in a graphical form.
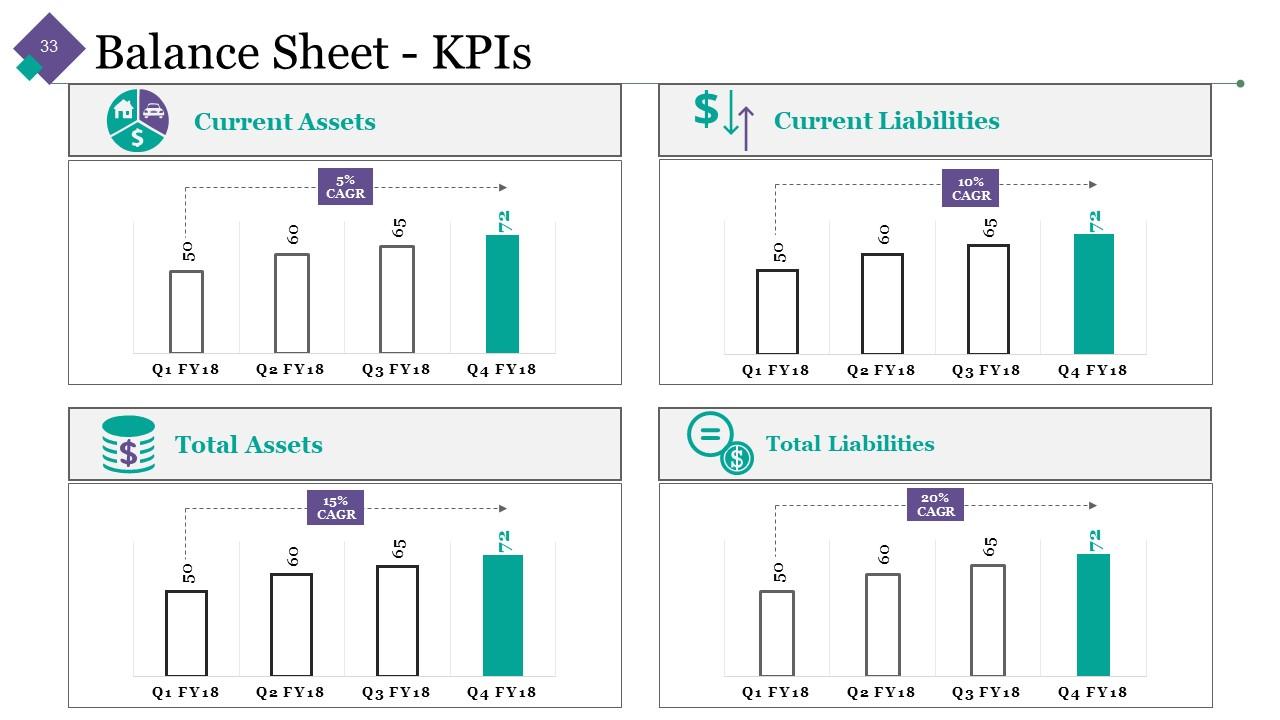
Slide 33: This slide displays Balance Sheet - KPIs.
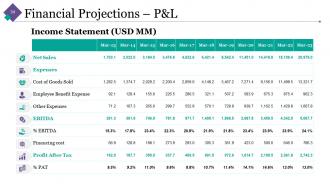
Slide 34: This slide shows Financial Projections – P&L.
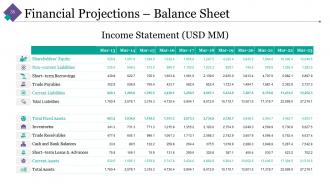
Slide 35: This slide shows Financial Projections – Balance Sheet.
Slide 36: This is a Coffee Time slide. Alter/ modify as per need.
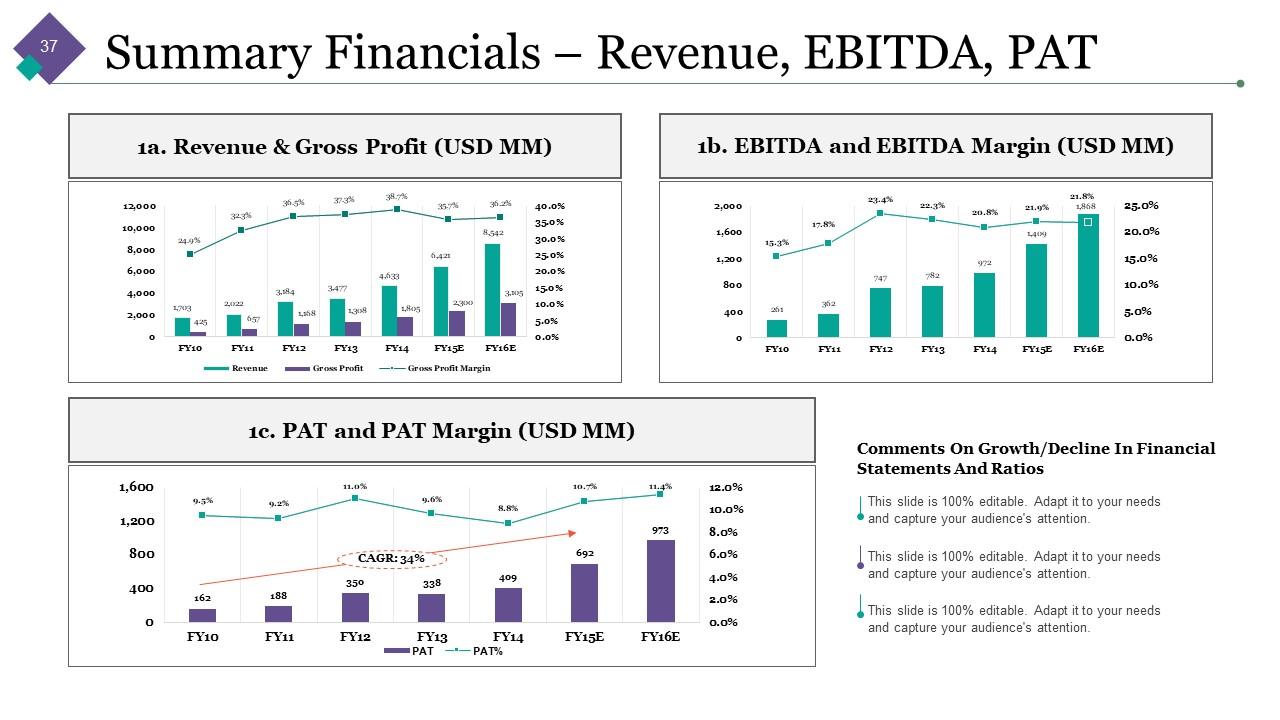
Slide 37: This slide presents Summary Financials – Revenue, EBITDA, PAT.
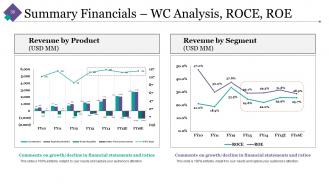
Slide 38: This slide presents Summary Financials – WC Analysis, ROCE, ROE in charts and graphs.
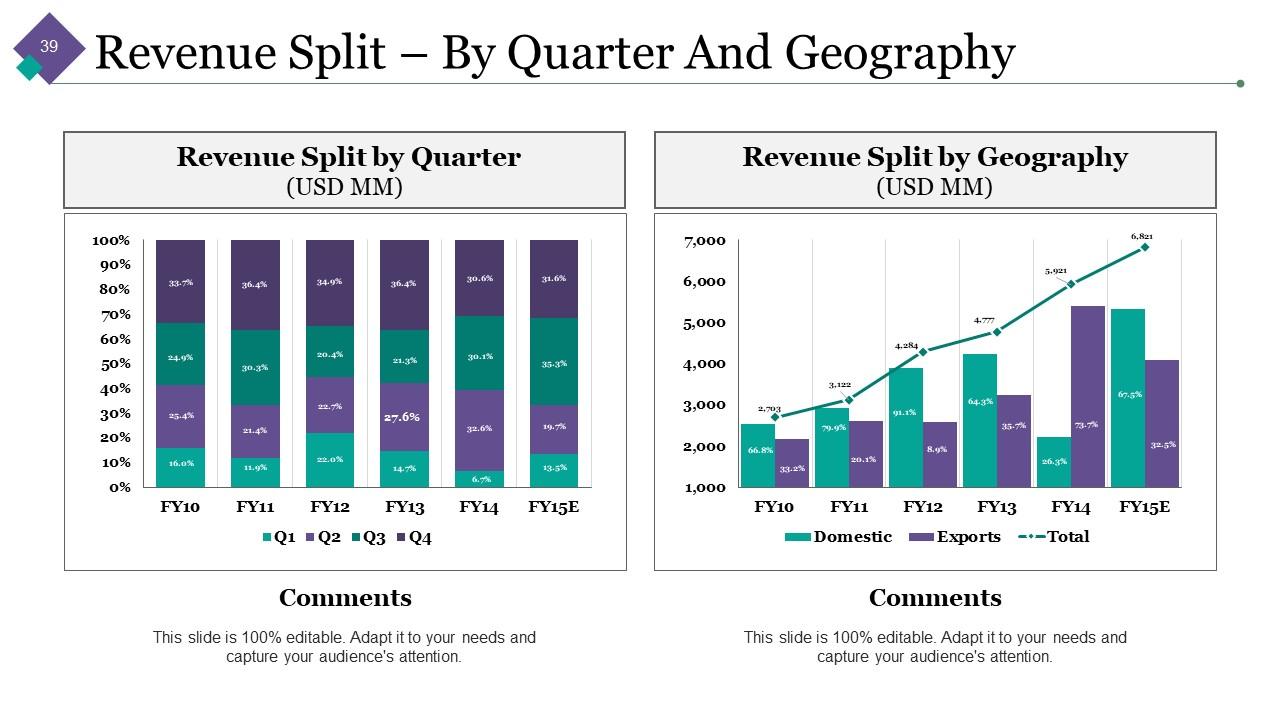
Slide 39: This slide shows Revenue Split – By Quarter And Geography.
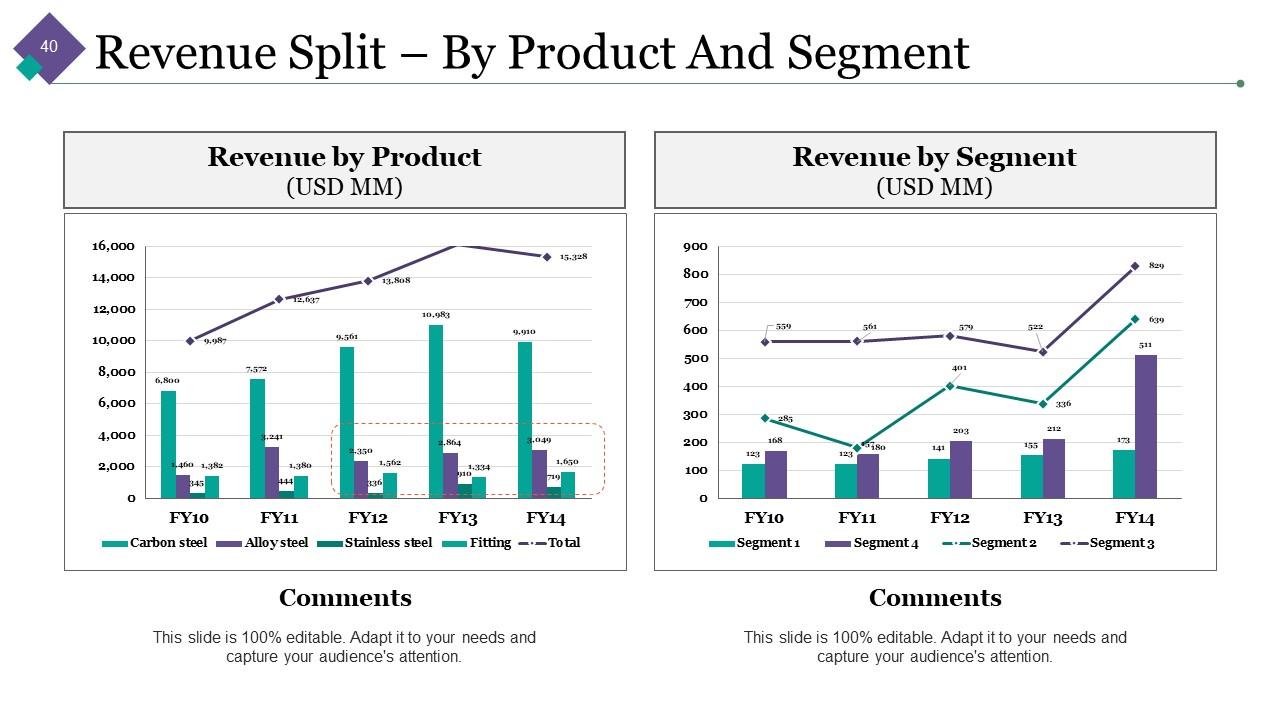
Slide 40: This slide shows Revenue Split – By Product And Segment.
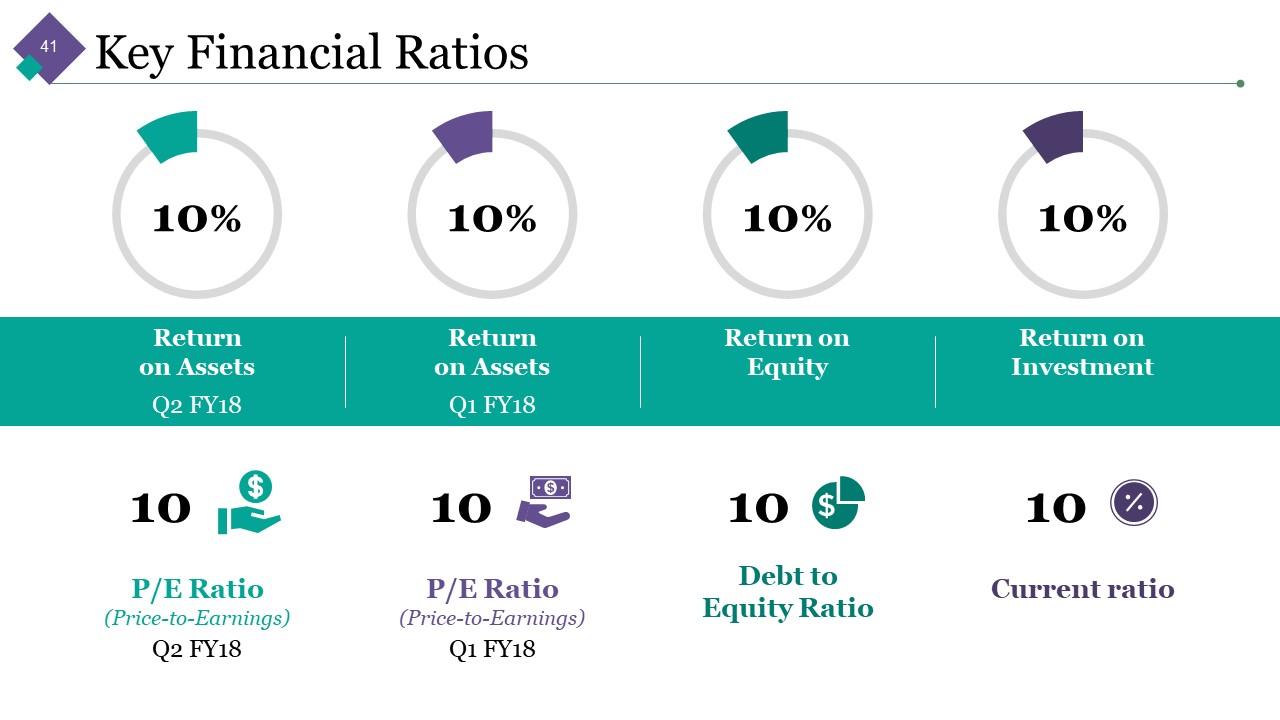
Slide 41: This slide shows Key Financial Ratios. We have stated a few of them, use them as per your need.
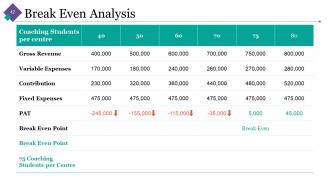
Slide 42: This slide shows Break Even Analysis.
Slide 43: This is Project Conclusion & Proposal with- Work plan- implementation schedule, Goals of funding, Proposal to banker.
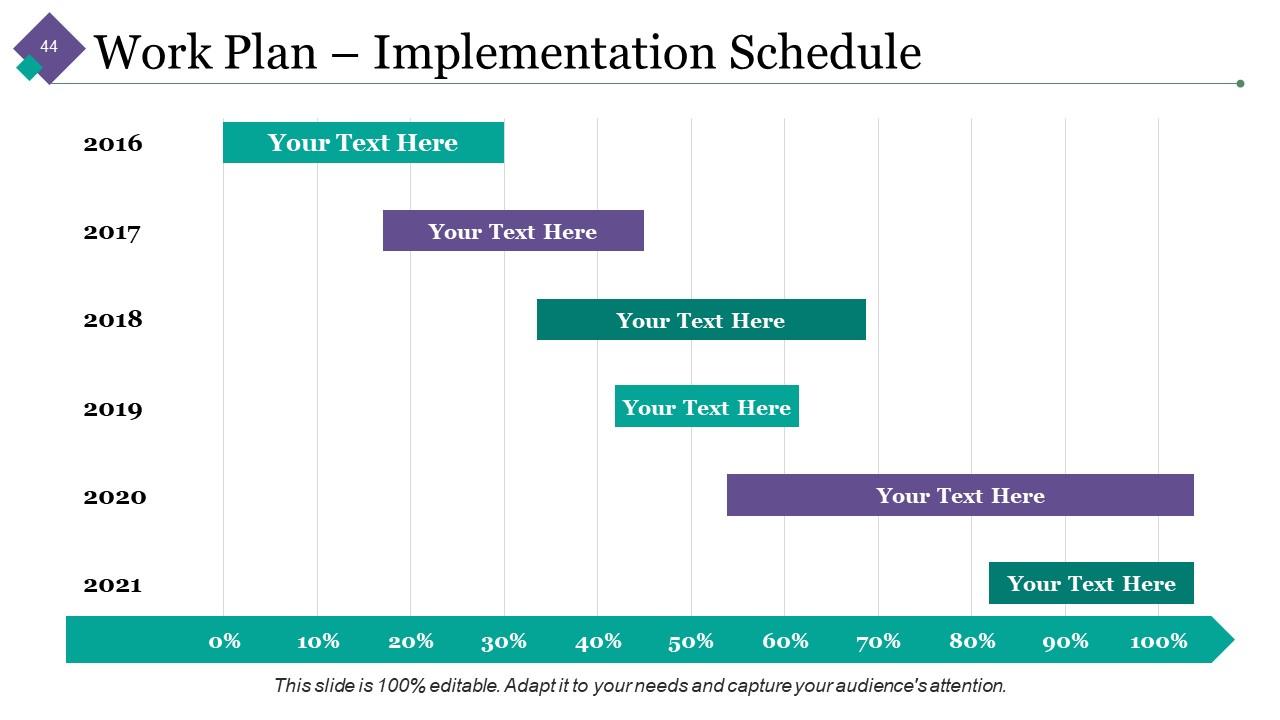
Slide 44: This is shows Work Plan – Implementation Schedule in a timeline form.
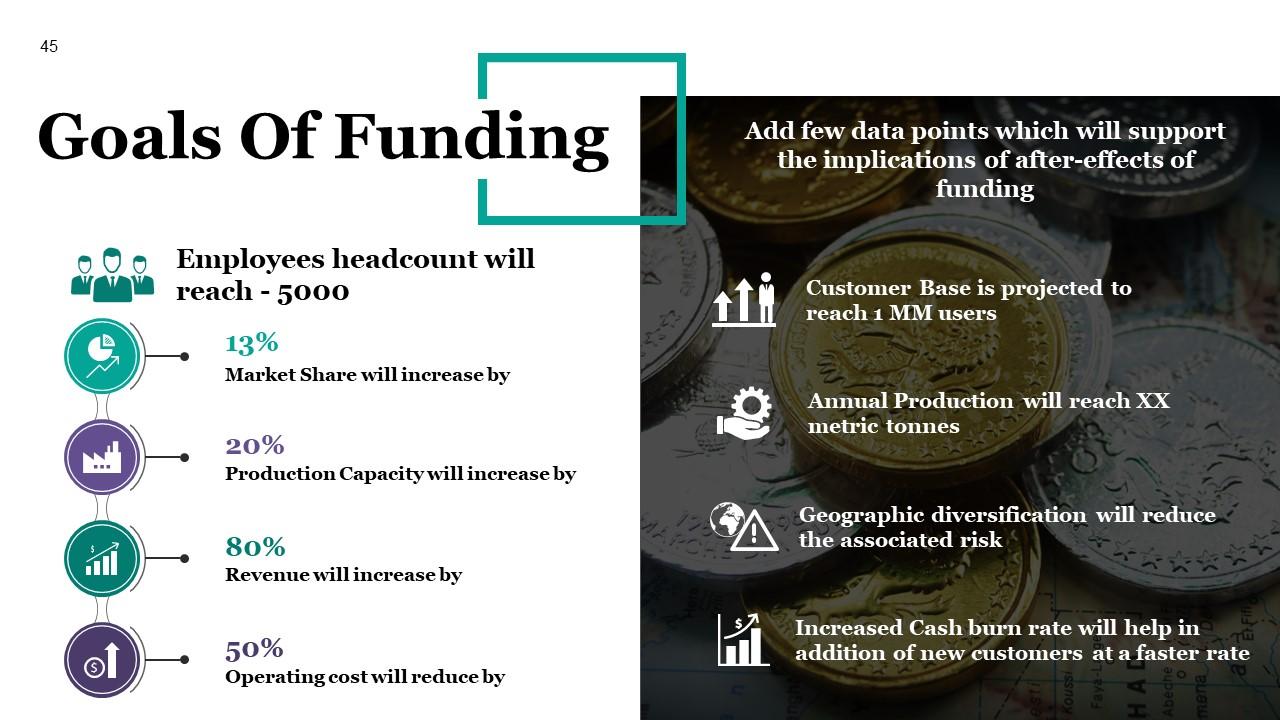
Slide 45: This slide shows Goals Of Funding with imagery.
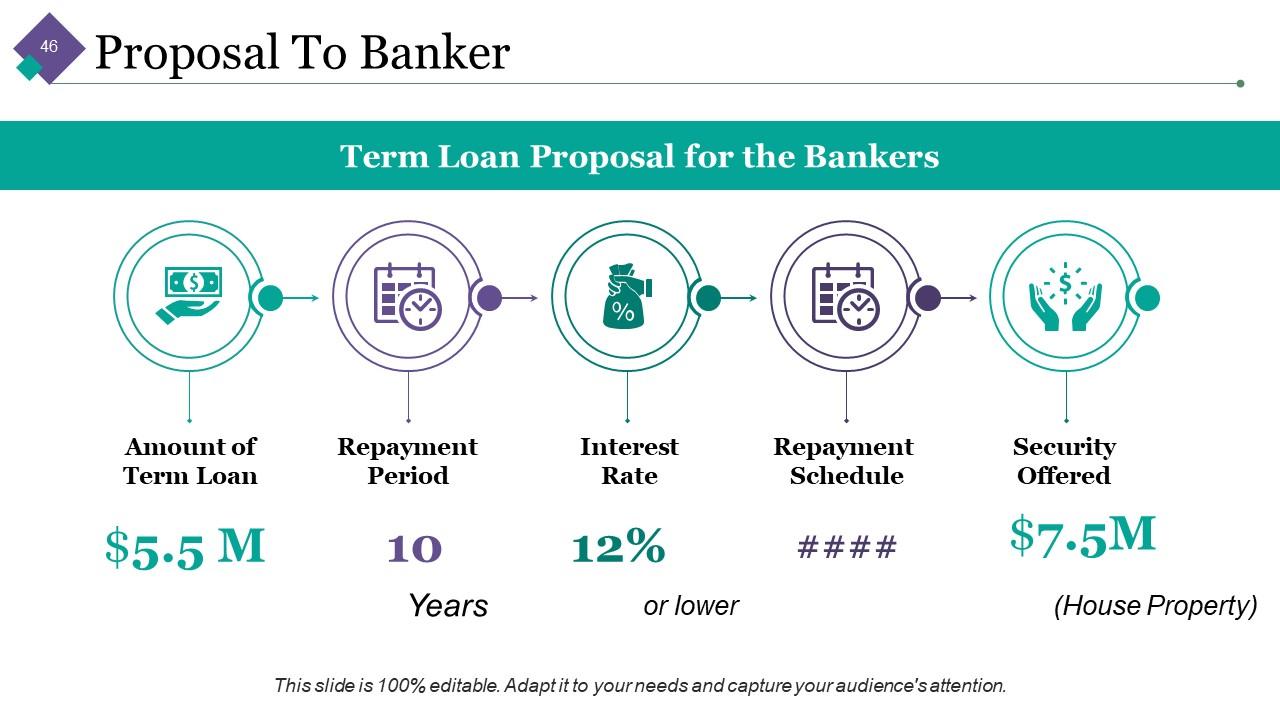
Slide 46: This is Proposal To Banker slide showing Term Loan Proposal for the Bankers.
Slide 47: This slide forwards to Charts & Graph. Alter/ modify as per need.
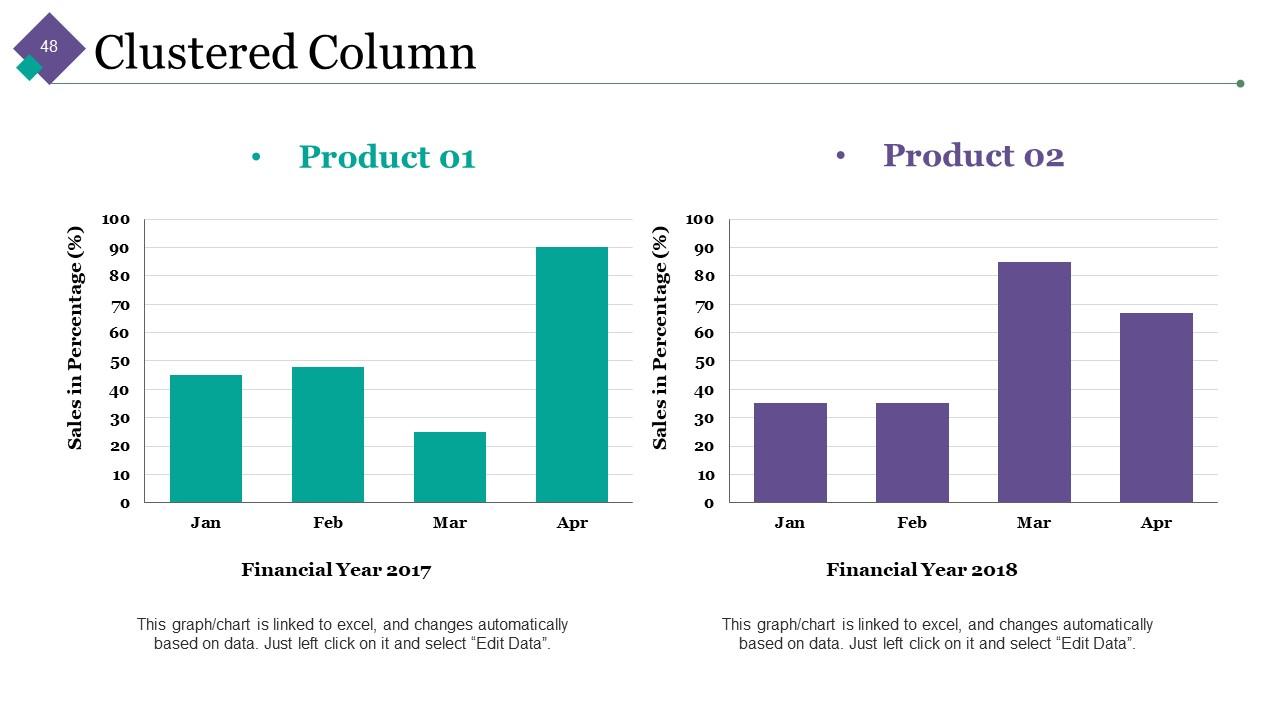
Slide 48: This is a Clustered Column slide to present product/ entity comparison, specifications etc.
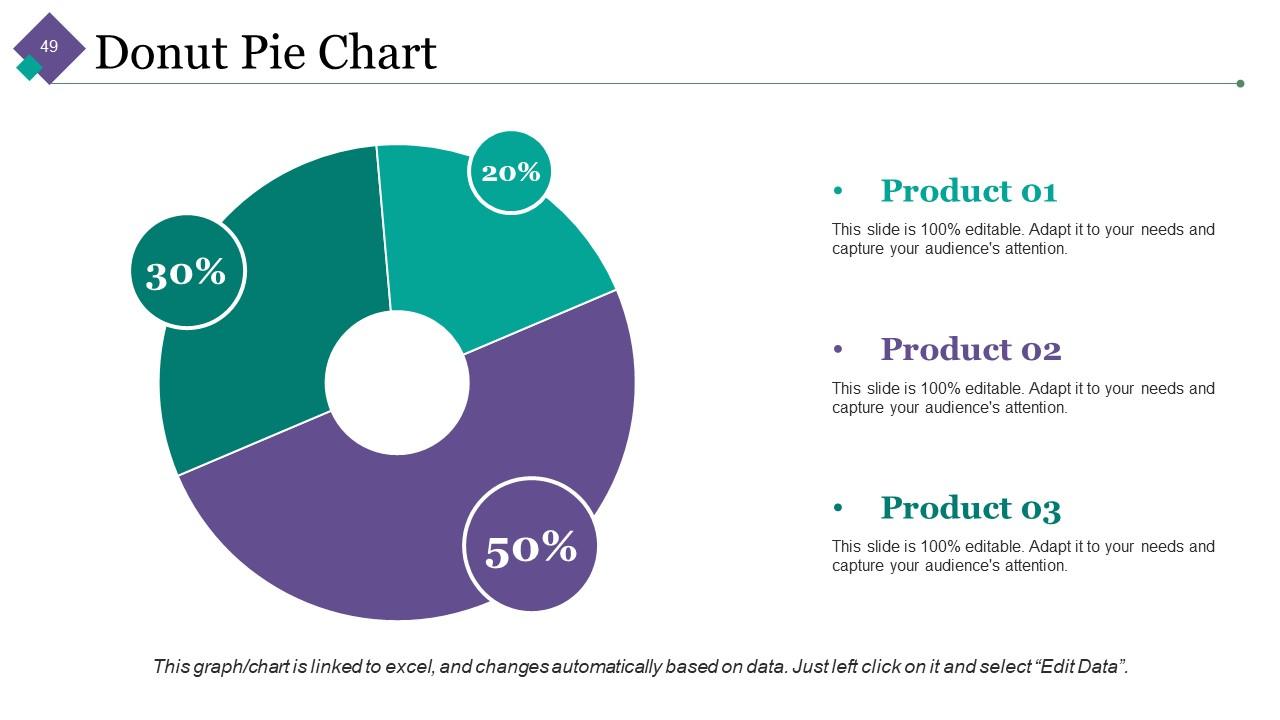
Slide 49: This slide presents a Donut Pie Chart. Add text as per need.
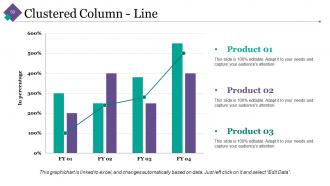
Slide 50: This is a Clustered Column - Line slide to present product/ entity comparison, specifications etc.
Slide 51: This slide is titled Additional Slides. You can change the slide content as per your needs.
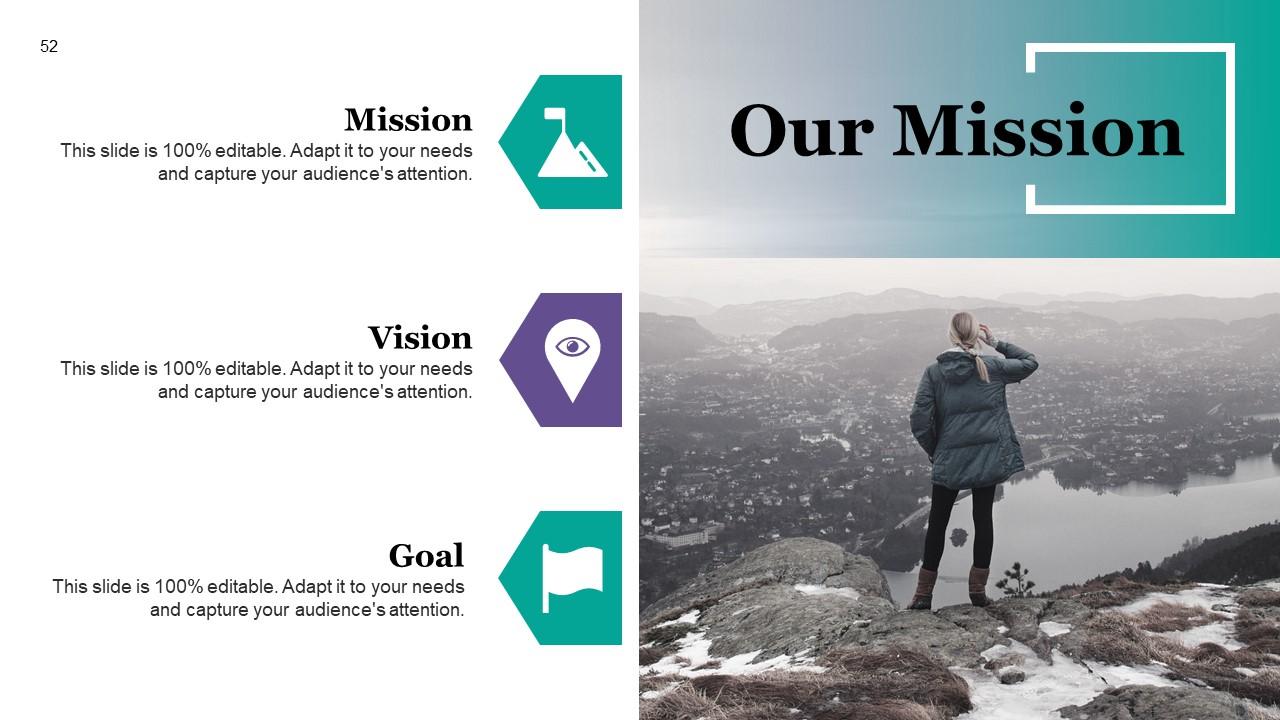
Slide 52: This is Our Mission slide with text boxes to state.
Slide 53: This is an Our Team slide with name, image and text boxes to put the required information.
Slide 54: This is an About Us slide. State company or team specifications here.
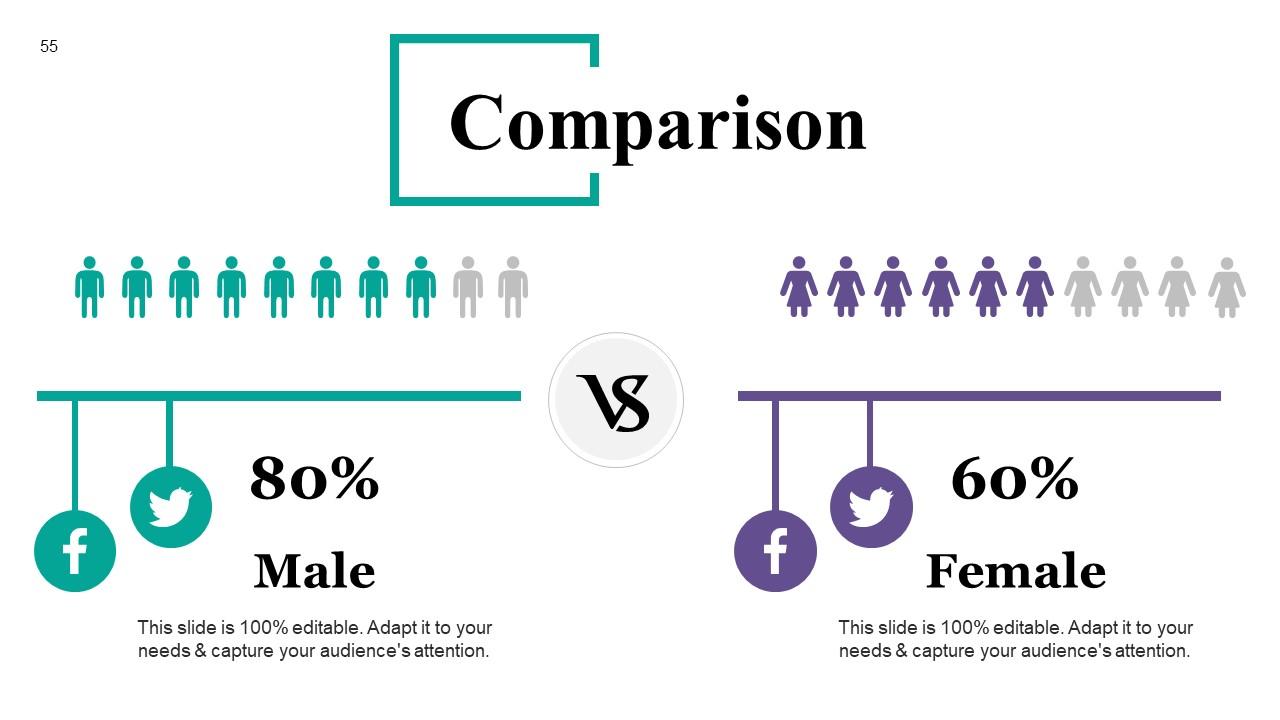
Slide 55: This slide shows Comparison of two entities.
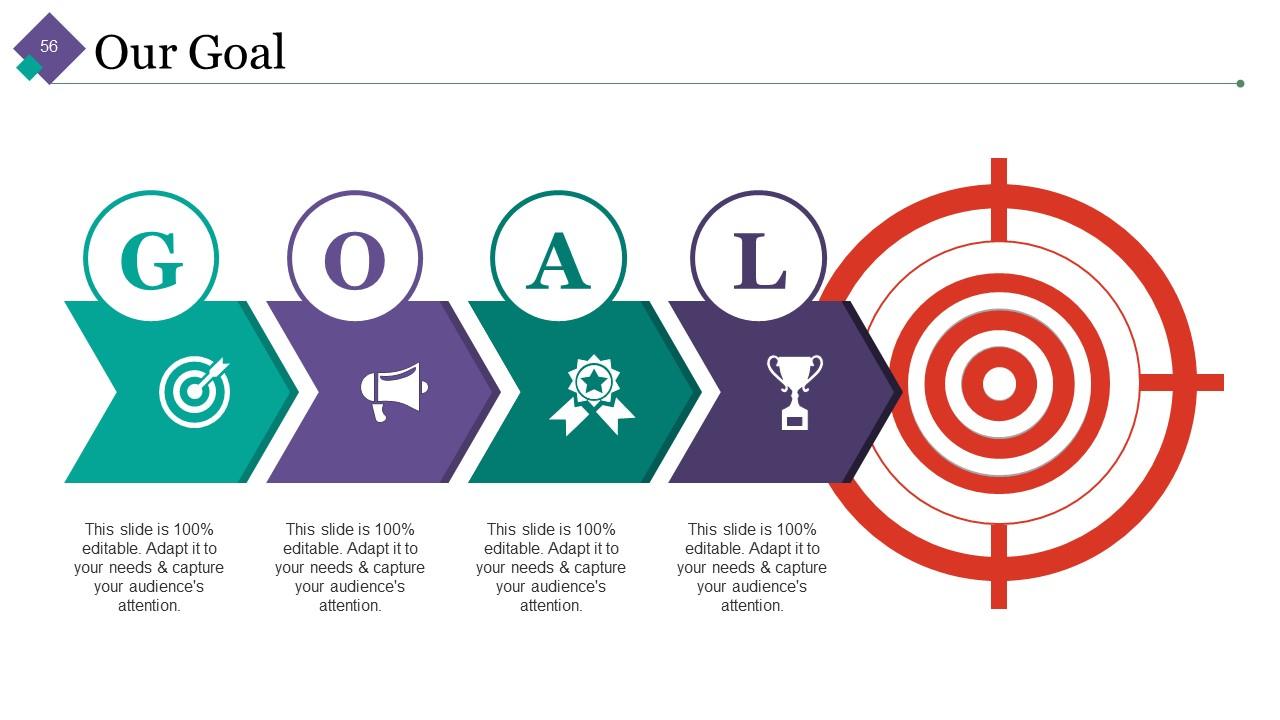
Slide 56: This is Our Goal slide with target imagery.
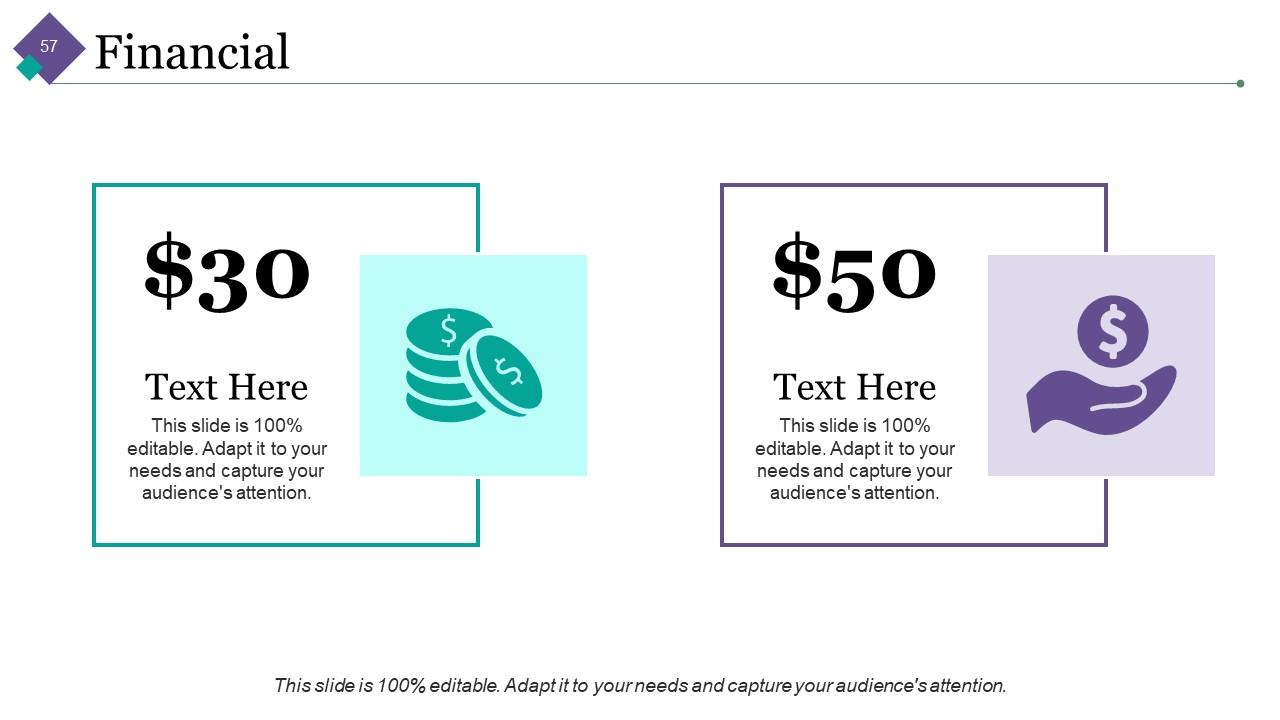
Slide 57: This slide is titled as Financials. Show finance related stuff here.
Slide 58: This is a Business Quotes slide to quote something you believe in.
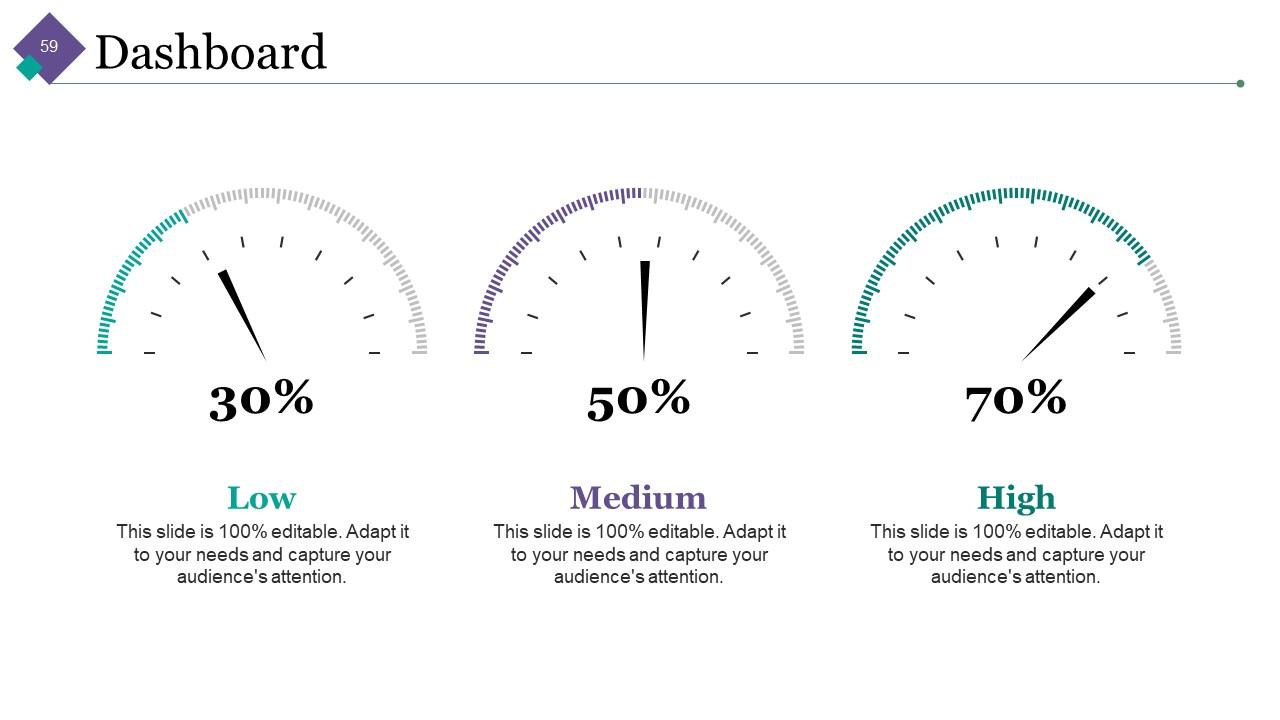
Slide 59: This slide presents the Dashboard with low, medium and high parameters.
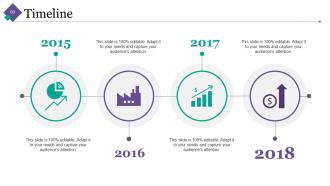
Slide 60: This is a Timeline slide to present important dates, journey, evolution, milestones etc.
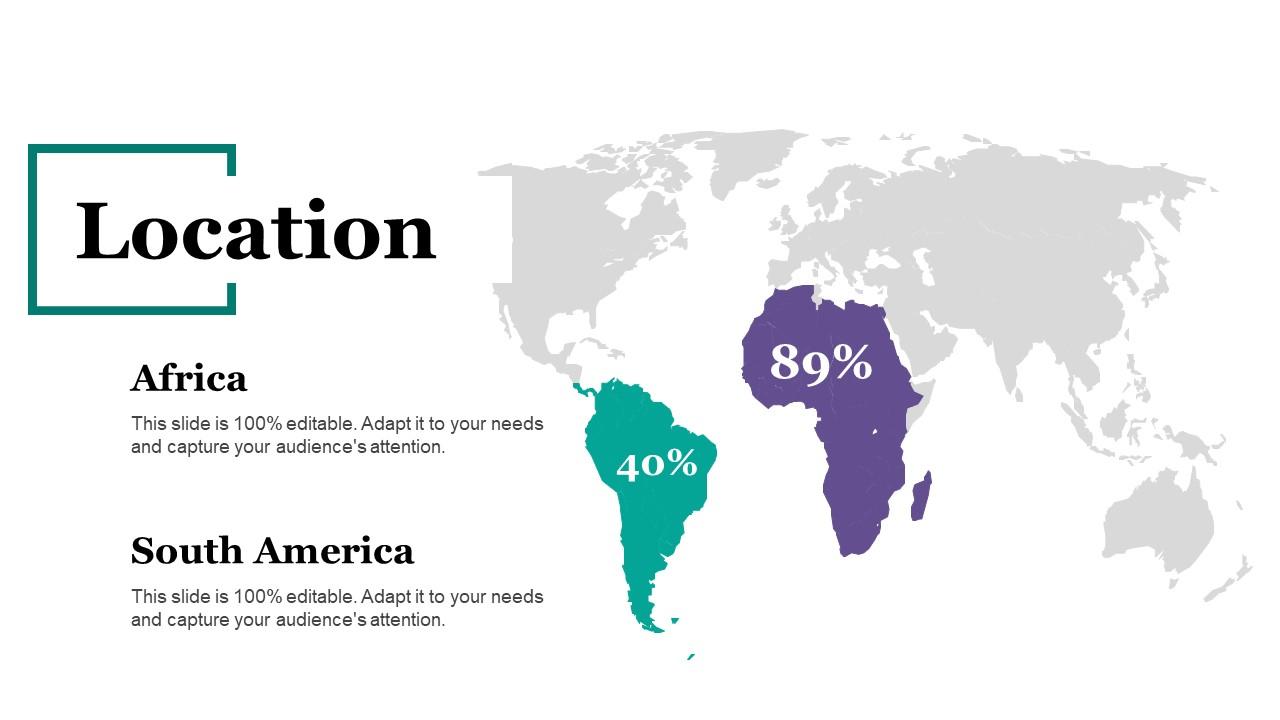
Slide 61: This is a Location slide to show global growth, presence etc. on a world map image.
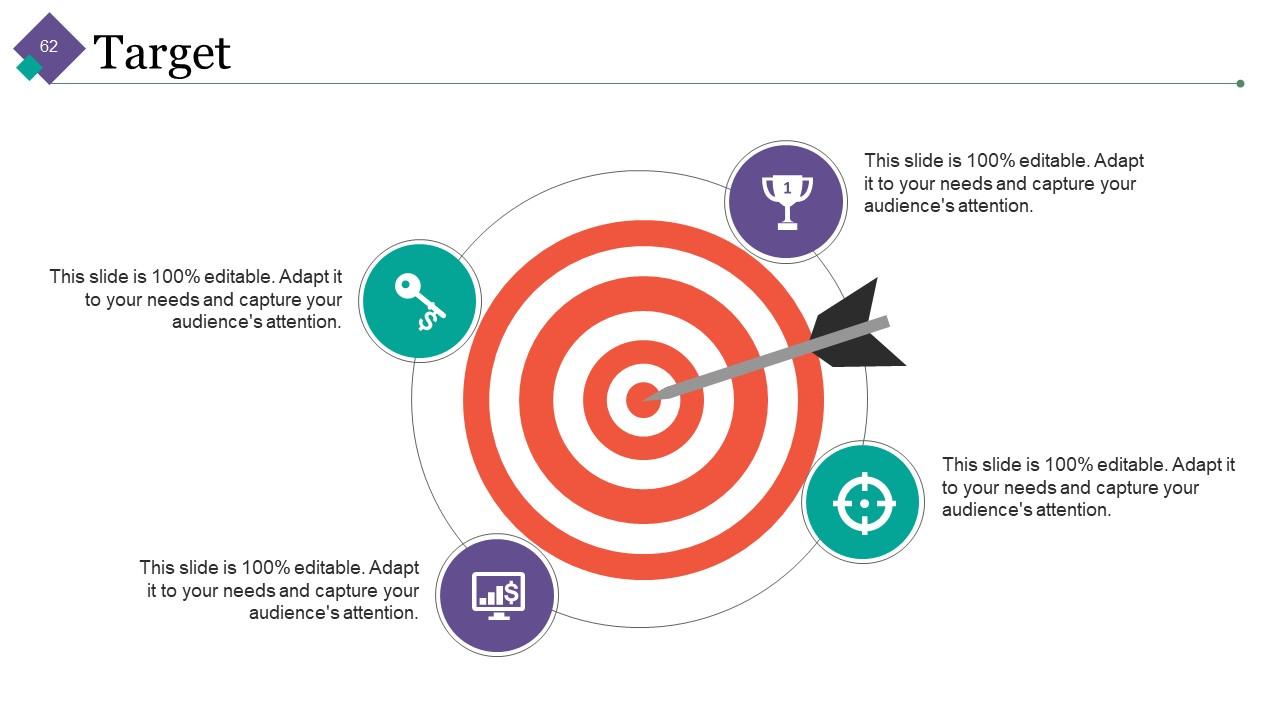
Slide 62: This slide shows Target image with text boxes.
Slide 63: This is a Mind map image slide to show information, specifications etc.
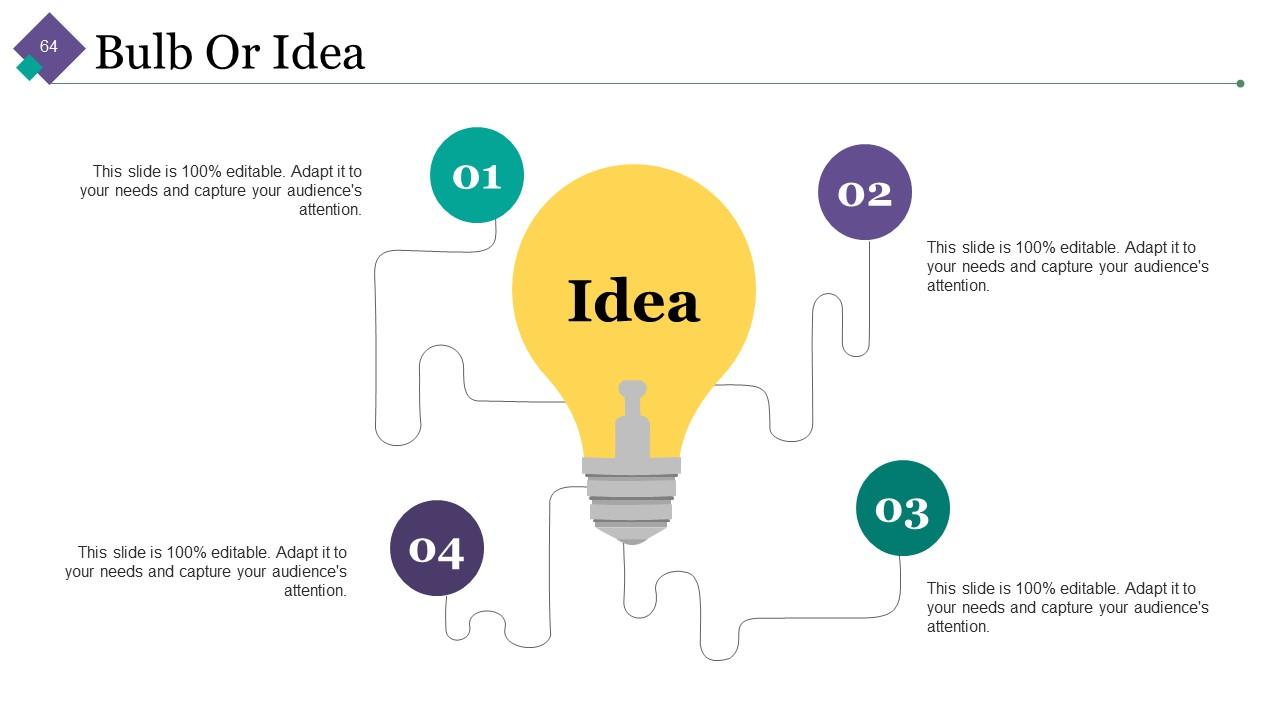
Slide 64: This is a Bulb or Idea image slide to show ideas, innovative information etc.
Slide 65: This is a Magnifying Glass image slide to show information, specifications etc.
Slide 66: This is a Thank You slide with Address# street number, city, state, Contact Number, Email Address.
Project Investment Analysis And Appraisal Powerpoint Presentation Slides with all 66 slides:
Familiarize folks with handling injuries with our Project Investment Analysis And Appraisal Powerpoint Presentation Slides. Enlighten them about first aid.
-
Attractive design and informative presentation.
-
Awesomely designed templates, Easy to understand.


