- Sub Categories
-
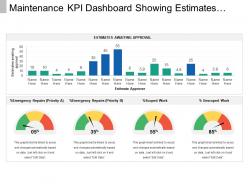 Maintenance kpi dashboard snapshot showing estimates awaiting approval
Presenting maintenance KPI dashboard snapshot showing estimates awaiting approval PPT slide. This layout is fully compatible with Google slides and data driven. User can edit the data in linked excel sheet and the design will change accordingly. Easy to put in company logo, trademark or name; accommodate words to support the key points. Images do no distort out even when they are projected on large screen. Adjust colors, text and fonts as per your business requirements.
-
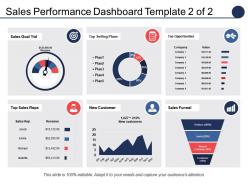 Sales Performance Dashboard Top Selling Plans Top Opportunities
Presenting sales performance dashboard top selling plans top opportunities PPT template. Completely amendable by any user at any point of time without any hassles. Error free performance to put an everlasting impression on the viewers. Great for incorporating business details such as name, logo and trademark. Can be utilized by students, entrepreneurs, investors and customers. Professionally designed presentation slides. Personalize the presentation with individual company name and logo. Available in both Standard and Widescreen slide size.
-
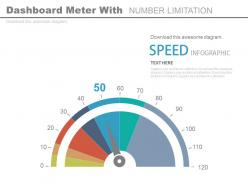 Dashboard Snapshot meter with number limitation powerpoint slides
Pre- made Presentation slide. Flexible option for conversion in PDF or JPG formats. Can use with Google slides. Colors, icons and text can be easily changed as the PPT slide is completely editable. Customize the presentation with business name and logo. Available in both Standard and Widescreen slide size. Quick download and easily shareable. Benefitted for business intelligence, data analysis, financial reporting, IT support, sales monitoring etc.
-
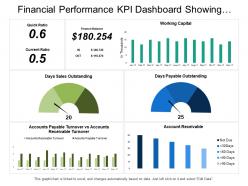 Financial performance kpi dashboard showing quick ratio current ratio working capital
Presenting this set of slides with name - Financial Performance Kpi Dashboard Showing Quick Ratio Current Ratio Working Capital. This is a three stage process. The stages in this process are Financial Performance, Financial Report, Financial Review.
-
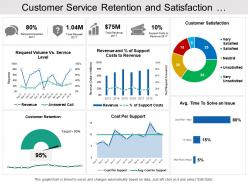 Customer service retention and satisfaction dashboard
Presenting this set of slides with name - Customer Service Retention And Satisfaction Dashboard. This is a six stage process. The stages in this process are Customer Base, Recurring Customers, Customer Services.
-
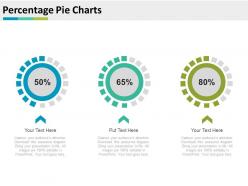 Percentage Pie Charts For Merger And Acquisitions Powerpoint Slides
Maintenance of overwhelming quality visuals all through the presentation. Compatible with wide screen yield. Can be satisfactorily used with any number of on the web and detached programming. The business slide outline is concordant with various courses of action decisions. Give it a more modified look with your association logo and name. Edit the PPT shape, tones, shade, substance and then some. Used by advancing guides, agents, advertisers, merchants, and business people.
-
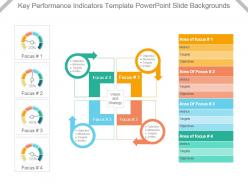 Key performance indicators template powerpoint slide backgrounds
Excellent use colors in the presentation template. Imaginatively created PowerPoint shape with modification options. Easily adjustable PPT slide as can be converted into JPG and PDF format. Conforming designs accessible to different nodes and stages. Great pixel quality as image quality remains relentless on every screen size. Choice to reveal slide in standard 4:3 widescreen 16:9 view. Presentation graphic suitable with Google slides. Fast download saves valuable time. Makes it easier to share the information with ease with large set of viewers. Easy to portray the KRAs related to the work.
-
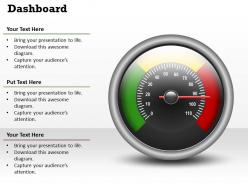 0314 dashboard business design slide
Allow editing or replacing of the icons. Provided instructions to change and edit the slide icon. Easy to download and save in the Jpg or PDF format. Access to open on a wide screen view. Offer to change the content, size, style and orientation of the slide icons. Useful for the sales professionals and the business learners and geography students.
-
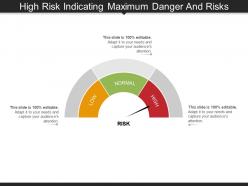 High risk indicating maximum danger and risks
Presenting this set of slides with name - High Risk Indicating Maximum Danger And Risks. This is a three stage process. The stages in this process are Risk Meter, Risk Speedometer, Hazard Meter.
-
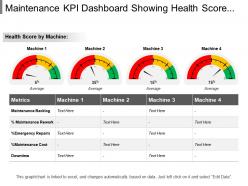 Maintenance kpi dashboard showing health score by machine
Presenting maintenance KPI dashboard showing health score by machine PowerPoint slide. This PPT slide offers you plenty of space to put in titles and sub titles. High resolution based presentation layout, does not change the image even after resizing. This presentation icon is fully compatible with Google slides. Quickly downloads and simple editing options in color text and fonts. Can easily be changed into JPEG and PDF applications. This diagram has been designed for entrepreneurs, corporate and business managers.
-
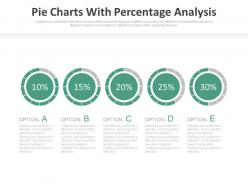 Five Staged Pie Charts With Percentage Analysis Powerpoint Slides
Capture the interest of your audience with a vibrant showcase of supreme quality visuals. Customize on the colour part, orientation scheme, and size restructuring to cast a suitable interface of the slide. Play it on Google Slides with a convenient download option in multiple file formats. Utilize the ample text space for an explanatory write-up. A complete user guide follows the slide for easy transformation.
-
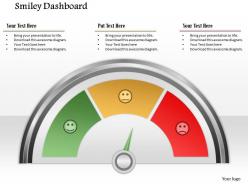 1114 smiley dashboard powerpoint presentation
Current Trends have been followed to craft these astonishing designs. Completely modifiable by following simple instructions. Ungrouping of objects is easy and convenient. They have a futuristic and realistic approach. They have well-matched framework with Google. In just a matter of seconds these can be downloaded to save your valuable time.
-
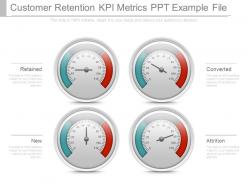 Customer retention kpi metrics ppt example file
Presenting customer retention kpi metrics ppt example file. This is a customer retention kpi metrics ppt example file. This is a four stage process. The stages in this process are retained, converted, new, attrition.
-
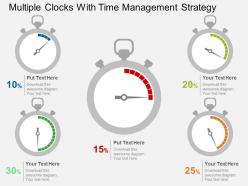 Multiple clocks with time management strategy flat powerpoint design
Ready made PPT graphic helps in saving time and effort. Include or exclude slide content as per your individual need. Colors, visuals and text can be easily changed as the PPT slide is completely editable. Personalize the presentation with individual company name and logo. This PPT Slide is available in both Standard and Widescreen slide size. Easy and quick downloading process. Flexible option for conversion in PDF or JPG formats. Compatible with Google slides.
-
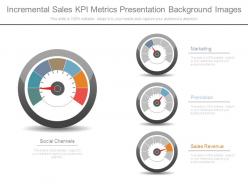 Incremental sales kpi metrics presentation background images
Presenting incremental sales kpi metrics presentation background images. This is a incremental sales kpi metrics presentation background images. This is a four stage process. The stages in this process are social channels, marketing, promotion, sales revenue.
-
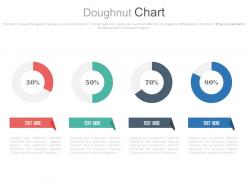 Four doughnut chart with percentage analysis powerpoint slides
Presenting four doughnut chart with percentage analysis powerpoint slides. This Power Point template slide has been crafted with graphic of four doughnut chart and percentage diagram. This PPT slide contains the concept of financial data analysis. Use this PPT slide for business and finance related presentations.
-
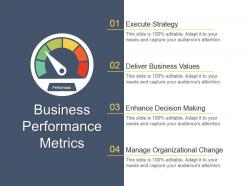 Business performance metrics powerpoint ideas
Presenting business performance metrics powerpoint ideas. This is a business performance metrics powerpoint ideas. This is a four stage process. The stages in this process are execute strategy, deliver business values, enhance decision making, manage organizational change.
-
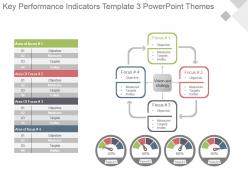 Key performance indicators template 3 powerpoint themes
Presenting key performance indicators template 3 powerpoint themes. This is a key performance indicators template 3 powerpoint themes. This is a four stage process. The stages in this process are objective, measures, targets, invites.
-
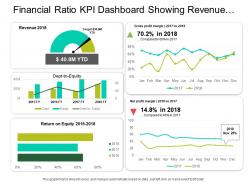 Financial ratio kpi dashboard showing revenue net profit margin and debt to equity
Presenting this set of slides with name - Financial Ratio Kpi Dashboard Showing Revenue Net Profit Margin And Debt To Equity. This is a five stage process. The stages in this process are Accounting Ratio, Financial Statement, Financial Ratio.
-
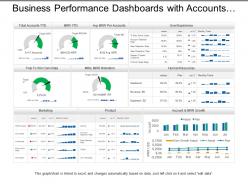 Business performance dashboards snapshot with accounts and mrr growth
Presenting, our business performance dashboards snapshot with accounts and mr growth PPT layout. High pixel resolution of the designs. Easy to edit and save using google slides. 100% modification of the slides granted. Apply your company name, replacing the official trademark in the slides. Valuable for the Marketing Professionals, business managers, and the directors. Includes extensive text spaces to include a title and can be easily projected to a widescreen.
-
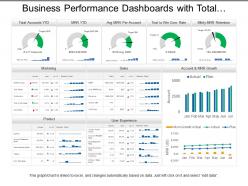 Business performance dashboards with total accounts marketing and product
Presenting, business performance dashboards with total accounts marketing and product PowerPoint template. High-resolution PPT slide to reflect on business performance. The content is accurate and ready to use. Modifiable framework, layout, and font type, font size, and color schemes. Can be quickly transformed into PDF and JPG format. Appealing graphs for illustration and captivating figures to illustrate the idea. Can be extended to widescreen without loss of quality. Compatible with Google Slides and widescreens.
-
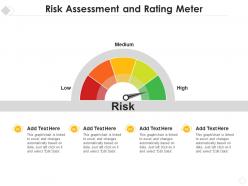 Risk assessment and rating meter
Presenting our set of slides with Risk Assessment And Rating Meter. This exhibits information on three stages of the process. This is an easy to edit and innovatively designed PowerPoint template. So download immediately and highlight information on Risk Assessment And Rating Meter.
-
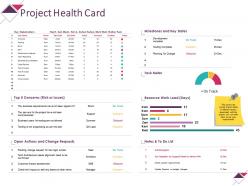 Project health card powerpoint slide information
Presenting this set of slides with name - Project Health Card Powerpoint Slide Information. This is a six stage process. The stages in this process are Task Meter, Resource Work Load, Open Actions And Change, Dashboard, Business.
-
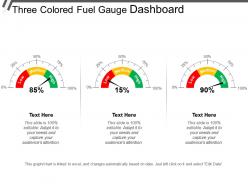 Three colored fuel gauge dashboard
Presenting this set of slides with name - Three Colored Fuel Gauge Dashboard. This is a three stage process. The stages in this process are Fuel Gauge, Gas Gauge, Fuel Containers.
-
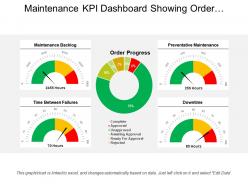 Maintenance kpi dashboard showing order progress and backlog
Presenting our maintenance KPI dashboard showing order progress and backlog. This PPT slide offers you plenty of space to put in titles and sub titles. High resolution-based presentation layout, does not change the image even after resizing. This presentation icon is data driven and template can be downloaded via excel file to incorporate data. Quick downloading speed and simple editing options in color text and fonts.PPT icons can easily be changed into JPEG and PDF applications.
-
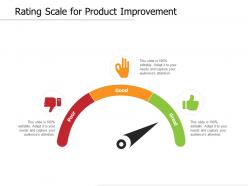 Rating scale for product improvement
Presenting this set of slides with name Rating Scale For Product Improvement. This is a three stage process. The stages in this process are Product Improvement, Rating Scale, Product Quality. This is a completely editable PowerPoint presentation and is available for immediate download. Download now and impress your audience.
-
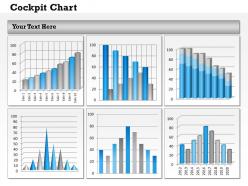 0314 dashboard to visualize business data
Painless proofing and change in attribute features in presentation visual. Presentation slide is useful in business marketing, management sales, and human resources management. Professional theme which supports alteration in font, color and layout. Interesting color scheme gives an executive look to PPT layout. Transformation into PDF or JPG formats is trouble free and effortless.
-
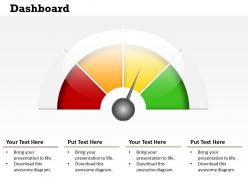 0314 dashboard design business theme
Pixel friendly images and graphics in the slide design. Easy to download and save in the format you like. Replace the content with your business information. Access to use with the Google Slides. Open on a wide screen view without any fear of pixelating. Beneficial for the strategy designers, doctors, patients and related staff.
-
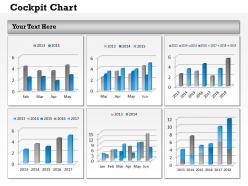 0314 display data in dashboard snapshot layout
Useful for manufacturing concerns and other multi-national companies. High resolution graphics prevent pixilation on bigger and wider screens. Small size layout is quick to download and compatible with Google slides. Runs with softwares and can accommodate company’s details with respect to trademarks, name or logo. Easily changeable into PDF and JPEG formats. No space constraints for adding titles and sub-titles.
-
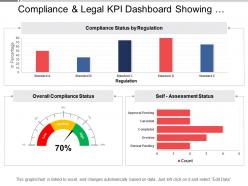 Compliance and legal kpi dashboard showing overall compliance status
Presenting this set of slides with name - Compliance And Legal Kpi Dashboard Showing Overall Compliance Status. This is a three stage process. The stages in this process are Compliance And Legal, Legal Governance, Risk Management.
-
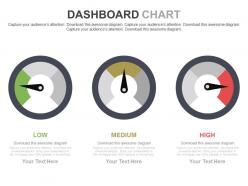 Three Meters Dashboard Charts For Analysis Powerpoint Slides
These designs create a never-ending connection between the presentation and the audience. For the Delivery of the Organisational objective these patterns act as a perfect medium. They are entirely editable. They can be viewed on big screens for more clarity and better vision. As an outcome the audience experience top notch quality presentations.
-
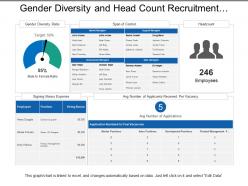 Gender diversity and head count recruitment dashboard
Presenting this set of slides with name - Gender Diversity And Head Count Recruitment Dashboard. This is a two stage process. The stages in this process are Staffing Plan, Recruitment, Staff Management.
-
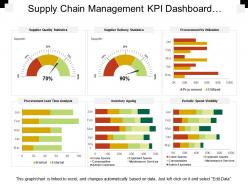 Supply chain management kpi dashboard showing procurement vs utilization
Presenting this set of slides with name - Supply Chain Management Kpi Dashboard Showing Procurement Vs Utilization. This is a six stage process. The stages in this process are Demand Forecasting, Predicting Future Demand, Supply Chain Management.
-
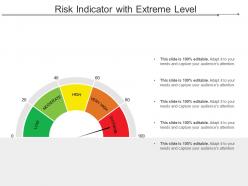 Risk indicator with extreme level
Presenting this set of slides with name - Risk Indicator With Extreme Level. This is a five stage process. The stages in this process are Risk Meter, Risk Speedometer, Hazard Meter.
-
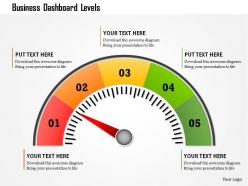 1214 business dashboard levels powerpoint presentation
We are proud to present our 1214 business dashboard levels powerpoint presentation. Colored meter with multiple levels has been used to craft this power point template. This PPT contains the concept of measurement. Use this PPT for your measurement related presentations.
-
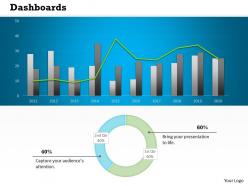 0314 Business Charts Dashboard Design
Supreme Quality PPT presentation layouts. Makes the entire information look interesting and relevant. Helps to make any comparisons ion order to make better decisions and strategies. Well matched framework with Google. Result and performance oriented PPT presentation layouts. Can fit into any presentation seamlessly. Allows widescreen view for enhanced vision. Completely amendable by the user by following simple instructions.
-
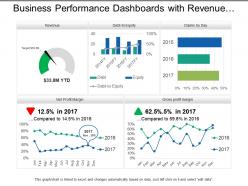 Business performance dashboards with revenue and ratios
Presenting, our business performance dashboards with revenue and ratios PPT deck. Pre-designed chart sheet directed PowerPoint Presentation template. Administration of high-resolution images, graphs, and comparison diagrams. Filled with methods and effects to create an impact. Can be quickly converted into JPEG/JPG or PDF formats as per the requirements. Congenial with Google Slides for ease. Project to widescreen without cringing about pixelating, after downloading explore these characteristics.
-
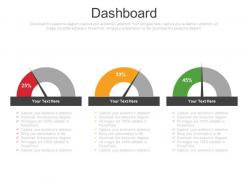 Three dashboard with percentage analysis powerpoint slides
High determination graphics. No issue of picture pixilation when anticipated on wide screen. Impressive arrangement of introduction point and slide content. Compatible with fluctuated number of on the web and disconnected programming alternatives. Modify the PPT symbol, shading, introduction, textual styles, and so on according to individual inclination. Hassle free altering conceivable. Freedom to customize the slide case with organization name and logo. Special rules for executing the progressions are given. Used by a few corporate experts from various areas, instructors and understudies.
-
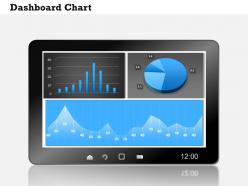 0314 dashboard business information chart
Easy to download and save in the format you like. Replace the content with your business information. Access to use with the Google Slides. Pixel friendly images and graphics in the slide design. Open on a wide screen view without any fear of pixelating. Useful for the business managers, sales professionals and the business learners and geography students.
-
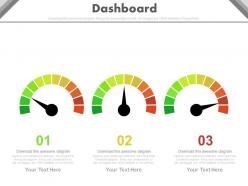 Three Dashboard Snapshot Charts For Business Data Powerpoint Slides
High caliber of pictures and symbols. Strikingly wonderful Presentation slide. Effectively amendable PowerPoint configuration as can be altered easily. Access to exhibit the PPT format in widescreen see. Versatile outlines as good with Google slides. Downloading is simple and can be changed into JPEG and PDF. Ideal for business moderators, administration and the business people.
-
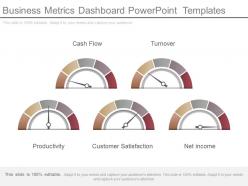 Business metrics dashboard powerpoint templates
Presenting business metrics dashboard PowerPoint templates. Simple to use PowerPoint template layout Demonstrate it with professional details name and image of the establishment. Text, font, colors and orientation can be transformed as per the preference. Familiar with software’s such as JPG and PDF and also with Google slides. Genuine high resolution PPT slide stays even after customization. Easy to download and share at any location. Hundred percent editable Presentation graphic is available with different portray options i.e. standard and widescreen view.
-
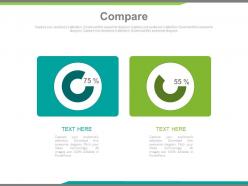 Comparison Charts With Percentage Powerpoint Slides
Presenting, comparison charts with the percentage of PowerPoint slides. Adjust the infographics according to your data. Personalize the percentage value and color schemes. Convenient and fast to download with ease. Adjust the size and orientation of presentation infographics to your liking. Alter the text to suit the context. Include your own logo, company mane, trademark, brand-name etc. No alteration in original high resolution of PPT images after editing. Convert into JPEG/PDF as per requirement.
-
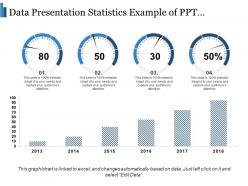 Data presentation statistics example of ppt presentation
Presenting this set of slides with name - Data Presentation Statistics Example Of Ppt Presentation. This is a two stage process. The stages in this process are Data Presentation, Content Presentation, Information Presentation.
-
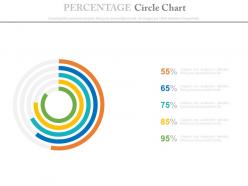 Five stage percentage circle chart powerpoint slides
High resolution PPT example for Technology Vision. Wide screen projection does not affect the output adversely. Easy to edit and customize colorful PPT graphics. Precise and easy to comprehend information on PPT sample. Increase the level of personalization with your company logo and name. Compatible with all software and can be saved in any format. Useful for business analysts, finance experts, accounts specialists, sales team.
-
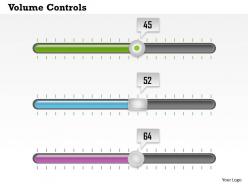 0614 business consulting diagram graphics of volume controls powerpoint slide template
High resolution visuals which do not deter in quality when projected on wide screen. Impressive use of images, text, colors and shapes. Ease of download. Save it in any desired format like JPEG, JPG or PNG. Compatible with Google slides, Windows and Mac. Compatible with numerous software options. Ease of executing changes in this thoroughly editable slide design. Freedom to customize and personalize the presentation with company specific name and logo.
-
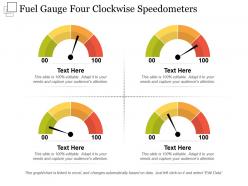 Fuel gauge four clockwise speedometers
Presenting this set of slides with name - Fuel Gauge Four Clockwise Speedometers. This is a four stage process. The stages in this process are Fuel Gauge, Gas Gauge, Fuel Containers.
-
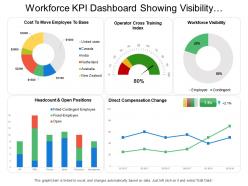 Workforce kpi dashboard showing visibility headcount and direct compensation change
Presenting this set of slides with name - Workforce Kpi Dashboard Showing Visibility Headcount And Direct Compensation Change. This is a five stage process. The stages in this process are Staff, Personnel, Workforce.
-
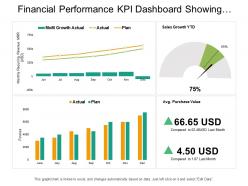 Financial performance kpi dashboard showing sales growth average purchase value
Presenting this set of slides with name - Financial Performance Kpi Dashboard Showing Sales Growth Average Purchase Value. This is a three stage process. The stages in this process are Financial Performance, Financial Report, Financial Review.
-
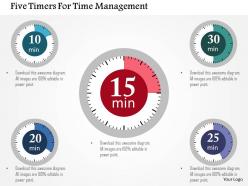 Five timers for time management flat powerpoint design
We are proud to present our five timers for time management flat powerpoint design. Graphic of five timers has been used to craft this power point template diagram. This PPT diagram contains the concept of time management. Use this PPT diagram for management and business related presentation.
-
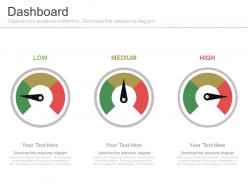 Three dashboard meters with low medium and high mode powerpoint slides
All images are 100% editable in the presentation design. Good quality images can be used to compliment and reinforce message. Works well in Windows 7, 8, 10, XP, Vista and Citrix. Editing in presentation slide show can be done from anywhere by any device. Elegant and beautiful presentation which can be oriented and customized according to requirement.
-
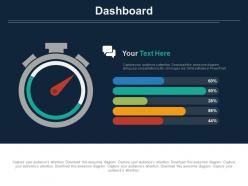 Dashboard chart with percentage analysis powerpoint slides
Scalable representation and the symbols. The symbols adjust well with the Google slides or Microsoft PowerPoint format. Access to alter the symbols, hues or the style of the slides. No bargain with the symbol quality when opened on a wide screen. Edit or utilize your image's name as a watermark. Allowed to spare in the JPG or PDF arrange. Suitable for sales and marketing team, finance industry leaders, business analyst.
-
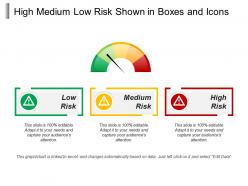 High medium low risk shown in boxes and icons
Presenting this set of slides with name - High Medium Low Risk Shown In Boxes And Icons. This is a three stage process. The stages in this process are High Medium Low, High Moderate Low, Top Medium Low.
-
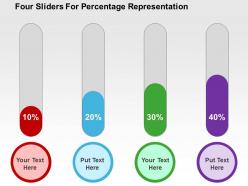 Four sliders for percentage representation flat powerpoint design
We are proud to present our four sliders for percentage representation flat powerpoint design. This power point template diagram has been crafted with graphic of four sliders and percentage. This PPT diagram contains the concept of financial analysis. Use this PPT diagram for business and finance related presentations.
-
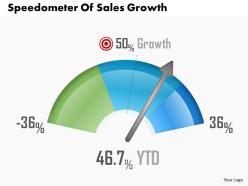 0514 speedometer of sales growth powerpoint presentation
PowerPoint slides are compatible with Google slides. Flexible choices to display Presentation in standard and widescreen view. Option to access similar designs with different nodes and stages. Modifiable PPT template design. Easy to download and insert in the presentation. Simple to convert into JPEG and PDF document. Perfect for sales industry.
-
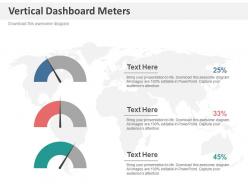 Three vertical dashboard meters for business analysis powerpoint slides
Access to download and save in the JPG or PDF format. Easy to replace the traditional watermark with your brand logo. Convenient to be used on a wide screen view. No effect on the picture quality whatever be the size of your screen. Edit the size, style and orientation of the slide icons. Follow given instruction to modify the slide template. Useful for the Marketing professionals and the business entrepreneurs.
-
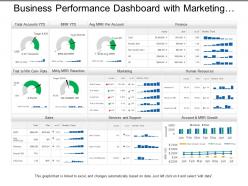 Business performance dashboard with marketing human resource and sales
Presenting, business performance dashboard with marketing human resource and sales PPT deck. This PPT deck focuses on one of the aspects of business marketing with content broadly researched by our business research team. Quickly editable color combinations, layout, text boxes, and font. Alluring graphs for illustration with relatable images to explain the concept. Transform into PDF and JPG format at ease. Predesigned content is adaptable and can be projected to widescreen for business meetings.
-
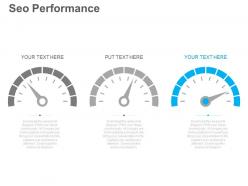 Ppts three meters for seo performance calculation flat powerpoint design
Presenting ppts three meters for seo performance calculation flat powerpoint design. This Power Point template diagram has been crafted with graphic of three meters. This PPT diagram contains the concept of SEO performance calculation. Use this PPT diagram for business and technology related presentations.
-
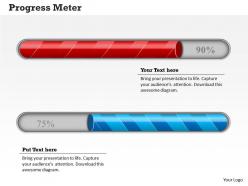 0314 meter design for business progress
A must-have tool for facilitating business and progress related presentations. No scope for pixilation because of high resolution picture graphics. Add text in the form of titles and sub-titles without any space constraint. Customize the layout in terms of its color, design, orientation and font text. Add the logo, name or trademark of the company accordingly. Convertible into PDF or JPEG and is quick to download due to small size. Compatible with Google slides and other softwares.
-
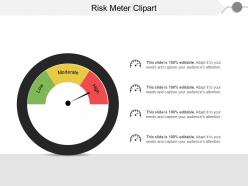 Risk meter clipart
Presenting this set of slides with name - Risk Meter Clipart. This is a four stage process. The stages in this process are Risk Meter, Risk Speedometer, Hazard Meter.
-
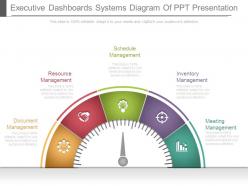 Executive dashboards systems diagram of ppt presentation
Amazing executive dashboards systems diagram PPT Graphic. Multiple options to display in standard or in widescreen view. Text, font, colors and orientation can be easily changes as per your business requirements. Unaffected High resolution PPT slides even after customization. Well compatible with all the software’s and Google slides. Convertible into PDF or JPG formats. Useful for business executives, politicians, corporate leaders, students, professors, etc. Personalize it with company name and logo of your own.The stages in this process are document management and much more.


