- Sub Categories
-
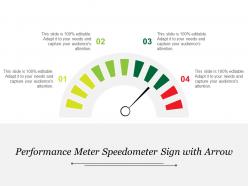 Performance meter speedometer sign with arrow
This highly versatile, innovative design is completely editable; you can modify the design the way you want. Slides are fully compatible with Google Slides and MS PowerPoint software. Instant and quick downloading available; you can save the design into your system into various formats such as JPEG or PDF. Both standard and wide screen view are available; no effect on design quality when opened on wide screen view.
-
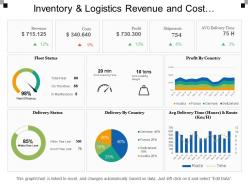 Inventory and logistics revenue and cost dashboards
Presenting this set of slides with name - Inventory And Logistics Revenue And Cost Dashboards. This is a three stage process. The stages in this process are Inventory And Logistics, Inventory Management, Warehousing And Inventory Management.
-
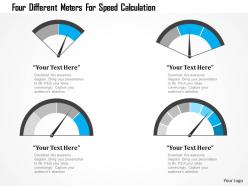 1214 four different meters for speed calculation powerpoint template
Proofing and editing can be done with ease in PPT design. Presentation slide is of utmost use to management professionals, big or small organizations and business startups. Smooth functioning is ensured by the presentation slide show on all software’s. When projected on the wide screen the PPT layout does not sacrifice on pixels or color resolution.
-
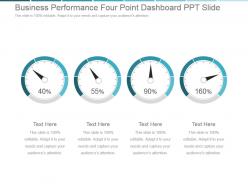 Business performance four point dashboard snapshot ppt slide
Presenting business performance four point dashboard snapshot ppt slide. This is a business performance four point dashboard ppt slide. This is a four stage process. The stages in this process are business, success, dashboard, finance, strategy.
-
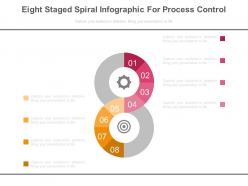 Eight staged spiral infographics for process control powerpoint slides
Compatible with numerous format options like JPEG or PDF. Ease of modifying PowerPoint colors, shades and orientation. Freedom to customize it with company name and logo. Access to inclusion and exclusion of contents as per specific needs of any business. High resolution with splendid picture quality. Zero issue of blur image, when projected on wide screen. Compatible with multiple software options. Valuable for business management team, leaders, administrators and supervisors.
-
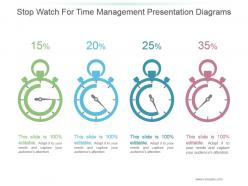 Stop watch for time management presentation diagrams
Presenting stop watch for time management presentation diagrams. This is a stop watch for time management presentation diagrams. This is a four stage process. The stages in this process are business, marketing, stopwatch, management, presentation.
-
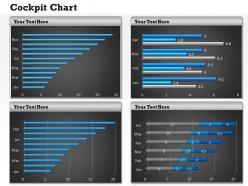 0314 visual design of dashboard
Hugely adapted to all software for smooth running. Simple process to convert to JPG and PDF formats for easy viewing. Quite compatible with Google slides for information access on multiple viewing platforms. Crisp widescreen viewing with no PPT graphics pixilation. Append company logo, name and trademark for specific purposes. Alterable layout including font, text, color and design. High resolution PPT graphics for crispness.
-
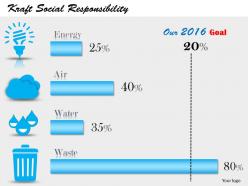 0514 dashboard chart for progress of social effort to stop wastage
Must have presentation for NGO’s trying to save energy and natural resources. High resolution graphics never pixilate and project beautifully on bigger screens. Changeable color, font, text size and orientation gives pin-point control to the user. No space constraints while adding sub-titles or titles. Compatible with Google slides and runs with other softwares. No problem in adding company’s name or logo. Does not occupy much space and easy to download.
-
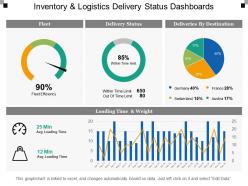 Inventory and logistics delivery status dashboards
Presenting this set of slides with name - Inventory And Logistics Delivery Status Dashboards. This is a four stage process. The stages in this process are Inventory And Logistics, Inventory Management, Warehousing And Inventory Management.
-
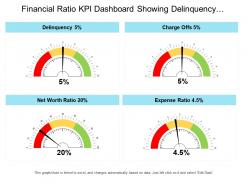 Financial ratio kpi dashboard snapshot showing delinquency charge offs and net worth ratio
Presenting this set of slides with name - Financial Ratio Kpi Dashboard Snapshot Showing Delinquency Charge Offs And Net Worth Ratio. This is a four stage process. The stages in this process are Accounting Ratio, Financial Statement, Financial Ratio.
-
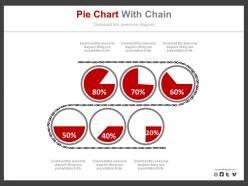 Six pie charts and percentage analysis powerpoint slides
Pixel friendly images and slide icons. 100% customization allowed. Easy to download. Save in the wide variety of formats. Customize the background, style and orientation. Attune well with the Google slides. Useful for the business entrepreneurs, marketing professionals and students.
-
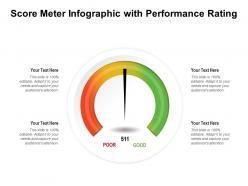 Score meter infographic with performance rating
Presenting Score Meter Infographic With Performance Rating slide. This PPT supports both the standard(4:3) and widescreen(16:9) sizes. This presentation is very easy to download and can be converted into numerous images or document formats including JPEG, PNG, or PDF. It is also compatible with Google Slides and editable in PowerPoint. Alter the style, size, color, background, and other attributes according to your requirements. Moreover, high-quality images prevent the lowering of quality.
-
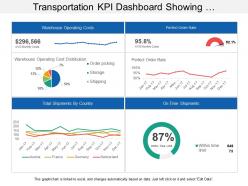 Transportation kpi dashboard showing warehouse operating costs perfect order rate
Presenting transportation KPI dashboard showing warehouse operating costs perfect order rate PPT slide. This layout is fully compatible with Google slides and data driven. User can edit the data in linked excel sheet and graphs and charts gets customized accordingly. Easy to put in company logo, trademark or name; accommodate words to support the key points. Images do no distort out even when they are projected on large screen. Adjust colors, text and fonts as per your business requirements.
-
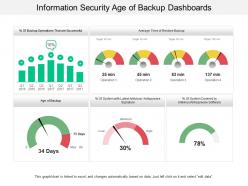 Information security age of backup dashboards
Presenting this set of slides with name - Information Security Age Of Backup Dashboards. This is a five stage process. The stages in this process are Information Security Strategy, Information Security Plan, Information Protection Strategy.
-
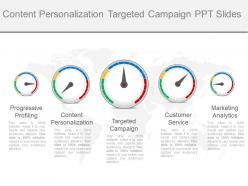 Content personalization targeted campaign ppt slides
Presenting content personalization targeted campaign ppt slides. Presenting content personalization targeted campaign ppt slides. This is a content personalization targeted campaign ppt slides. This is a five stage process. The stages in this process are progressive profiling, content personalization, targeted campaign, customer service, marketing analytics.
-
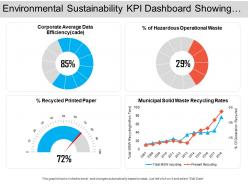 Environmental sustainability kpi dashboard showing corporate average data efficiency
Presenting this set of slides with name - Environmental Sustainability Kpi Dashboard Showing Corporate Average Data Efficiency. This is a four stage process. The stages in this process are Environment Sustainability, Environment Continual, Environment Feasibility.
-
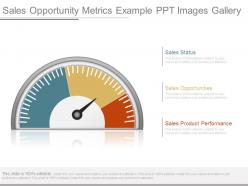 Sales opportunity metrics example ppt images gallery
Presenting sales opportunity metrics example ppt images gallery. This is a sales opportunity metrics example ppt images gallery. This is a three stage process. The stages in this process are sales status, sales opportunities, sales product performance.
-
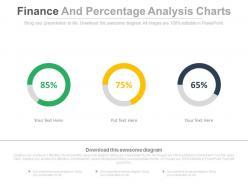 Three finance and percentage analysis charts powerpoint slides
Quick and simple download. Add text to suit the context of your presentation. Absolutely editable contrast and color scheme to suit your need. No change in resolution of PPT images after editing. Fully editable icons and PPT infographics- change size and orientation as required. Insert your own company logo, tagline, trademark, watermark etc.
-
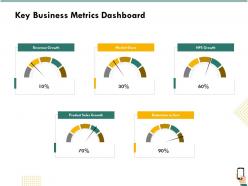 Key business metrics dashboard snapshot growth ppt powerpoint gallery slides
Presenting this set of slides with name Key Business Metrics Dashboard Snapshot Growth Ppt Powerpoint Gallery Slides. This is a five stage process. The stages in this process are Revenue Growth, Market Share, NPS Growth, Product Sales Growth, Reduction In Cost. This is a completely editable PowerPoint presentation and is available for immediate download. Download now and impress your audience.
-
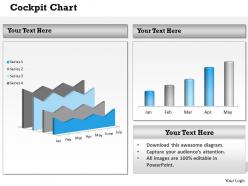 0314 business dashboard design chart
Possess the ability to get as deeper in information as required by simply choosing the desired variables. Helps in analysing the information to enhance the business performance. Can be converted to PDG and JPG formats. Allows orientation and ungrouping the objects. High quality and professional looking PPT Presentation diagrams.
-
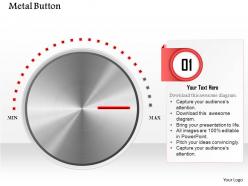 0614 business consulting diagram metal button at max level powerpoint slide template
We are proud to present our 0614 business consulting diagram metal button at max level powerpoint slide template. This graphics is of superlative quality that makes an attractive presentation. This diagram provides a simple means of creating a visual representation for the user to illustrate flow of Information. Deliver amazing presentations to mesmerize your audience.
-
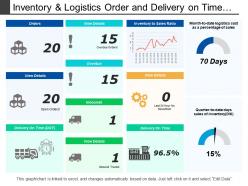 Inventory and logistics order and delivery on time dashboards
Presenting this set of slides with name - Inventory And Logistics Order And Delivery On Time Dashboards. This is a four stage process. The stages in this process are Inventory And Logistics, Inventory Management, Warehousing And Inventory Management.
-
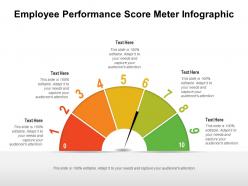 Employee performance score meter infographic
Presenting our Employee Performance Score Meter Infographic. This PPT theme is available in both 4:3 and 16:9 aspect ratios. Choose this PPT graphic to display apt and suitable comparative graphs, charts, and images. This PPT layout is 100% adaptable allowing you to modify the font, color, font size, and shapes. This PPT presentation is also Google Slides compatible making it easily accessible. Without further ado, click the download button!
-
 0614 business consulting diagram volume up down buttons powerpoint slide template
We are proud to present our 0614 business consulting diagram volume up down buttons powerpoint slide template. This Diagram is best suited to streamline the processes for your audience to follow in order to interconnect with each other. Step by step develop the entire picture and project it onto their minds.
-
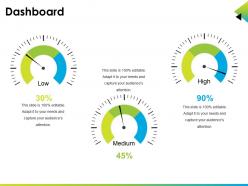 Dashboard Snapshot ppt infographic template
Presenting dashboard ppt infographic template. This is a dashboard snapshot ppt infographic template. This is a three stage process. The stages in this process are dashboard, low, high, medium.
-
 Barometer three colour indicator icon
Presenting barometer three colour indicator icon. This is a barometer three colour indicator icon. This is a three stage process. The stages in this process are barometer, weather instrument, ?pressure gauge.
-
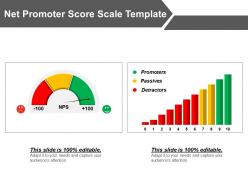 Net promoter score scale template powerpoint graphics
Presenting net promoter score scale PPT template. This Presentation graphic is eloquent and beneficial for the students, researchers, specialists from various fields. The composition features of this PowerPoint image allow you to modify the appearance and layout. This PPT design has enough scope to insert the title or subtitles respectively. The impeccable Presentation design is well acquainted with all Google Slides. They also provide an option to add your business logo too.
-
 Shipping KPI Icon For Tracking Order Delivery Delays
Introducing our premium set of slides with Shipping KPI Icon For Tracking Order Delivery Delays. Elucidate the three stages and present information using this PPT slide. This is a completely adaptable PowerPoint template design that can be used to interpret topics like Shipping KPI, Icon, Tracking, Order Delivery Delays. So download instantly and tailor it with your information.
-
 Three dashboard Snapshot for data valuation powerpoint slides
High resolution PPT visuals do not pixel ate even after customization. All the PPT icons, text, background and diagrams can be edited to match your need. It can further be saved in any format of your choice (JPG/JPEG/PDF). Harmonious with varied set of software options available online and offline. Guidance for editing of the PPT diagram is provided for assistance. It’s a useful PowerPoint slide design for business owners, operations mangers, marketing executive, professors and students.
-
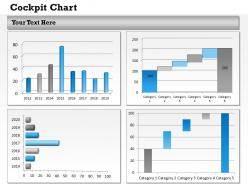 0314 design of business dashboard
Flexible presentation design with amazing picture quality. Excel linked design so you can make changes in the excel sheet and the design will change accordingly. Variation is possible with color, text, font and shape. Prompt download and can be changed in JPEG and PDF format. Gives a specialized effect to your Presentation template. Alternate to customize the design by adding business badge, icon and symbol. PowerPoint slide exhibited in standard and widescreen view.
-
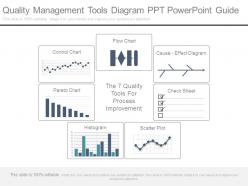 Quality management tools diagram ppt powerpoint guide
Presenting quality management tools diagram ppt powerpoint guide. This is a quality management tools diagram ppt powerpoint guide. This is a seven stage process. The stages in this process are flow chart, cause effect diagram, check sheet, the 7 quality tools for process improvement, scatter plot, histogram, control chart, pareto chart.
-
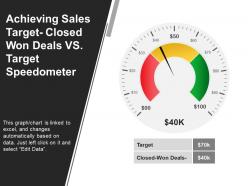 Achieving sales target closed won deals vs target speedometer ppt design
This sales target achievement presentation PPT template can be downloaded and converted into JPEG and PDF formats. You can change font type, size, color, shape, style, background according to your business preferences. Design allows full editing. PPT is fully compatible with Google Slides and MS PowerPoint software. Both normal and full screen design views are available. No change in the design quality even when viewed in full screen.
-
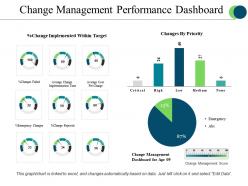 Change management performance dashboard powerpoint slide designs
Presenting change management performance dashboard powerpoint slide designs. This is a change management performance dashboard powerpoint slide designs. This is a three stage process. The stages in this process are critical, high, low, medium, none.
-
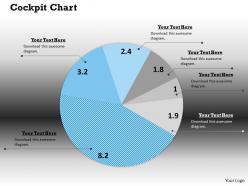 0314 interactiive chart dashboard snapshot design
Useful for professionals working in data analytics firm and for preparing business presentations. Download is quick because of the small size and the layout is compatible with Google slides. No issues in adding company logo, name or trademark. No space constraints for adding titles and sub-titles. Runs smoothly with softwares and can be converted into JPEG and PDF. Total customization in terms of font of the text, color and design. No pixilation because of high resolution graphics.
-
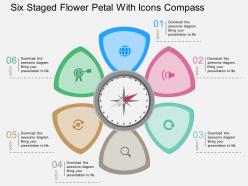 Six staged flower petal with icons compass flat powerpoint design
We are proud to present our six staged flower petal with icons compass flat powerpoint design. Six staged flower petal with icons has been used to craft this power point diagram. This PPT diagram contains the concept of process flow. Use this PPT diagram for business and marketing related presentations.
-
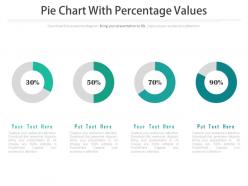 Four pie charts with percentage values powerpoint slides
Presenting four pie charts with percentage values powerpoint slides. This Power Point template slide has been crafted with graphic of four pie charts and percentage values. This PPT slide contains the concept of result analysis based on data. Use this PPT slide for business and finance related presentations.
-
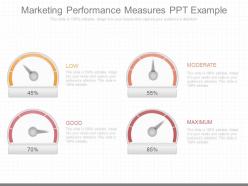 View marketing performance measures ppt example
Presenting view marketing performance measures ppt example. This is a marketing performance measures ppt example. This is a four stage process. The stages in this process are low, moderate, good, maximum.
-
 Financial metrics and kpi diagram presentation visual aids
Presenting financial metrics and kpi diagram presentation visual aids. This is a financial metrics and kpi diagram presentation visual aids. This is a three stage process. The stages in this process are operating profit last 12 months, total income act vs forecast between 2009 and 2010, income by qtr by tr between 2007 and 2010.
-
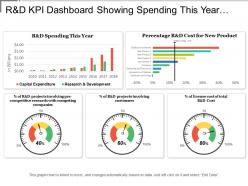 R and d kpi dashboard showing spending this year and cost for new product
Presenting this set of slides with name - R And D Kpi Dashboard Showing Spending This Year And Cost For New Product. This is a five stage process. The stages in this process are R And D, Research And Development, Research And Technological Development.
-
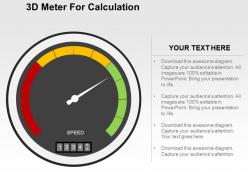 3d meter for calculation flat powerpoint design
We are proud to present our 3d meter for calculation flat powerpoint design. This power point template diagram has been crafted with graphic of 3d meter. This PPT diagram contains the concept of calculation. Use this PPT diagram for business and technology related presentations.
-
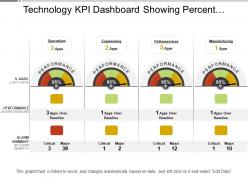 Technology kpi dashboard showing percent availability and performance
Displaying Technology KPI dashboard percent availability PowerPoint design. Colors and text can be easily changed as the PPT slide is completely editable. Modify the design with brand name and logo. Presentation diagram is available both Standard and Widescreen slide. Fast and easy download with saving options. Adaptable with other software’s such as PDF or JPG formats. PowerPoint graphic is fully compatible with Google slides as can be merged with them accordingly.
-
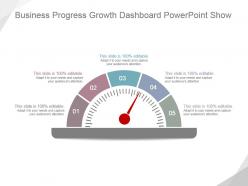 Business progress growth dashboard powerpoint show
Presenting business progress growth dashboard powerpoint show. This is a business progress growth dashboard powerpoint show. This is a five stage process. The stages in this process are business, marketing, dashboard, measure, management.
-
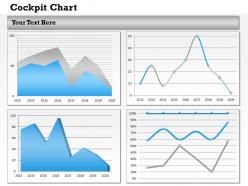 0314 business reports and dashboards
High resolution PPT slides providing to all the needs related to achieving quick goals. We have prepared PowerPoint info graphics of smart goals. Related content with flexible data. Can be easily transformed to PDF and JPF format. Useful for students, researchers, business professional and corporative people. Excellent graphs for comparison and fascinating figures to illustrate the concept. Adjustable background with colour, layout, and font.
-
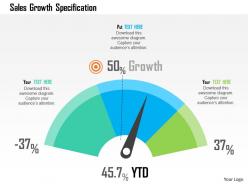 Sales growth specification flat powerpoint design
No effect on picture quality when operated on a wide screen. Complete access to edit the content, size, style and orientation of the slide icons. Provided information to make the changes or edit the slide design. Replace the watermark in the background with you company’s name. Beneficial for the marketing Individuals and the sale observers.
-
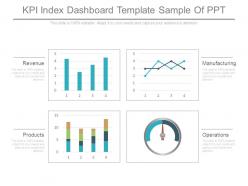 Kpi index dashboard template sample of ppt
Presenting kpi index dashboard template sample of ppt. This is a kpi index dashboard template sample of ppt. This is a four stage process. The stages in this process are revenue, manufacturing, products, operations.
-
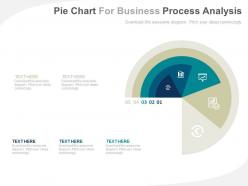 Pie chart for business process analysis powerpoint slides
PowerPoint slide templates assist business owners, managers and employees responsible for smooth management of organisation. View slides in widescreen and display them on any screen platform. Effortlessly convert slides into JPG and PDF with minimum effort. Templates compatible with Google Slides. Easily adjust icons according to your liking. Change colors and size of the icons. Add texts for summary.
-
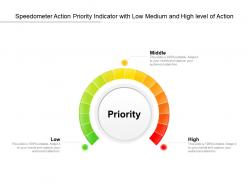 Speedometer action priority indicator with low medium and high level of action
Presenting this set of slides with name Speedometer Action Priority Indicator With Low Medium And High Level Of Action. This is a one stage process. The stages in this process are Action Priority, Pyramid, Level Of Actions. This is a completely editable PowerPoint presentation and is available for immediate download. Download now and impress your audience.
-
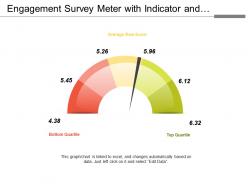 Engagement survey meter with indicator and score
Presenting this set of slides with name - Engagement Survey Meter With Indicator And Score. This is a five stage process. The stages in this process are Engagement Survey, Engagement Observation, Engagement View.
-
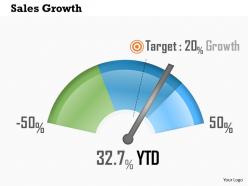 0614 sales growth powerpoint presentation slide template
100 percent editable thank you slide example. Modify the content as per individual need and preference. Add or exclude the elements as per choice. Include the company name, logo or trademark for that extra personalization. Compatible with numerous format options. Harmonious with varied software available online and offline. Visually impressive and information rich. Applied by several marketers, corporate professionals and scholars at the end of their presentation.
-
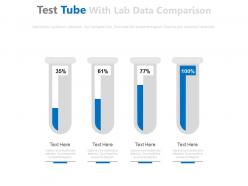 Four test tubes with lab data comparison powerpoint slides
Presenting four test tubes with lab data comparison powerpoint slides. This Power Point template diagram slide has been crafted with graphic of four test tubes and lab data. This PPT diagram contains the concept of data comparison representation. Use this PPT diagram for business and technology related presentations.
-
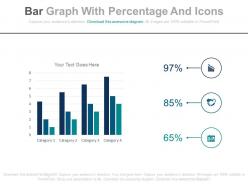 Bar graph with percentage and icons powerpoint slides
Completely compatible PPT slides with Google slides. Choice to display presentation templates in standard and widescreen view. Fully editable PowerPoint slideshow. Instant download and share when required. Simple to convert into JPEG and PDF document. Useful for Finance professionals, students, professors, accountants.
-
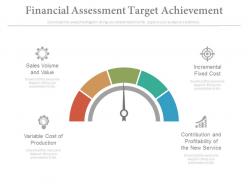 Financial assessment target achievement ppt slides
Presenting financial assessment target achievement ppt slides. This is a financial assessment target achievement ppt slides. This is a one stage process. The stages in this process are finance, business, marketing, strategy.
-
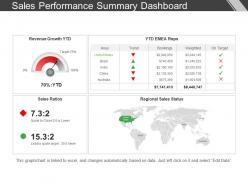 Sales performance summary dashboard snapshot presentation outline
Presenting sales performance summary dashboard snapshot presentation outline PPT slide. High-resolution slide design visuals. No fear of image pixelation when projected on a wide screen. It has compatibility with numerous software options available both online and offline. It is compatible with numerous format options. Ease of customization and personalization. Ease of editing in color and orientation of the slide visual. There is freedom to add the company logo, name and trademark as part of personalization. Thoroughly used by business professionals, students and teachers as part of their presentation.
-
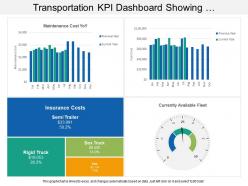 Transportation kpi dashboard showing maintenance cost insurance cost available fleet
Presenting transportation KPI dashboard showing maintenance cost insurance cost available fleet PowerPoint slide. Simple data input with linked Excel chart, just right click to input values. This PowerPoint theme is fully supported by Google slides. Picture quality of these slides does not change even when project on large screen. Fast downloading speed and formats can be easily changed to JPEG and PDF applications. This template is suitable for marketing, sales persons, business managers and entrepreneurs. Adjust PPT layout, font, text and color as per your necessity.
-
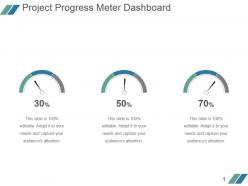 Project progress meter dashboard powerpoint slide designs download
Presenting project progress meter dashboard powerpoint slide designs download. This is a project progress meter dashboard powerpoint slide designs download. This is a three stage process. The stages in this process are business, marketing, dashboard, percentage.
-
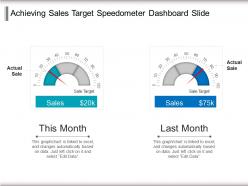 Achieving sales target speedometer dashboard slide ppt inspiration
Presenting achieving sales target speedometer dashboard slide PPT inspiration presentation template. The dashboard slide is compatible with Google Slides. A user may add his organization's logo and alter template according to his organization’s brand. Since the template is 100% editable in PowerPoint and all the graphics which include background, themes, font size, font type, aspect ratios, and shapes are fully customizable. Template's quality remains the same, even after doing changes in it. The excel linked template is also compatible with other formats such as JPEG and PDF.
-
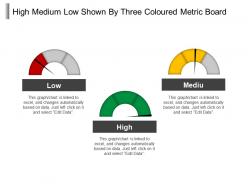 High medium low shown by three coloured metric board
Presenting this set of slides with name - High Medium Low Shown By Three Coloured Metric Board. This is a three stage process. The stages in this process are High Medium Low, High Moderate Low, Top Medium Low.
-
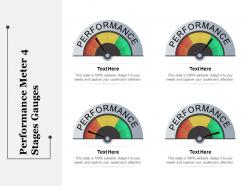 Performance meter 4 stages gauges
Get a chance to explore, the performance meter PowerPoint Presentation Slide. This Presentation has been designed by professionals and is fully editable. You can reshape the font size, font type, colors, and even the background. This Template is attainable with Google Slide and can be saved in JPG or PDF format without any nuisance created. Fast download at the click of the button.
-
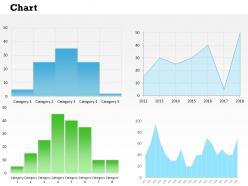 0314 multiple charts business dashboard
Useful tool for business presentations and professionals working as supervisors. High definition of the picture graphics implies no pixilation when projected on different screens. Provision to add text in the form of titles and sub-titles. No space constraints for adding the name, logo or trademark of the company. Runs smoothly with softwares and compatible with Google slides. Amendable layout in terms of text, design, color and orientation.
-
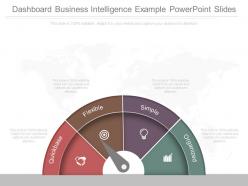 Dashboard business intelligence example powerpoint slides
Presenting dashboard business intelligence example powerpoint slides. This is a dashboard business intelligence example powerpoint slides. This is a four stage process. The stages in this process are quickbase, flexible, simple, organized.


