- Sub Categories
-
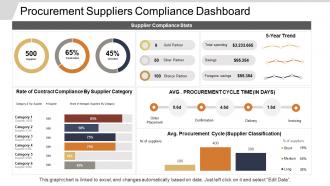 Procurement suppliers compliance dashboard
Presenting this set of slides with name - Procurement Suppliers Compliance Dashboard. This is a four stage process. The stages in this process are Purchase, Procurement, Buy.
-
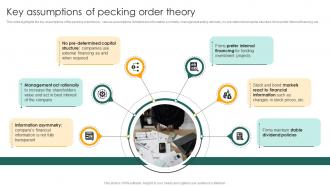 Key Assumptions Of Pecking Order Theory Capital Structure Approaches For Financial Fin SS
This slide highlights the key assumptions of the pecking order theory. Various assumptions included are information symmetry, management acting rationally, no pre-determined capital structure, firms prefer internal financing, etc. Introducing Key Assumptions Of Pecking Order Theory Capital Structure Approaches For Financial Fin SS to increase your presentation threshold. Encompassed with six stages, this template is a great option to educate and entice your audience. Dispence information on Prefer Internal Financing, Markets React To Financial, Stable Dividend Policies, Management Act Rationally, using this template. Grab it now to reap its full benefits.
-
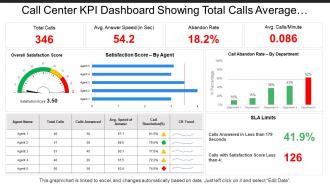 Call center kpi dashboard showing total calls average answer speed abandon rate
Presenting this set of slides with name - Call Center Kpi Dashboard Showing Total Calls Average Answer Speed Abandon Rate. This is a five stage process. The stages in this process are Call Center Agent, Customer Care, Client Support.
-
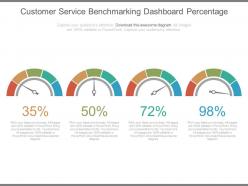 Customer service benchmarking dashboard snapshot percentage ppt slides
This PPT slide can be used by anyone looking to project their Customer Service Bench marking related ideas. This PowerPoint template is 100% editable, which means text, color, and shapes of the given elements can be altered according to your liking. These slides are also compatible with Google slides. You can edit the text section to write a short brief about the process.The stages in this process are finance, marketing, strategy, business.
-
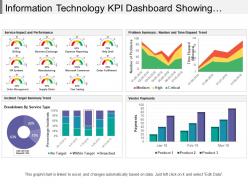 Information technology kpi dashboard showing incident target summary trend
Presenting this set of slides with name - Information Technology Kpi Dashboard Showing Incident Target Summary Trend. This is a five stage process. The stages in this process are Information Technology, It, Iot.
-
 Project name cost baseline portfolio dashboards
Presenting project name cost baseline portfolio dashboards PPT template. Download is quick and can be easily shared. Conveys a sense of change over time. Suitable for corporate leaders and business associates. Flexible PPT slide as can be used whenever required. PowerPoint design can be shared in Standard and Widescreen view. High quality graphics and visuals used in the PPT. Option to include business content i.e. name, logo and text. Effortless conversion into PDF/ JPG format. Can be easily merged with your ongoing presentation slides.
-
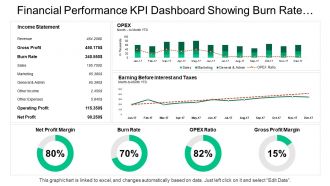 Financial performance kpi dashboard showing burn rate opex ratio gross profit
Presenting this set of slides with name - Financial Performance Kpi Dashboard Showing Burn Rate Opex Ratio Gross Profit. This is a four stage process. The stages in this process are Financial Performance, Financial Report, Financial Review.
-
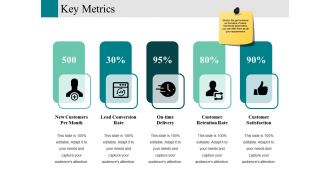 Key metrics ppt design
Presenting this set of slides with name - Key Metrics Ppt Design. This is a five stage process. The stages in this process are New Customers Per Month, Lead Conversion Rate, On Time Delivery, Customer Retention Rate, Customer Satisfaction.
-
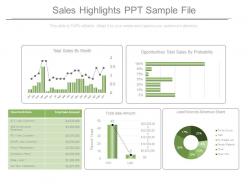 Sales highlights ppt sample file
Presenting sales highlights ppt sample file. This is a sales highlights ppt sample file. This is a five stage process. The stages in this process are total sales by month, opportunities total sales by probability, opportunity name amount, total sale amount, lead sources revenue share.
-
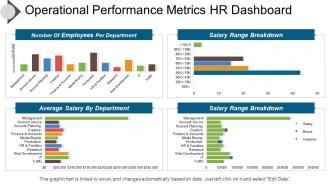 Operational performance metrics hr dashboard snapshot presentation images
Introducing operational performance metric HR PPT image. Fully regulated PowerPoint template quite reasonable for the HR and management professionals and business specialists. Extensive scope for reviving the dummy data and can add company logo, trademark etc. Reconvert able background PPT image, subject matter, designs, context etc. according to need. Versant with all Google Slides and other system applications. Can be easily projected over wide screen with exceptional picture quality.
-
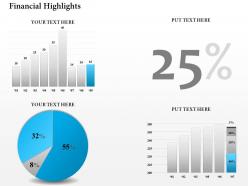 0314 comparison of financial data
Alter the PPT diagram by addition of business label. Swift download and easy to alter into JPEG and PDF document. PowerPoint diagram well-attuned with Google slides. Greater quality presentation design. Specific and easy to apprehend information. Choice to present design in standard and widescreen display view. Presentation slide can be accessed with different nodes and stages. Suitable for finance data management experts, financial reporting team, data analyst etc.
-
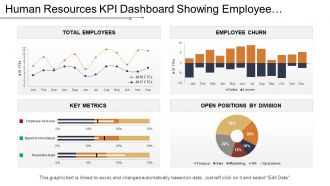 Kpi dashboard showing employee churn key metrics and open positions
Presenting this set of slides with name - Kpi Dashboard Showing Employee Churn Key Metrics And Open Positions. This is a four stage process. The stages in this process are Human Resource, Hrm, Human Capital.
-
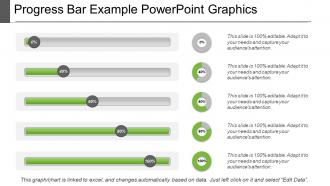 Progress bar example powerpoint graphics
We brings to you the progress bar example PowerPoint graphics. You can download this PPT completely free of cost. You just have to edit the data in a pre-designed format and present it. You can insert pictures and new slides to this ready-made deck of slides. All these slides are fully compatible with Google Slides. This presentation can be downloaded in JPG and PDF formats. It can be viewed in the 16:9 ratio widescreen size and the ratio of 4:3 standard screen size.
-
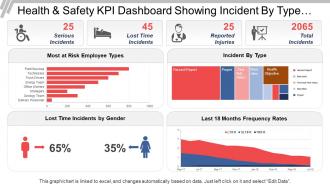 Health and safety kpi dashboard showing incident by type and frequency rates
Presenting the dashboard presentation slide. This KPI dashboard is fully editable and is designed by professionals looking for professional presentation design. You can edit the objects in the slide like font size and font color easily. This presentation slide is fully compatible with Google Slide and can be saved in JPG or PDF file format without any hassle. Click on the download button below.
-
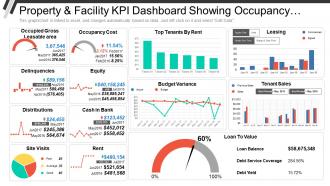 Property and facility kpi dashboard showing occupancy cost delinquencies and distributions
Presenting Property And Facility KPI Dashboard Showing Occupancy Cost Delinquencies And Distributions PPT slide. The Property And Facility KPI Dashboard PPT slide designed professionally by the team of SlideTeam to present the different parameters. These parameters have illustrated by different charts such as bar, line and pie chart, along with that the text in the KPI metric dashboard slide is customizable in PowerPoint. The logistics KPI dashboard template is compatible with Google Slide. A user can do alteration in the font size, font type, color and dimensions of the different figures as per the requirement.
-
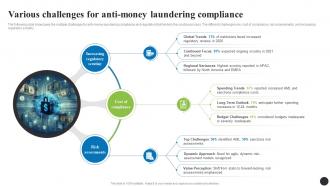 Various Challenges For Anti Money Navigating The Anti Money Laundering Fin SS
The following slide showcases the multiple challenges for anti-money laundering compliance and regulation that hinders the scrutiny process. The different challenges are cost of compliance, risk assessments, and increasing regulatory scrutiny. Increase audience engagement and knowledge by dispensing information using Various Challenges For Anti Money Navigating The Anti Money Laundering Fin SS. This template helps you present information on three stages. You can also present information on Cost Of Compliance, Risk Assessments, Increasing Regulatory Scrutiny using this PPT design. This layout is completely editable so personaize it now to meet your audiences expectations.
-
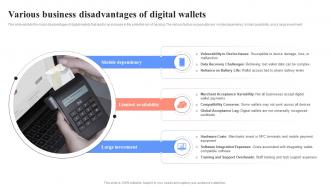 Various Business Disadvantages Of Unlocking Digital Wallets All You Need Fin SS
This slide exhibits the major disadvantages of digital wallets that lead to an increase in the potential risk of hacking. The various factors responsible are mobile dependency, limited availability, and a large investment. Introducing Various Business Disadvantages Of Unlocking Digital Wallets All You Need Fin SS to increase your presentation threshold. Encompassed with three stages, this template is a great option to educate and entice your audience. Dispence information on Mobile Dependency, Limited Availability, Large Investment, using this template. Grab it now to reap its full benefits.
-
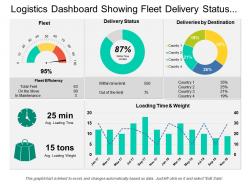 Logistics dashboard showing fleet delivery status and delivery by destination
Presenting this set of slides with name - Logistics Dashboard Showing Fleet Delivery Status And Delivery By Destination. This is a three stage process. The stages in this process are Logistics Dashboard, Logistics Kpis, Logistics Performance.
-
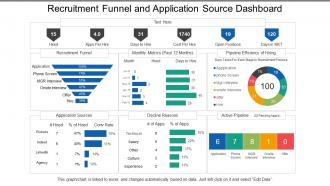 Recruitment funnel and application source dashboard
Presenting this set of slides with name - Recruitment Funnel And Application Source Dashboard. This is a three stage process. The stages in this process are Staffing Plan, Recruitment, Staff Management.
-
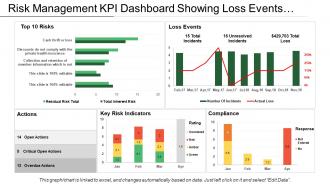 Risk management kpi dashboard showing loss events actions and compliance
Presenting this set of slides with name - Risk Management Kpi Dashboard Showing Loss Events Actions And Compliance. This is a four stage process. The stages in this process are Risk Management, Risk Assessment, Project Risk.
-
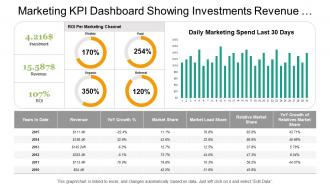 Marketing kpi dashboard showing investments revenue metrics details
Presenting marketing kpi dashboard showing investments revenue metrics details presentation template slide. The PPT template is very user friendly as it allows you to make numerous changes to the editable slides. You can amend the font size, font style and also the font color as per your requirements. Template slide can be downloaded quickly and cab be saved in format of PDF or JPG easily. The template slide after being downloaded can be viewed in large screen display ratio of 16:9 or standard size display ratio of 4:3.
-
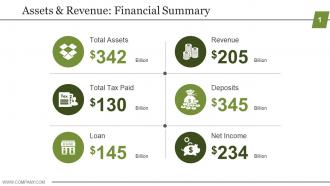 Assets and revenue financial summary powerpoint graphics
Presenting assets and revenue financial summary powerpoint graphics. This is a assets and revenue financial summary powerpoint graphics. This is a six stage process. The stages in this process aretotal assets, total tax paid, loan, revenue, deposits, net income.
-
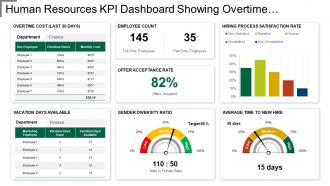 Kpi dashboard showing overtime cost gender diversity ratio
Presenting this set of slides with name - Kpi Dashboard Showing Overtime Cost Gender Diversity Ratio. This is a six stage process. The stages in this process are Human Resource, Hrm, Human Capital.
-
 Project name status schedule and management dashboard
Presenting project name status schedule and management dashboard PowerPoint template. Presentation slides are compatible with Google slides. Download is quick and can be easily shared. Conveys a sense of change over time. Suitable for corporate leaders and business associates. Flexible PPT slide as can be used whenever required. PowerPoint design can be shared in Standard and Widescreen view. High quality graphics and visuals used in the PPT. Option to include business content i.e. name, logo and text. Effortless conversion into PDF/ JPG format.
-
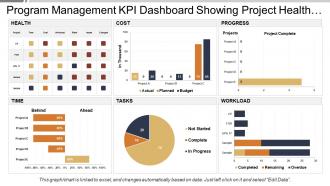 Program management kpi dashboard showing project health and progress
Presenting this set of slides with name - Program Management Kpi Dashboard Showing Project Health And Progress. This is a six stage process. The stages in this process are Program Development, Human Resource Management, Program Management.
-
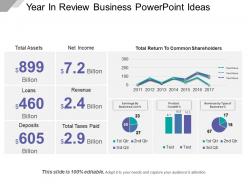 Year in review business powerpoint ideas
Presenting Year In Review Business PowerPoint Ideas. Get this Excel linked PPT slide and deliver quality presentations to your audience. You are free to make changes in any part of the slide. Modify the colors as per your choice, change the font type and font size and save this in JPG and PDF formats. This is entirely compatible with Google Slides and can be viewed on the standard screen and widescreen.
-
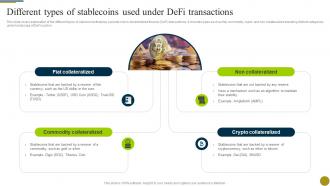 Different Types Of Stablecoins Used Under Defi Transactions Understanding Role Of Decentralized BCT SS
This slide covers exploration of the different types of stablecoins that play a pivotal role in decentralized finance DeFi transactions. It includes types such as fiat, commodity, crypto and non collateralized elevating distinct categories under landscape of DeFi system. Increase audience engagement and knowledge by dispensing information using Different Types Of Stablecoins Used Under Defi Transactions Understanding Role Of Decentralized BCT SS This template helps you present information on four stages. You can also present information on Fiat Collateralized, Commodity Collateralized, Crypto Collateralized using this PPT design. This layout is completely editable so personaize it now to meet your audiences expectations.
-
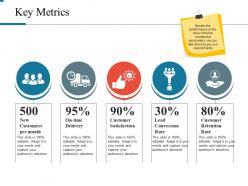 Key metrics powerpoint slide background designs
Presenting key metrics powerpoint slide background designs. This is a key metrics powerpoint slide background designs. This is a five stage process. The stages in this process are new customers per month, on time delivery, customer satisfaction, lead conversion rate, customer retention rate.
-
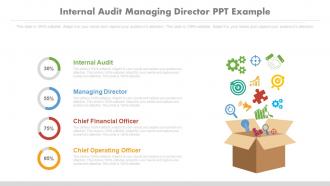 Internal audit managing director ppt example
Pixel friendly images and icons. Use the variety of icons available to download and replace. Edit the background with the company name or brand logo. Follow guidelines to make modifications in the template. Easy to download and save in various formats. Used by the business leaders, professional analysts and the student learning business.The stages in this process are marketing, finance, business.
-
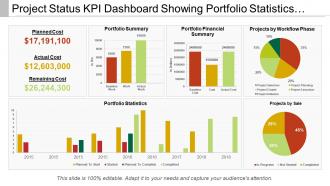 Project status kpi dashboard showing portfolio statistics and workflow phase
Presenting Project Status Kpi Dashboard Showing Portfolio Statistics And Workflow Phase PPT template. All around planned layout slide. This template slide is completely perfect with Google. Tend to upgrade the general effect of your introduction. Introduced to be spared in JPEG, JPG or PDF arrange whenever required. Space accessible to include your organization data as and when required. The format slide is famous and popular because of its simple utilize and openness. Basic and accommodating downloading by following clear advances. This slide keeps up the demonstrable skill of the introduction.
-
 403 B Savings Plan For Retirement Strategic Retirement Planning To Build Secure Future Fin SS
This slide shows information which can be used by individuals to get basic understanding about 403 b retirement savings plan. It includes elements such as types, contributions and contributions limit. Introducing 403 B Savings Plan For Retirement Strategic Retirement Planning To Build Secure Future Fin SS to increase your presentation threshold. Encompassed with two stages, this template is a great option to educate and entice your audience. Dispence information on Traditional, Contributions, Contributions Limit, using this template. Grab it now to reap its full benefits.
-
 Must Have Features Of Good Budgeting Software Budgeting Process For Financial Wellness Fin SS
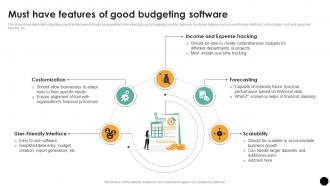
This slide shows information regarding characteristics which should be considered while selecting a good budgeting tools for business. It includes features such as user friendly interface, customization, income and expenses tracking, etc. Increase audience engagement and knowledge by dispensing information using Must Have Features Of Good Budgeting Software Budgeting Process For Financial Wellness Fin SS. This template helps you present information on five stages. You can also present information on Income And Expense Tracking, Customization, User-Friendly Interface using this PPT design. This layout is completely editable so personaize it now to meet your audiences expectations.
-
 Business kpi dashboard showing revenue and customer lifetime value
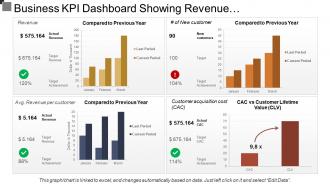
Presenting this set of slides with name - Business Kpi Dashboard Showing Revenue And Customer Lifetime Value. This is a four stage process. The stages in this process are Business Dashboard, Business Kpi, Business Performance.
-
 Project status kpi dashboard showing task summary
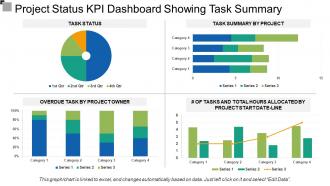
Presentation template is attainable in standard and widescreen view. Presentation slides created with high quality resolution design. Totally variable design as color, text and font can be edited with ease. PPT slide easy to download with different slides. Easy to transmute the presentation slide into JPEG and PDF document. Download is quick. PowerPoint slide helps you to save time and effort. Just enter the business information and share with your shareholders, clients, team etc. Professionally crafted with concept in mind.
-
 Quality dashboard snapshot showing customer product data with data quality
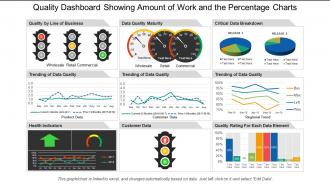
SlideTeam feels immense pleasure in presenting to you its 100% customizable and user-friendly quality dashboard snapshot showing customer data with data quality. The business slides can be viewed in widescreen display ratio of 16:9 or standard size display ratio of 4:3 after being downloaded. The PPT presentation lets you insert or remove any given feature from the redesigned set of slides. You can also save the slideshow in format of PDF or JPG and also it is compatible with Google Slides. So hit download, edit it and present it.
-
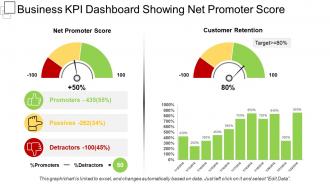 Business kpi dashboard snapshot showing net promoter score
Presenting this set of slides with name - Business Kpi Dashboard Snapshot Showing Net Promoter Score. This is a two stage process. The stages in this process are Business Dashboard, Business Kpi, Business Performance.
-
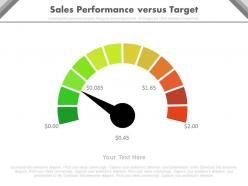 Ppt sales performance versus target indicator dial dashboard powerpoint slides
High resolution Dial Dashboard Diagram doesn’t pixel ate, while being projected on big screen. Easy to embed company logo/ trademark. Well compatible with Google slides. Quick and easy downloading process. Amendable font style, design and the content of the icons or the PPT Slides. Valuable for entrepreneurs, students, researchers and employees.
-
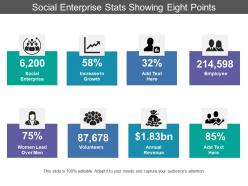 Social enterprise stats showing eight points
Presenting this set of slides with name - Social Enterprise Stats Showing Eight Points. This is a eight stage process. The stages in this process are Stats, Statistics, Data.
-
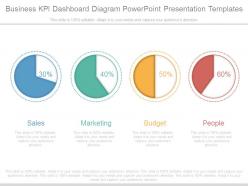 Business kpi dashboard diagram powerpoint presentation templates
PPT icon is easy for proofing and editing. Presentation layout is a good blend of text and flash animation. Presentation slide supports new shape styles to keep away cliché appearance and helps capture the attention. PPT slide is compatible with Google slide. Beneficial for marketing, sales, business and financial sector growth. Offers high color resolution. The stages in this process are sales, marketing, budget, people.
-
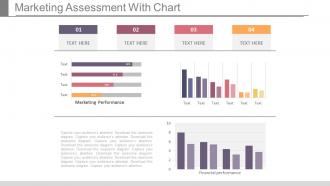 Marketing assessment with chart ppt slides
The PowerPoint presentation ensures proofing and editing with ease. Presentation slide is of utmost use to sales, marketing and business entrepreneurs, for financing and accounting purpose. Text and graphic can be put on show in the same PPT slide. PPT diagram supports recasting the color, size and orientation according to the requirement. High resolution in color and art shape is offered by PPT slide.The stages in this process are finance, business, marketing, strategy.
-
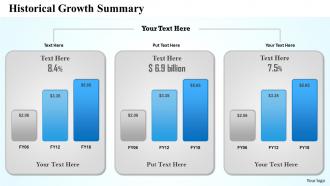 0314 summary of financial growth
Convertible into numerous format options like JPEG, JPG or PDF. Provides a professional outlook to your PowerPoint presentation. Icons can also be added. Customization of each PowerPoint graphic and text according to your desire and want. Multiple display option such as standard and widescreen view. Freedom to customize it with company name and logo. Beneficial for business professionals, students, teachers, business analysts and strategists. Compatible with Google slides as well. Modifiable PPT slide with financial charts and graphs.
-
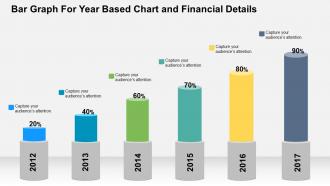 Bar graph for year based chart and financial details flat powerpoint design
Visually drawing PowerPoint presentation diagrams. Loaded with incomparable benefits. Can be utilized for displaying both simple and complex information. Instant download to save your time and effort. Runs effortlessly with all the software’s. Can be personalized by adding company trademark, logo, brand and symbols. Well-arranged patterns to avoid any confusion or doubt.
-
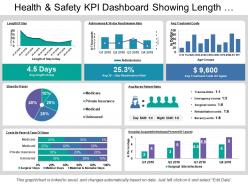 Health and safety kpi dashboard showing length of stay and treatment costs
Presenting this set of slides with name - Health And Safety Kpi Dashboard Showing Length Of Stay And Treatment Costs. This is a seven stage process. The stages in this process are Health And Safety, Health And Security, Health And Protection.
-
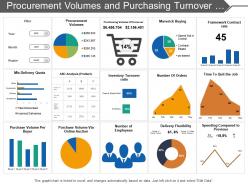 Procurement volumes and purchasing turnover dashboard
Presenting this set of slides with name - Procurement Volumes And Purchasing Turnover Dashboard. This is a four stage process. The stages in this process are Purchase, Procurement, Buy.
-
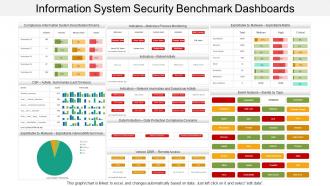 Information system security benchmark dashboards
Presenting this set of slides with name - Information System Security Benchmark Dashboards. This is a three stage process. The stages in this process are Information Security Strategy, Information Security Plan, Information Protection Strategy.
-
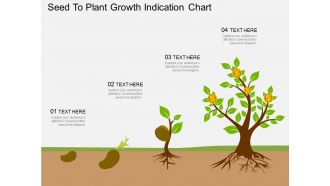 Oy seed to plant growth indication chart flat powerpoint design
Successfully passed the authenticity examination. Aims to provide an outstanding and extraordinary presentation experience to the audience as well as the organisation. Visually appealing PPT presentation diagrams. Can be updated at any point of time by any user without even having any specialised knowledge. Supports widescreen view for more clarity and vision.
-
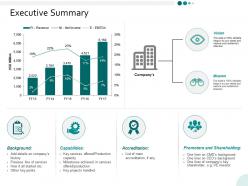 Executive summary ppt powerpoint presentation infographics deck
Presenting this set of slides with name - Executive Summary Ppt Powerpoint Presentation Infographics Deck. This is a six stages process. The stages in this process are Finance, Marketing, Management, Investment, Analysis.
-
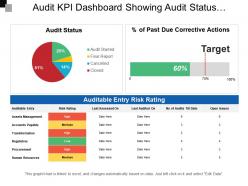 Audit kpi dashboard showing audit status auditable entry risk rating
Presenting this set of slides with name - Audit Kpi Dashboard Showing Audit Status Auditable Entry Risk Rating. This is a four stage process. The stages in this process are Audit, Examine, Survey.
-
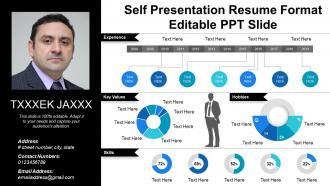 Self presentation resume format editable ppt slide
Presenting self presentation resume format editable PPT slide which is thoroughly editable, data driven i.e. excel linked and fast to download. The presenter can customize and personalize this PPT slide it to meet his / her own specifications. This presentation has been designed by plethora of professional expertise. This PowerPoint shape is fully compatible with Google Slides, multiple software and format options. This slideshow can be saved as JPG and / or in PDF. For your kind assistance, editing instructions are also provided.
-
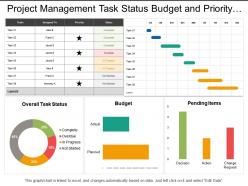 Project management task status budget and priority dashboard
Stunning project management task status budget and priority dashboard PowerPoint template. Choice to display PowerPoint template in standard and widescreen view. Presentation designs are well-suited with Google slides or MS Office PowerPoint programs. Can be transformed into JPG and PDF format. Trouble-free replacement of your company’s logo. Access to open on a big screen display. Perfect for business professionals, managers and industry leaders. Trustworthy and accurate PowerPoint slide show. Customize the fonts, colors, layout, etc.as per your requirements and business needs.
-
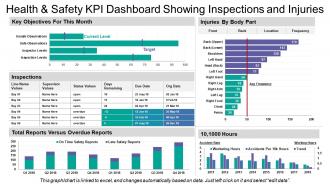 Health and safety kpi dashboard showing inspections and injuries
Presenting this set of slides with name - Health And Safety Kpi Dashboard Showing Inspections And Injuries. This is a five stage process. The stages in this process are Health And Safety, Health And Security, Health And Protection.
-
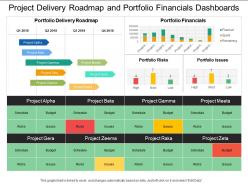 Project delivery roadmap and portfolio financials dashboards
Highlighting project delivery roadmap and portfolio financials dashboards PowerPoint presentation. Offer 100% access to change the size and style of the slides once downloaded and saved in the desired format. Beneficial for the business managers, marketing professionals and the strategy designers. Access to convert the presentation design into JPG and PDF. High quality images and visuals used in the designing process. Choice to get presentation slide in standard or in widescreen view. Easy to convert in JPEG and PDF document.
-
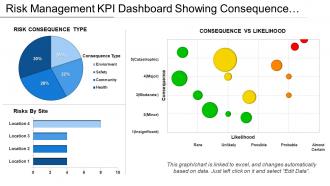 Risk Management Kpi Dashboard Showing Consequence Vs Likelihood
Presenting this set of slides with name - Risk Management Kpi Dashboard Showing Consequence Vs Likelihood. This is a three stage process. The stages in this process are Risk Management, Risk Assessment, Project Risk.
-
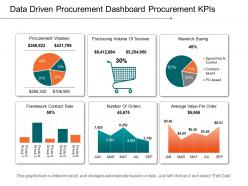 Data driven procurement dashboard snapshot procurement kpis example of ppt
Pre-designed data driven procurement dashboard for Kpis presentation template. Can be used for statistical data analysis. High-resolution PowerPoint presentation backgrounds for better clarity of the information displayed. Offers wide variety of options and colors to alter the appearance. Allows adding of enterprise personal details such as brand name, logo and much more. Enough space available to enter text and its related points in the PPT table. This PPT Slide is available in both Standard and Widescreen slide size. Compatible with multiple formats like JPEG, PDF and Google slides.
-
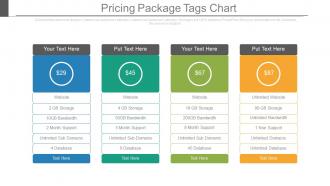 Pricing package tags chart ppt slides
Compatible with Google slides. Total freedom to any sort of manual editing. User friendly and amendable PowerPoint templates. Fit in wide screen preview. Effortless conversion into PDF or JPG format. Easy insertion of company name or business logo. Beneficial for entrepreneurs, business owners, investors, business analysts, marketers and professional individuals. The stages in this process are marketing, strategy, management, business.
-
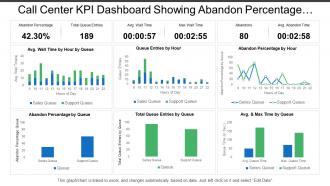 Call center kpi dashboard showing abandon percentage total queue entries
PowerPoint shape easy to amend as color, text, font etc are amendable. Notable quality presentation template. Well-adjusted online software programs such as JPG and PDF. Extra-ordinary picture quality as pixels don’t break when viewed in widescreen view. PPT design goes well with Google slides. Matching designs available with different nodes and stages. Handy presentation design saves you valuable time. Show the PowerPoint diagram with your corporate sign and title. Easy to download and can be saved for future reference.
-
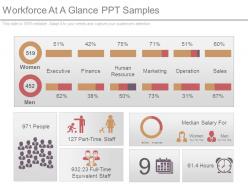 Workforce at a glance ppt samples
Presenting workforce at a glance ppt samples. This is a workforce at a glance ppt samples. This is a two stage process. The stages in this process are women, men, executive, finance, human resource, marketing, operation, sales.
-
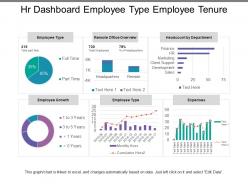 Hr dashboard employee type employee tenure
Presenting this set of slides with name - Hr Dashboard Employee Type Employee Tenure. This is a six stage process. The stages in this process are Hr Dashboard, Human Resource Dashboard, Hr Kpi.
-
 Ppt financial idea sharing analysis diagram flat powerpoint design
Presenting ppt financial idea sharing analysis diagram flat powerpoint design. Presenting ppt financial idea sharing analysis diagram flat powerpoint design. This Power Point template diagram has been crafted with graphic of dollar symbol and hands diagram. This PPT diagram contains the concept of financial idea sharing analysis. Use this PPT diagram for business and finance related presentations.
-
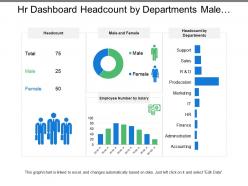 Hr dashboard headcount by departments male and female
Presenting this set of slides with name - Hr Dashboard Headcount By Departments Male And Female. This is a three stage process. The stages in this process are Hr Dashboard, Human Resource Dashboard, Hr Kpi.


