Project integration dashboard with productivity management

Rating:
100%
Project integration dashboard with productivity management
Slide 1 of 2
Favourites Favourites

Try Before you Buy Download Free Sample Product

Audience Impress Your
Audience
Editable 100%
Editable
Time Save Hours
of Time
The Biggest Sale is ending soon in
0
0
:
0
0
:
0
0
AI-Ready
Upload this template to AI and ask it to make any changes to content or color
100% editable Powerpoint Template for AI-assisted presentations. Finish your work in less time. Download Prompt Kit ​
Works with
Microsoft PowerPoint
Microsoft 365
Claude for PowerPoint
ChatGPT
Google Slides
Microsoft Copilot
Rating:
100%
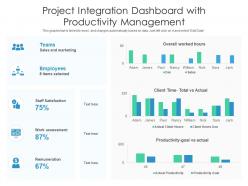
Introducing our Project Integration Dashboard With Productivity Management set of slides. The topics discussed in these slides are Work Assessment, Remuneration, Sales And Marketing. This is an immediately available PowerPoint presentation that can be conveniently customized. Download it and convince your audience.

People who downloaded this PowerPoint presentation also viewed the following :

FAQs for Project integration dashboard

Project integration dashboards offer centralized visibility, real-time progress tracking, enhanced team collaboration, automated reporting, and streamlined resource allocation across multiple project components. These platforms enable project managers to identify bottlenecks quickly, coordinate cross-functional teams more effectively, and deliver projects on time and within budget, with many organizations finding that integrated dashboards reduce project delays by up to thirty percent.

A project integration dashboard improves team communication and collaboration by centralizing project data, providing real-time updates, and creating shared visibility across all stakeholders and departments. Through unified interfaces, teams streamline information sharing, reduce email overload, and enhance decision-making speed, with many organizations finding that integrated dashboards ultimately deliver improved project outcomes and stronger cross-functional coordination.

**INPUT**: What metrics should be displayed on a project integration dashboard for effective decision-making? **OUTPUT**: Project integration dashboards should display real-time progress tracking, resource allocation efficiency, budget variance, milestone completion rates, and cross-functional dependency status. These metrics enable project managers to identify bottlenecks, optimize resource distribution, and maintain timeline adherence, with many organizations finding that comprehensive visibility ultimately delivers faster project completion and improved stakeholder alignment. [Word count: 54 words]

Project integration dashboards can be customized through configurable widgets, role-based access controls, custom KPI tracking, flexible reporting modules, and adaptable visual layouts. Organizations across sectors like construction, software development, and manufacturing leverage these customization features to align dashboard functionality with their specific project methodologies, stakeholder requirements, and operational workflows, ultimately delivering enhanced visibility and streamlined decision-making processes.

Real-time data serves as the backbone of project integration dashboards by enabling immediate visibility into project progress, resource allocation, and potential bottlenecks across multiple streams. This continuous data flow allows project managers to make informed decisions quickly, identify issues before they escalate, and optimize team performance, ultimately delivering faster project completion and enhanced stakeholder communication.

Project managers ensure dashboard accuracy by establishing automated data validation rules, implementing regular data quality audits, setting up real-time synchronization protocols, and creating standardized data entry procedures across all integrated systems. Through consistent monitoring and validation workflows, organizations streamline reporting processes, minimize manual errors, and enhance decision-making capabilities, with many finding that automated validation significantly reduces data discrepancies while improving overall project visibility.

Common challenges include data silos across different systems, inconsistent data formats, user adoption resistance, integration complexity with legacy tools, and establishing real-time synchronization protocols. These obstacles can significantly impact timeline and budget, with many organizations finding that thorough stakeholder training, phased rollouts, and robust API connections ultimately streamline implementation while delivering enhanced project visibility and operational efficiency.

Visual analytics enhances project integration dashboards by transforming complex data into intuitive charts, graphs, and interactive visualizations that reveal patterns, trends, and bottlenecks instantly. These visual elements enable project managers to quickly identify resource conflicts, track milestone dependencies, and communicate status updates effectively, while stakeholders across departments can grasp project interconnections and make informed decisions faster.

**INPUT**: What tools or software are best suited for creating a project integration dashboard? **OUTPUT**: Leading project integration dashboard tools include Microsoft Power BI, Tableau, Smartsheet, Monday.com, and Asana, each offering robust data visualization and workflow integration capabilities. These platforms streamline project oversight by consolidating multiple data sources, automating status updates, and delivering real-time insights, with many organizations finding enhanced operational efficiency and faster decision-making across departments. **Word count: 58 words**

Project integration dashboards facilitate stakeholder engagement by centralizing real-time project data, automated progress tracking, customizable reporting formats, and interactive visualization tools. These platforms streamline communication across departments, enable executives to monitor key performance indicators instantly, and deliver transparent project status updates, with many organizations finding that consolidated dashboards reduce reporting time while enhancing stakeholder confidence and decision-making speed.

Project integration dashboards offer real-time data visualization, automated updates, interactive filtering, and cross-functional connectivity, while traditional status reports rely on static documents, manual compilation, and periodic distribution. Modern dashboards enable project managers to streamline decision-making through instant access to integrated metrics, ultimately delivering faster response times and enhanced stakeholder collaboration compared to conventional reporting methods.

Integrating various data sources into a comprehensive project integration dashboard involves connecting APIs, databases, cloud platforms, file systems, and third-party applications through ETL processes, real-time data connectors, and middleware solutions. These integration methods streamline data consolidation by automating workflows, standardizing formats, and enabling cross-platform communication, ultimately delivering unified visibility and enhanced decision-making capabilities for project managers.

Industries like construction, IT services, healthcare, manufacturing, and financial services benefit most from project integration dashboards because they manage complex, multi-stakeholder projects with interdependent workflows and strict regulatory requirements. These dashboards streamline resource allocation, enhance cross-team visibility, and accelerate decision-making processes, with many organizations finding that centralized project oversight ultimately delivers improved operational efficiency and competitive advantage.

Project integration dashboards evolve with agile methodologies by incorporating real-time sprint tracking, burndown charts, velocity metrics, continuous integration status, and iterative feedback loops. These adaptive dashboards enable project teams to streamline workflow visibility, enhance cross-functional collaboration, and accelerate decision-making cycles, with many organizations finding that integrated agile dashboards ultimately deliver faster project outcomes and improved stakeholder alignment.

**INPUT**: What best practices should be followed to ensure the usability of a project integration dashboard? **OUTPUT**: Best practices for project integration dashboard usability include intuitive navigation design, role-based access controls, real-time data visualization, customizable widgets, and mobile responsiveness. These approaches streamline project oversight by reducing information silos, accelerating decision-making processes, and enhancing cross-team collaboration, with many organizations finding that well-designed dashboards ultimately deliver improved project delivery times and operational efficiency. [Word count: 58 words]

Ratings and Reviews

100% of 100
Review Form
Write a review
Most Relevant Reviews
  1. 100%

    by Cyrus Ellis

    Awesome use of colors and designs in product templates.

1 Item

per page: