Project Management Controlling And Monitoring Powerpoint Presentation Slides
In order to help you summarize all the aspects of your project, we have come up with content-ready project management controlling and monitoring PowerPoint presentation slides. Project management is the foundation block on which any task is executed successfully. The project planning PPT designs provide iterative processes and techniques so you can easily manage the people and the tasks involved. Here we have included slides on project charter, schedule, resource, budget, quality, risk, communication, project lifecycle phase, work breakdown structure, team management, and activity planning chart. Other related topics such as project implementation, project execution, documentation, portfolio management, and project governance have also been covered. Not having a process to manage your projects can result in wastage of time, money and resources. So, download project management controlling and monitoring presentation and communicate various stages of the project to your entire team. Fulfill your destiny with our project management ppt Slides. They will make your dreams come true.
In order to help you summarize all the aspects of your project, we have come up with content-ready project management contr..
- Google Slides is a new FREE Presentation software from Google.
- All our content is 100% compatible with Google Slides.
- Just download our designs, and upload them to Google Slides and they will work automatically.
- Amaze your audience with SlideTeam and Google Slides.
-
Want Changes to This PPT Slide? Check out our Presentation Design Services
- WideScreen Aspect ratio is becoming a very popular format. When you download this product, the downloaded ZIP will contain this product in both standard and widescreen format.
-

- Some older products that we have may only be in standard format, but they can easily be converted to widescreen.
- To do this, please open the SlideTeam product in Powerpoint, and go to
- Design ( On the top bar) -> Page Setup -> and select "On-screen Show (16:9)” in the drop down for "Slides Sized for".
- The slide or theme will change to widescreen, and all graphics will adjust automatically. You can similarly convert our content to any other desired screen aspect ratio.
Compatible With Google Slides

Get This In WideScreen
You must be logged in to download this presentation.
PowerPoint presentation slides
These graphics are 100% editable to your requirements. 77 uniquely designed slides. Instantly download with just a single click. Standard and widescreen compatibility so you can view in all devices. Can be opened with Google Slides also. Suitable for use by businessmen, team leaders, and firms. Premium Customer support service.This is a one stage process. The stages in this process are project management, quality assurance, strategic management, strategic planning, supply chain management, value chain analysis.
People who downloaded this PowerPoint presentation also viewed the following :
Content of this Powerpoint Presentation
Slide 1: This is an introductory slide for Project Management Controlling and Monitoring. State your company name and begin.
Slide 2: This is Our Agenda slide. State your company agendas here.
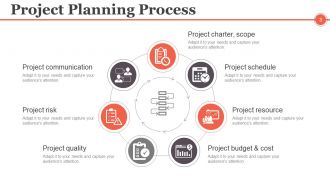
Slide 3: This slide presents Project Planning Process displaying- Project charter, scope, Project schedule, Project communication, Project resource, Project risk, Project budget & cost, Project quality.
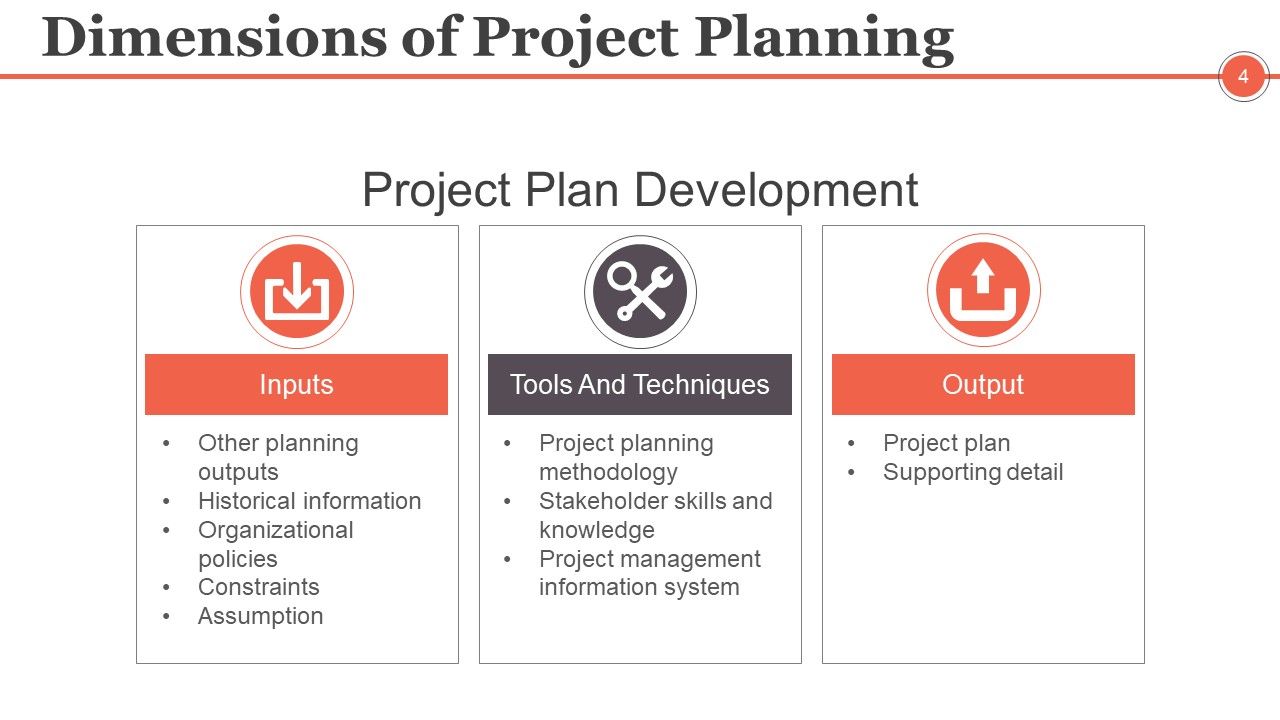
Slide 4: This slide presents Dimensions of Project Planning with- Inputs: (Other planning outputs, Historical information, Organizational policies, Constraints, Assumption) Tools And Techniques: (Project planning methodology, Stakeholder skills and knowledge, Project management information system) Output: (Project plan, Supporting detail).
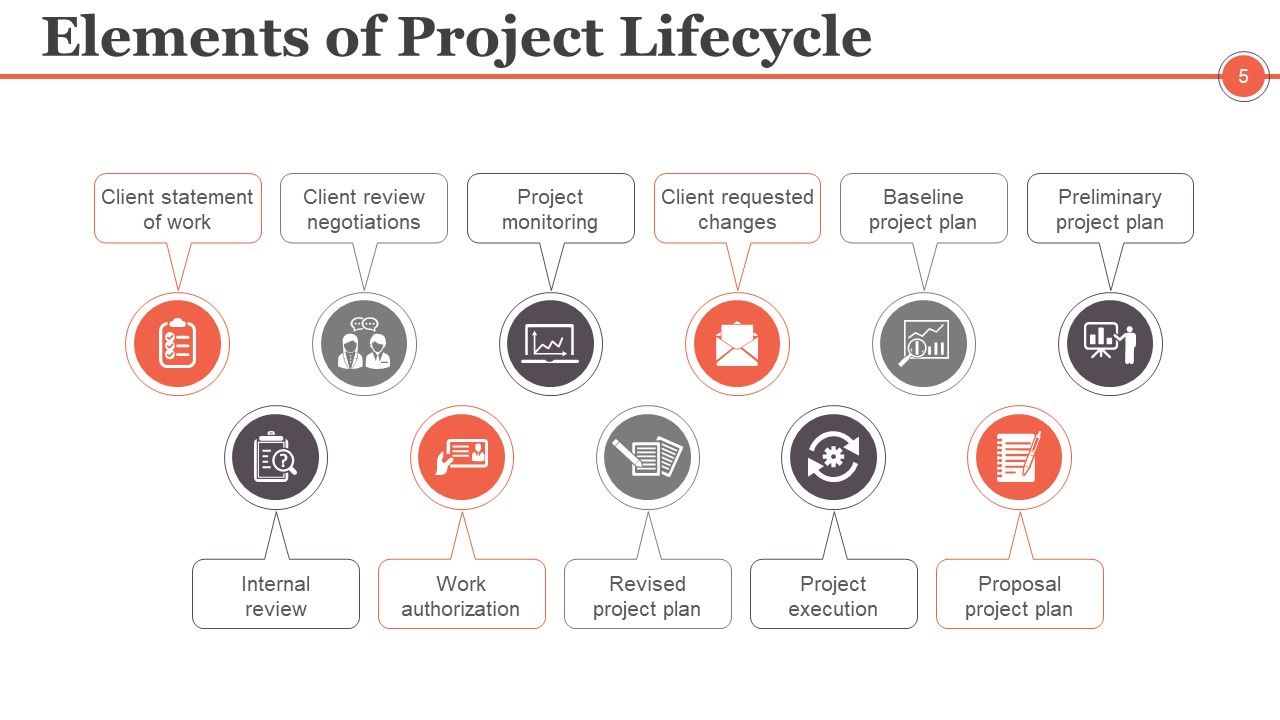
Slide 5: This slide shows Elements of Project Lifecycle. The listed ones are- Internal review, Work authorization, Revised project plan, Project execution, Proposal project plan, Client statement of work, Client review negotiations, Project monitoring, Client requested changes, Baseline project plan, Preliminary project plan.
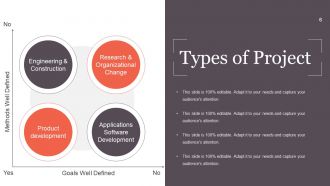
Slide 6: This slide shows Types of Project with the following content- Methods Well Defined, Goals Well Defined, Engineering & Construction, Product development, Research & Organizational Change, Applications Software Development.
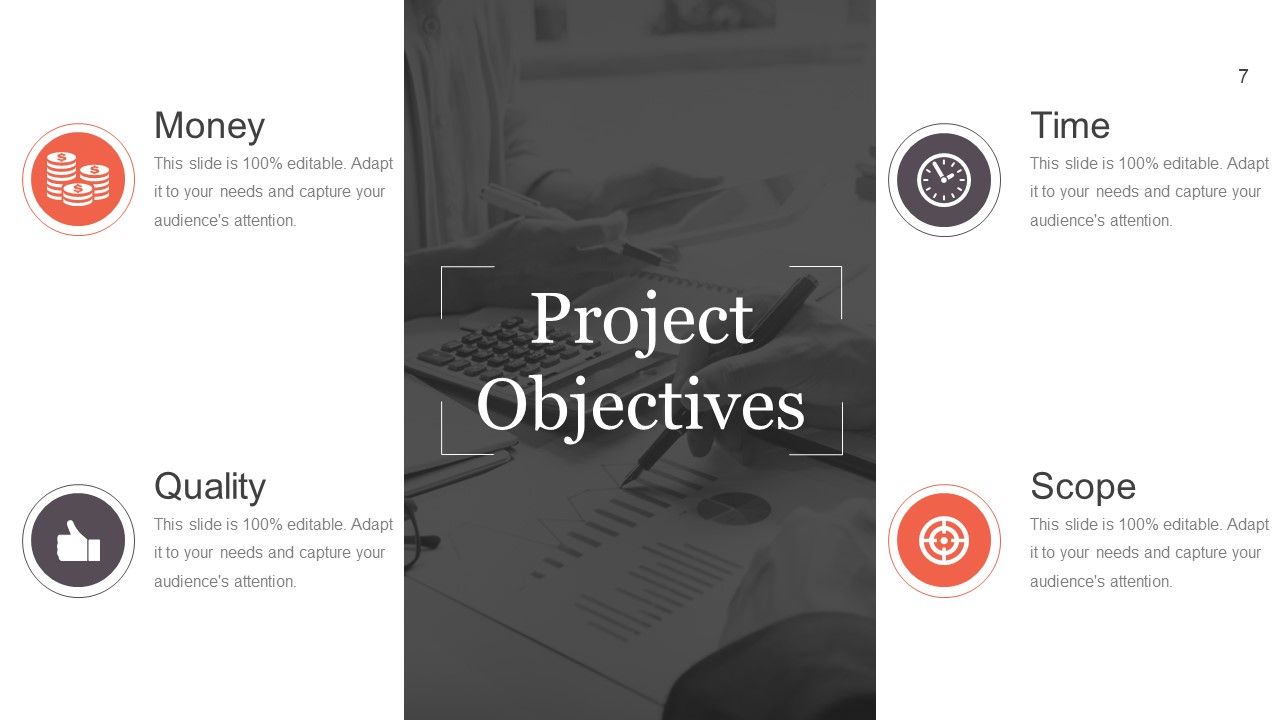
Slide 7: This slide showcases Project Objectives with the following points- Scope, Time, Money, Quality.
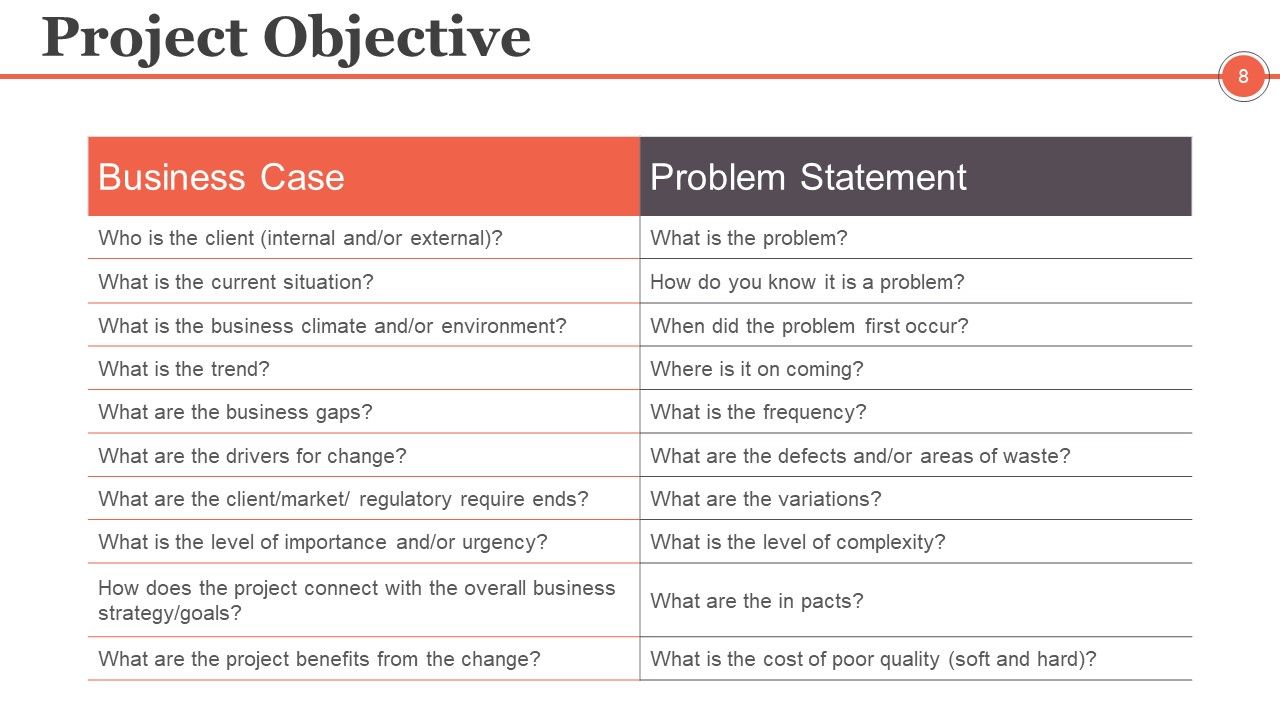
Slide 8: This is a Project Objective slide with Business case and Problem Statement.
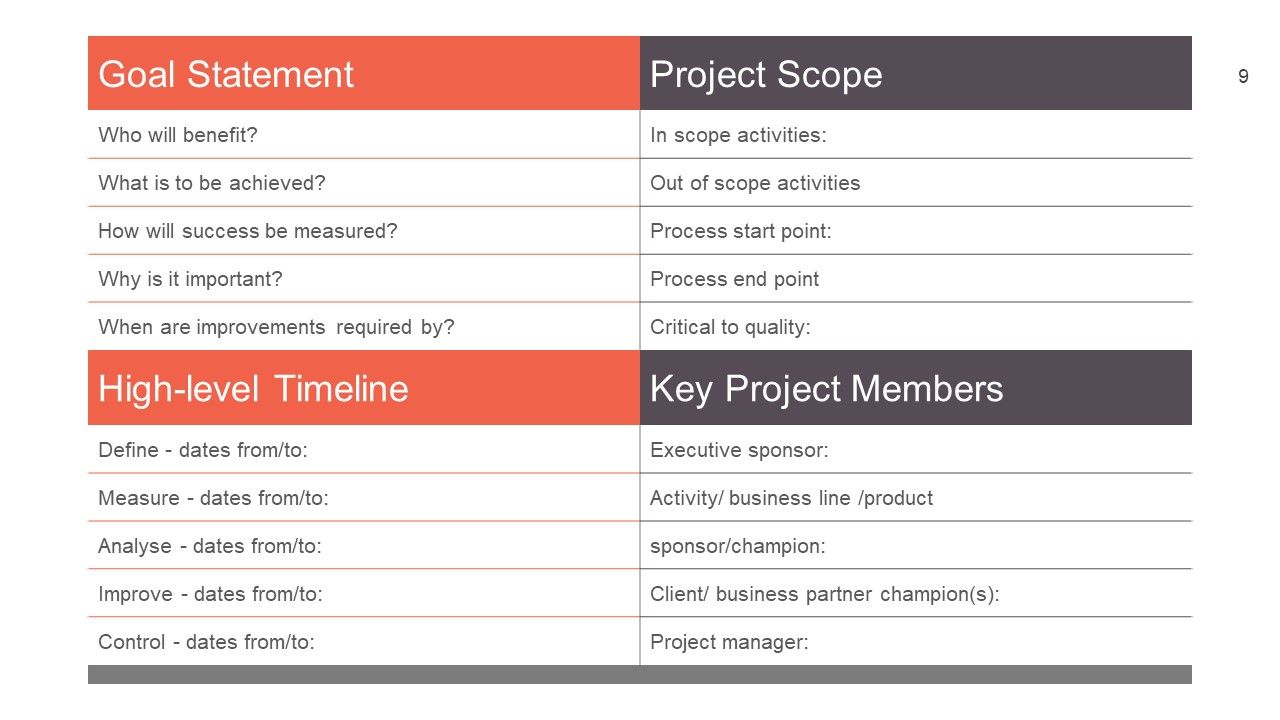
Slide 9: This slide showcases Goal statement, Project Scope, Timeline and Key members.
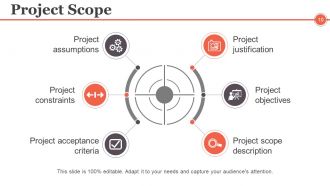
Slide 10: This slide displays Project Scope consisting of- Project objectives, Project scope description, Project assumptions, Project constraints, Project acceptance criteria.
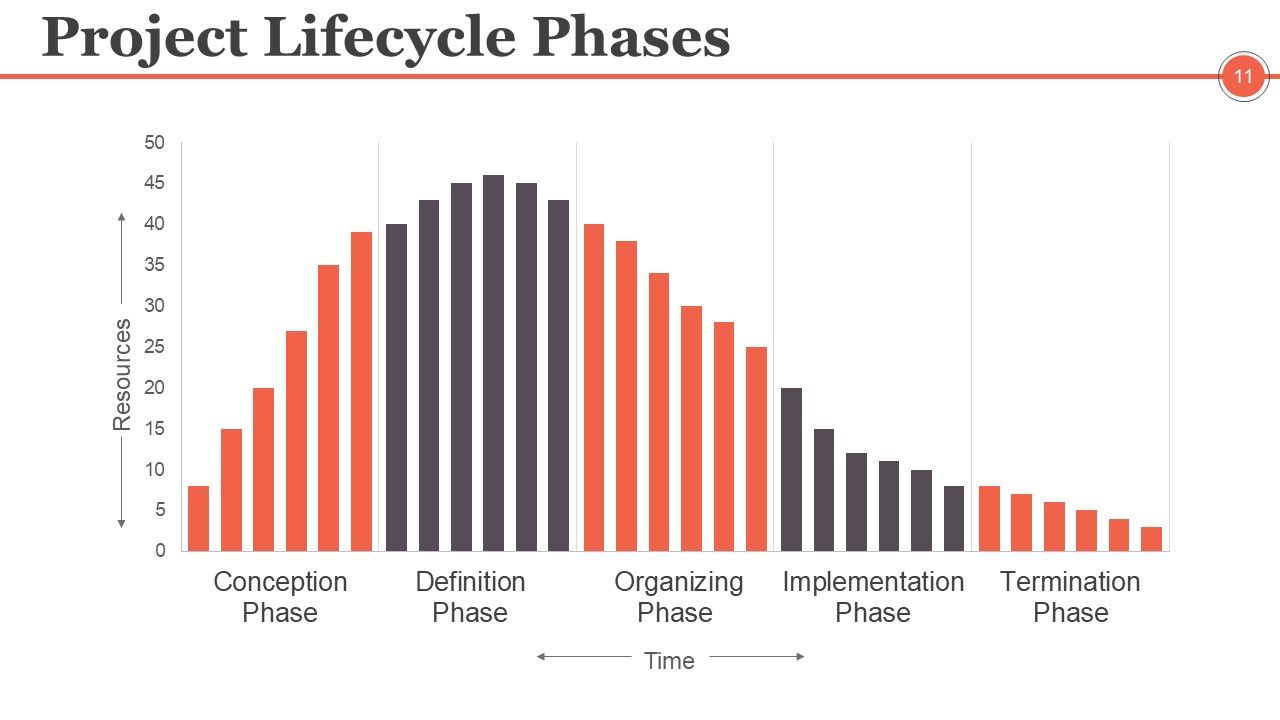
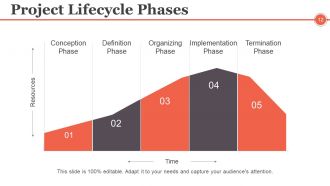
Slide 11: This slide showcases Project Lifecycle Phases in graph form.
Slide 12: This slide showcases Project Lifecycle Phases in graph form with the following points- Conception Phase, Definition Phase, Organizing Phase, Implementation Phase, Termination Phase.
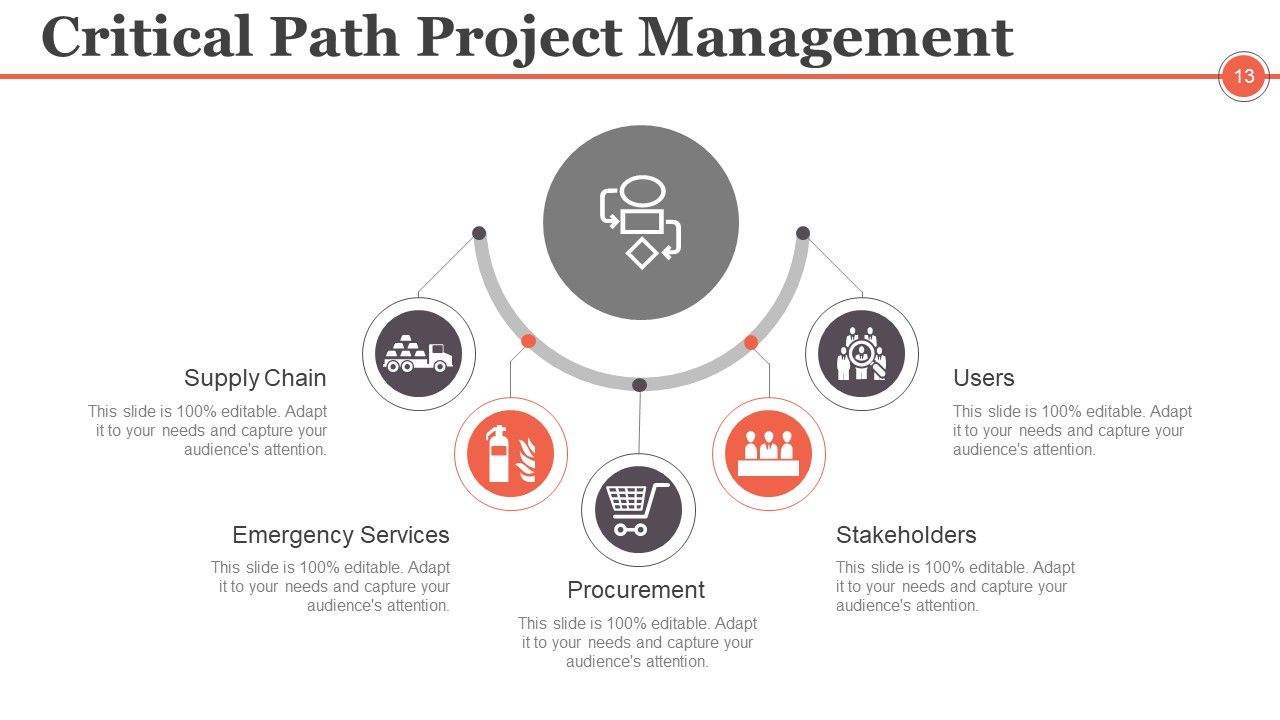
Slide 13: This slide shows Critical Path Project Management with- Procurement, Emergency Services, Stakeholders, Supply Chain, Users.
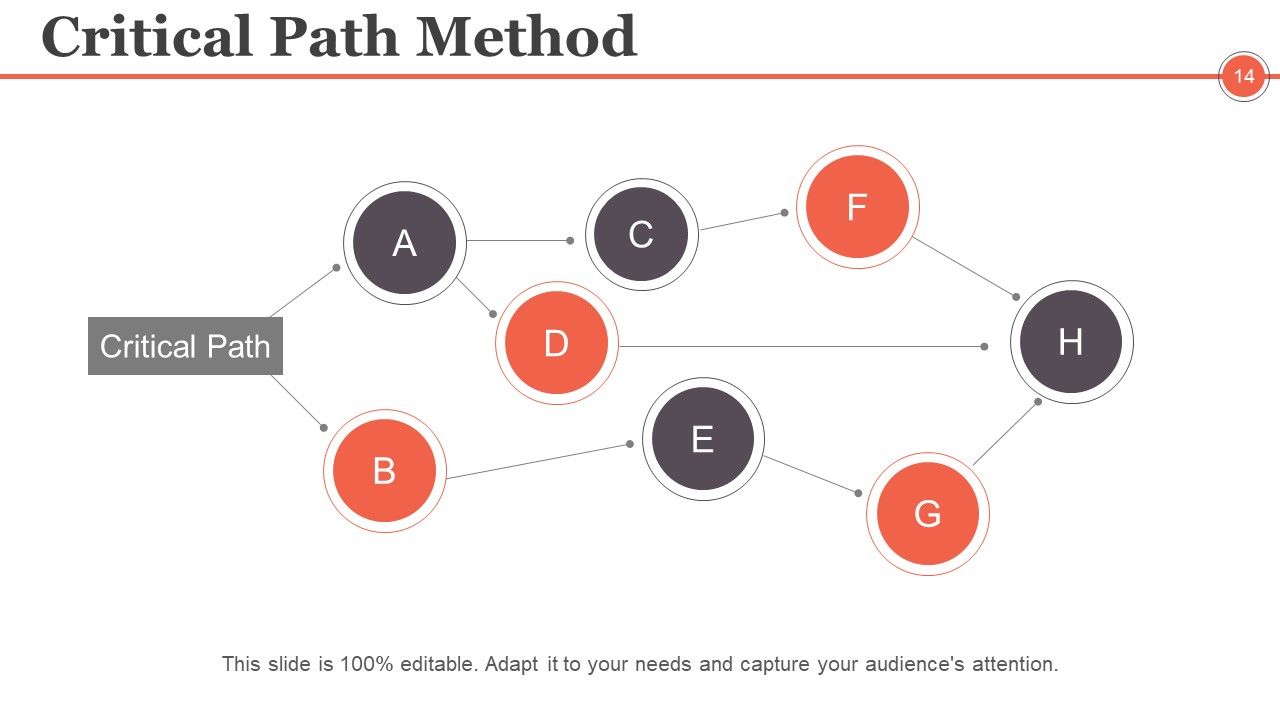
Slide 14: This slide shows a Critical Path Method diagram.
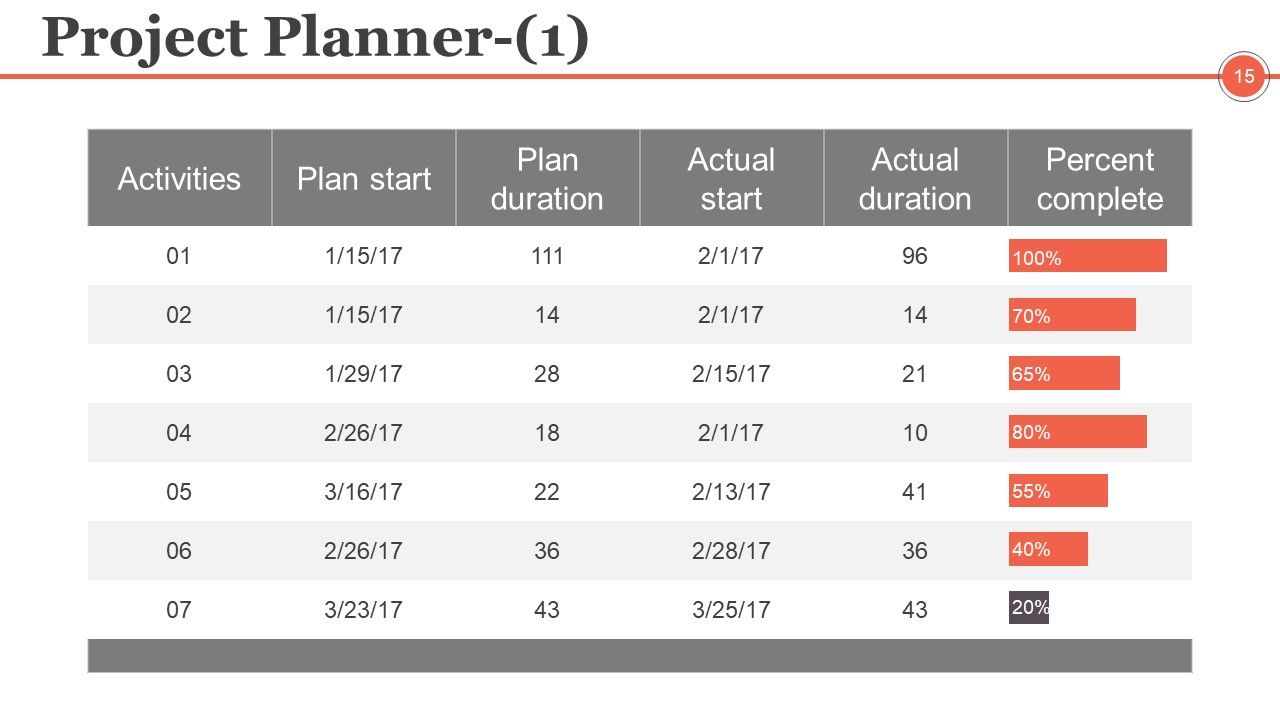
Slide 15: This is the first slide on Project Planner in tabular form.
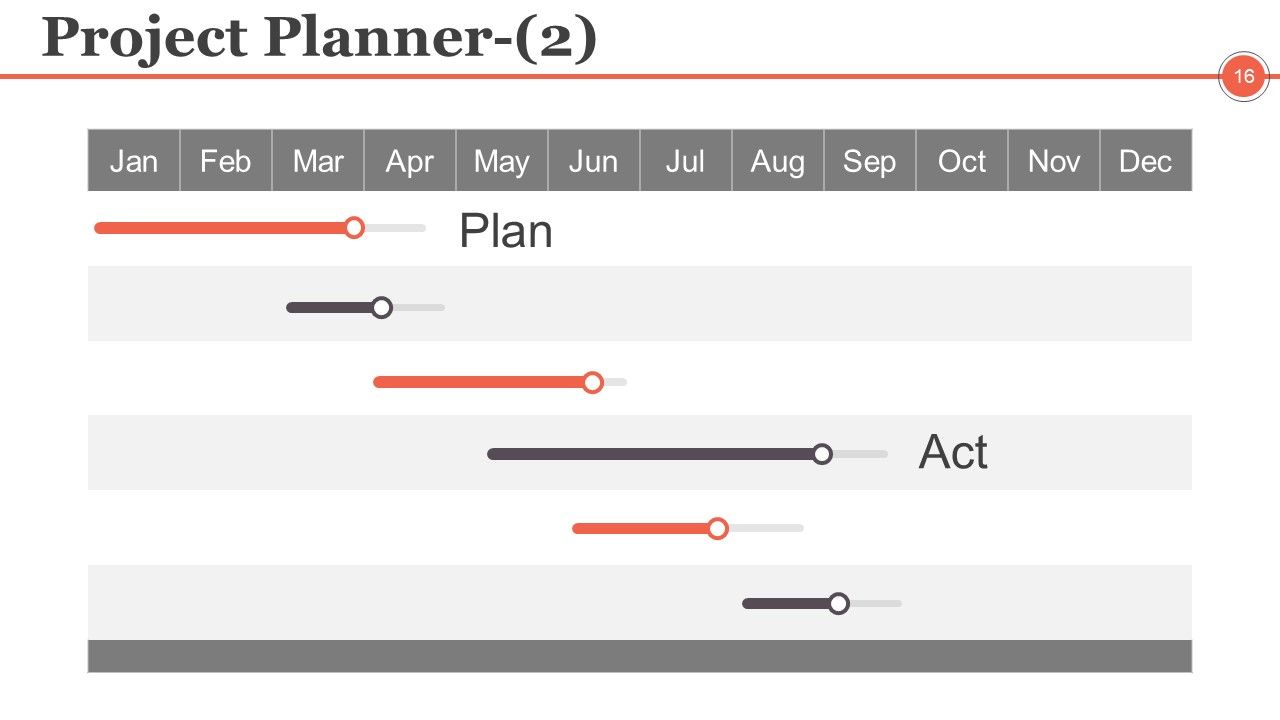
Slide 16: This is the second slide on Project Planner in gantt chart form.
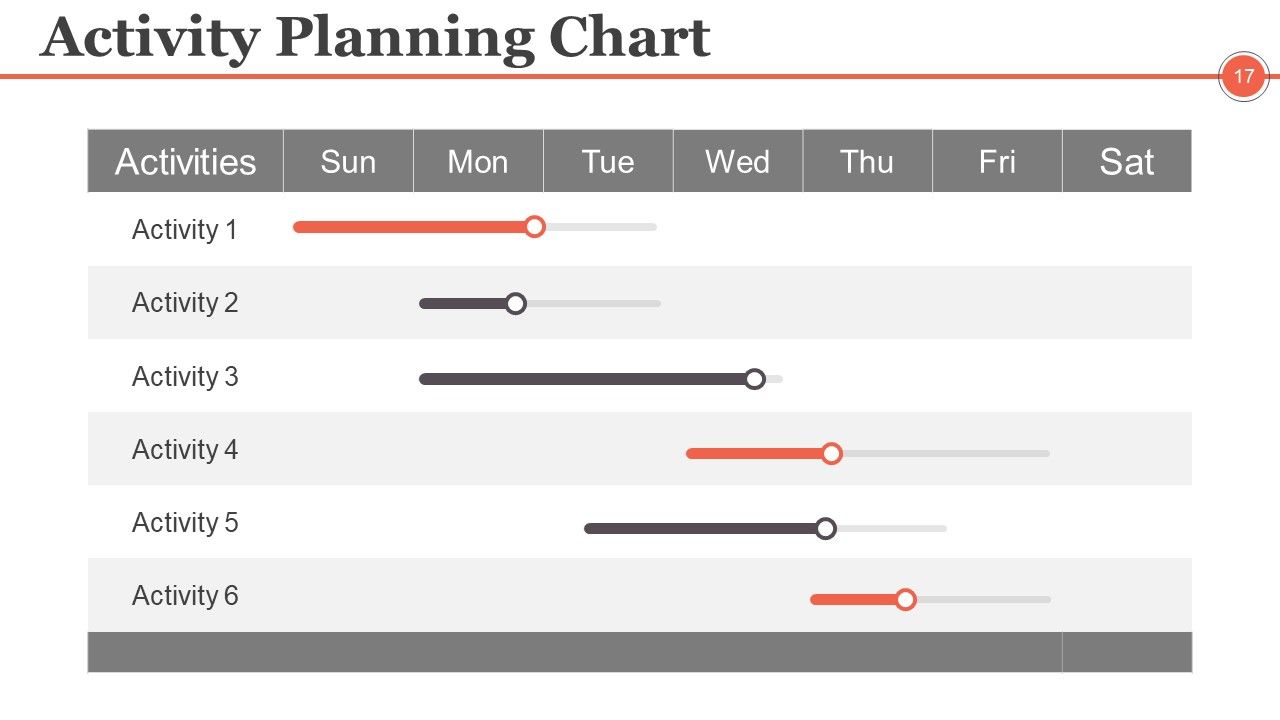
Slide 17: This slide presents an Activity Planning Chart.
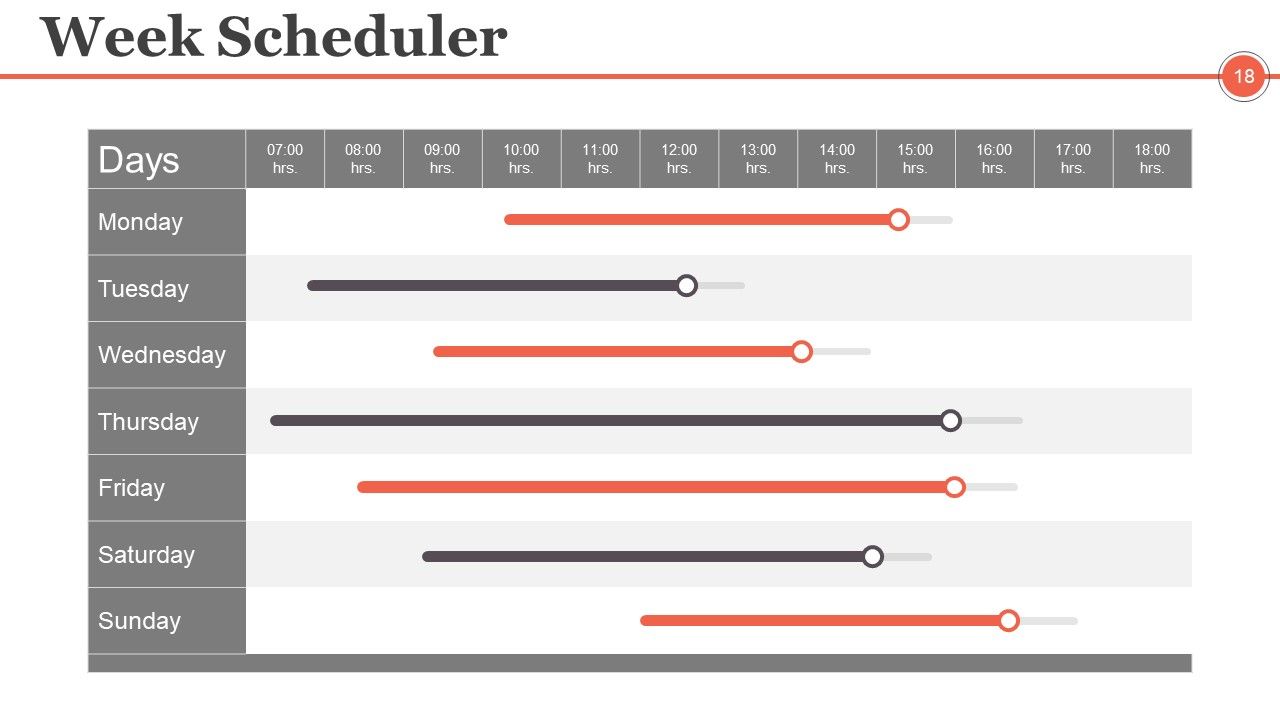
Slide 18: This slide displays Week Scheduler. Schedule, manage or arrange work load accordingly with it.
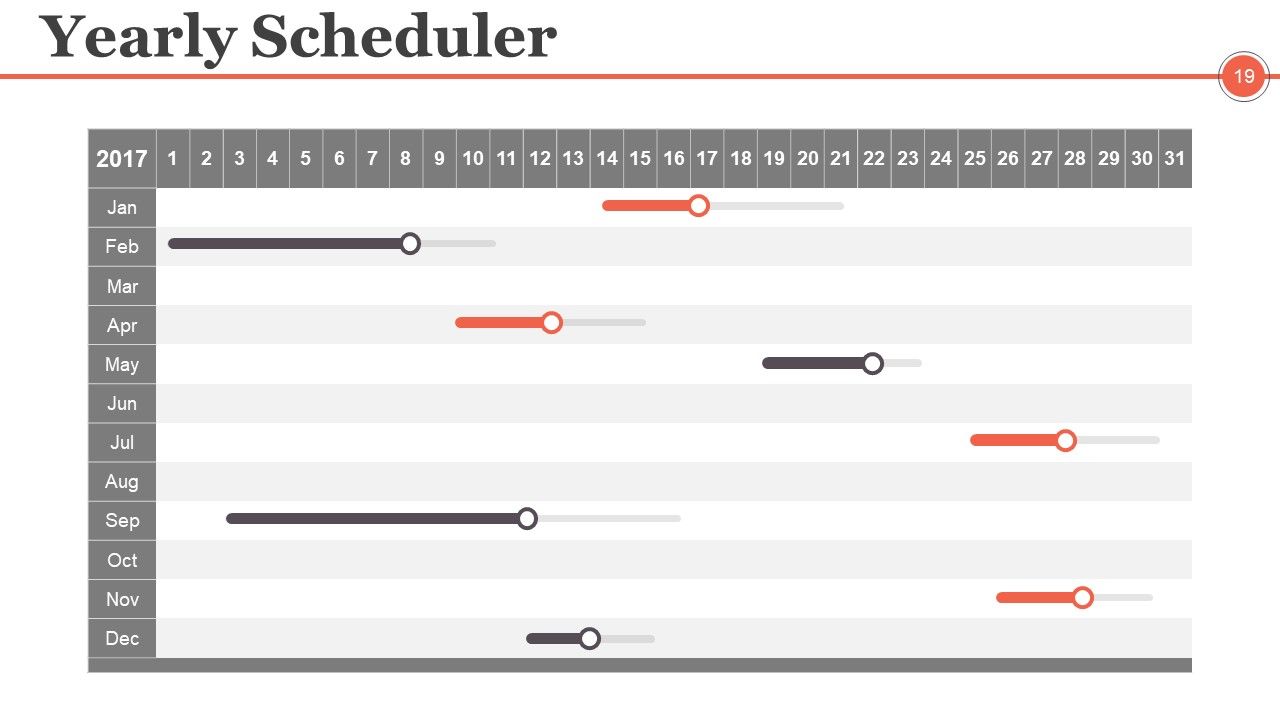
Slide 19: This slide displays Yearly Scheduler. Schedule, manage or plan work accordingly with it.
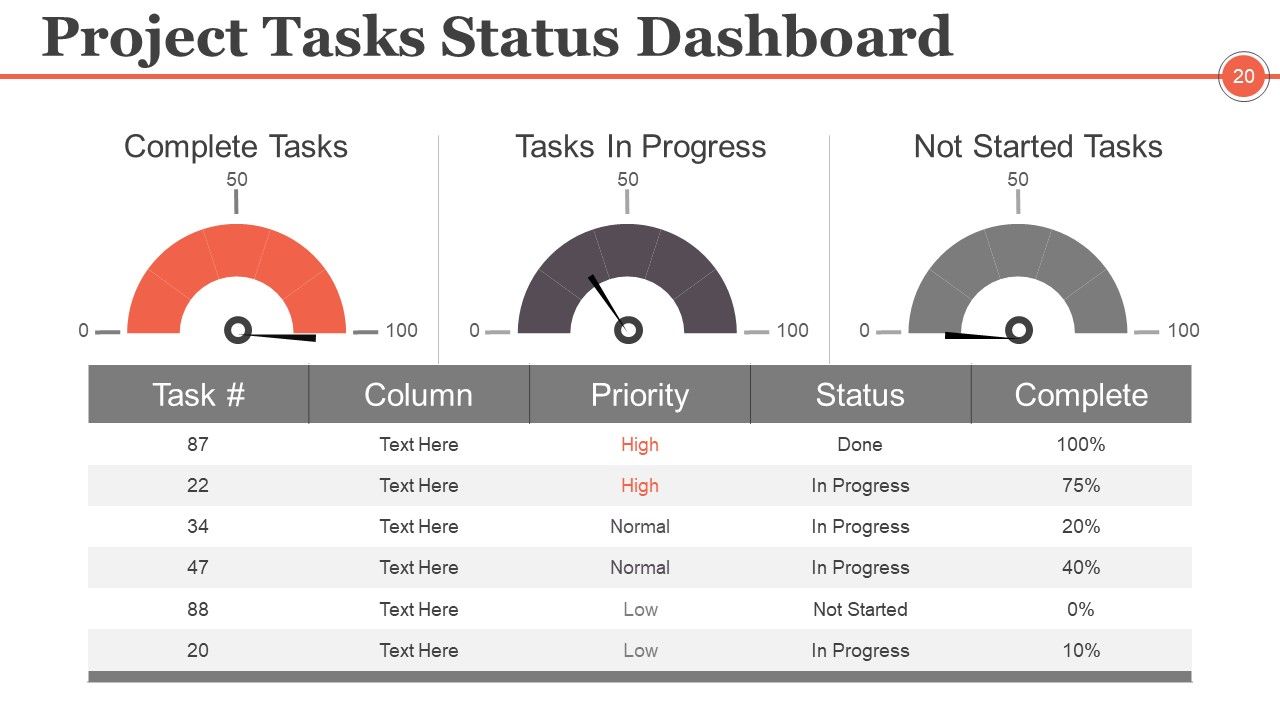
Slide 20: This slide showcases a Project Tasks Status Dashboard showing- Complete Tasks, Tasks In Progress, Not Started Tasks. State them here.
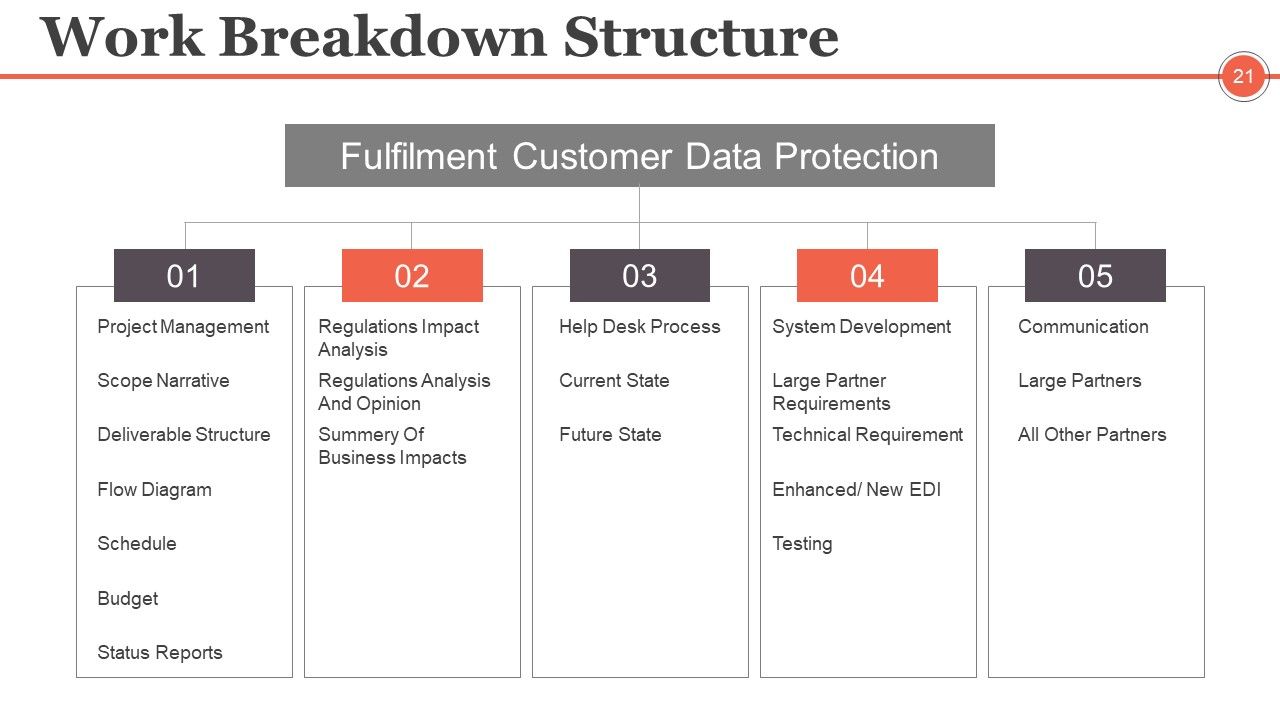
Slide 21: This slide presents a Work Breakdown Structure with the following content- Fulfilment Customer Data Protection: Project Management, Scope Narrative, Deliverable Structure, Flow Diagram, Schedule, Budget, Status Reports, Regulations Impact Analysis, Regulations Analysis And Opinion, Summery Of Business Impacts, Help Desk Process, Current State, Future State, System Development, Large Partner Requirements, Technical Requirement, Enhanced/ New EDI, Testing, Communication, Large Partners, All Other Partners.
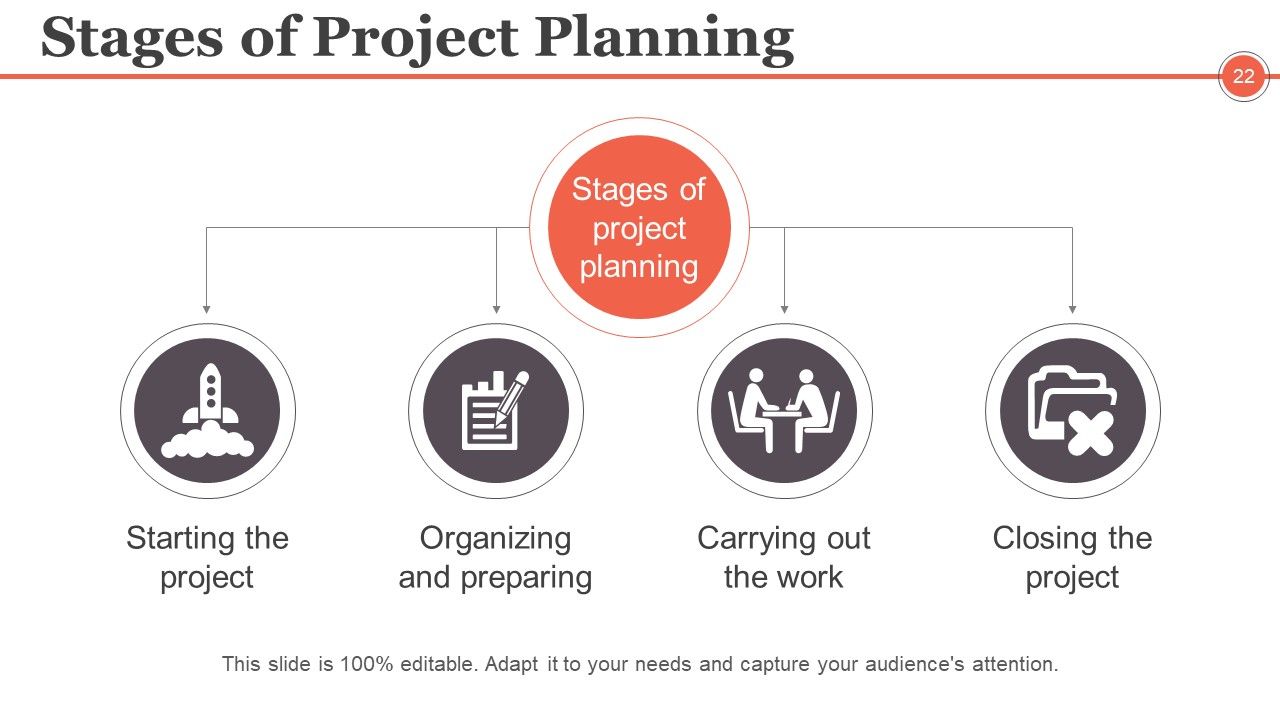
Slide 22: This slide shows Stages of Project Planning. The stages listed are- Starting the project, Organizing and preparing, Carrying out the work, Closing the project.
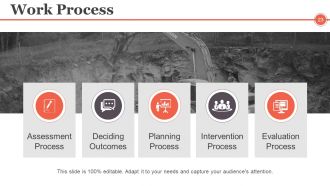
Slide 23: This slide shows Work Process with the following subheadings- Assessment Process, Deciding Outcomes, Planning Process, Intervention Process, Evaluation Process.
Slide 24: This slide shows Project Team Management. Showcase it's aspects etc. here.
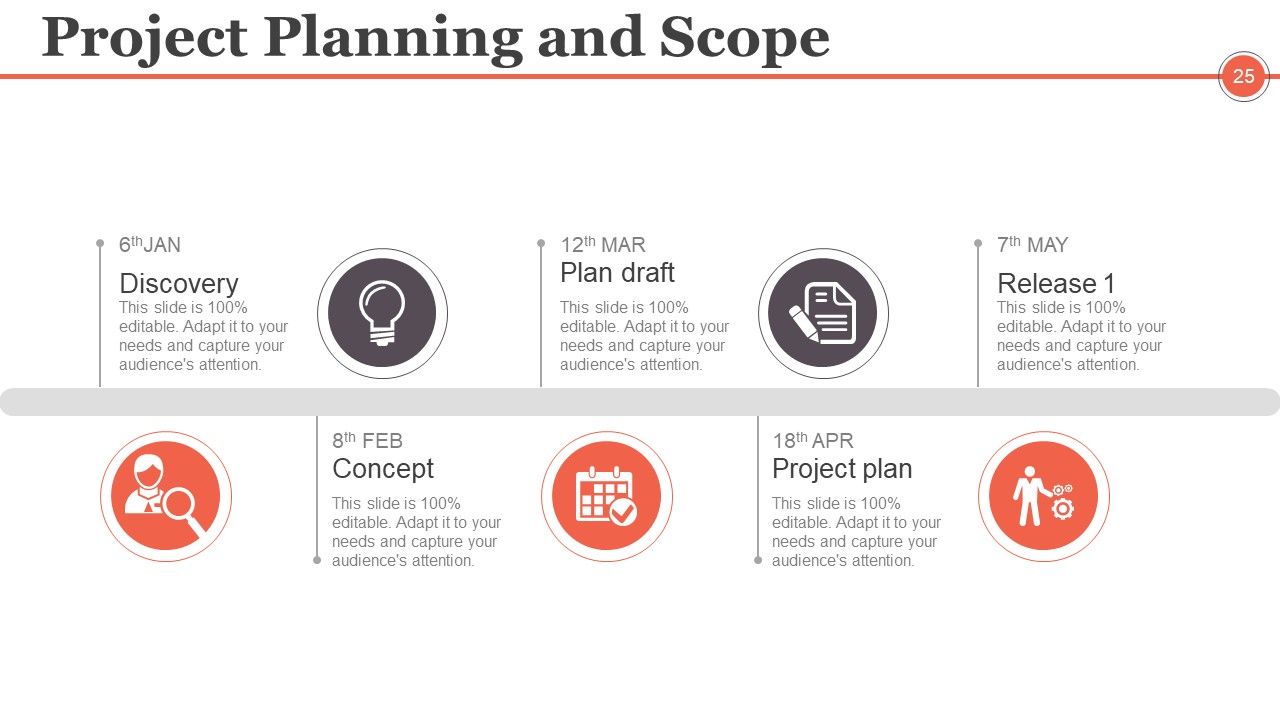
Slide 25: This slide showcases Project Planning and Scope with the following points- Discovery, Concept, Plan draft, Project plan, Release.
Slide 26: This is a Coffee Break slide to halt. You may change the slide content as per need.
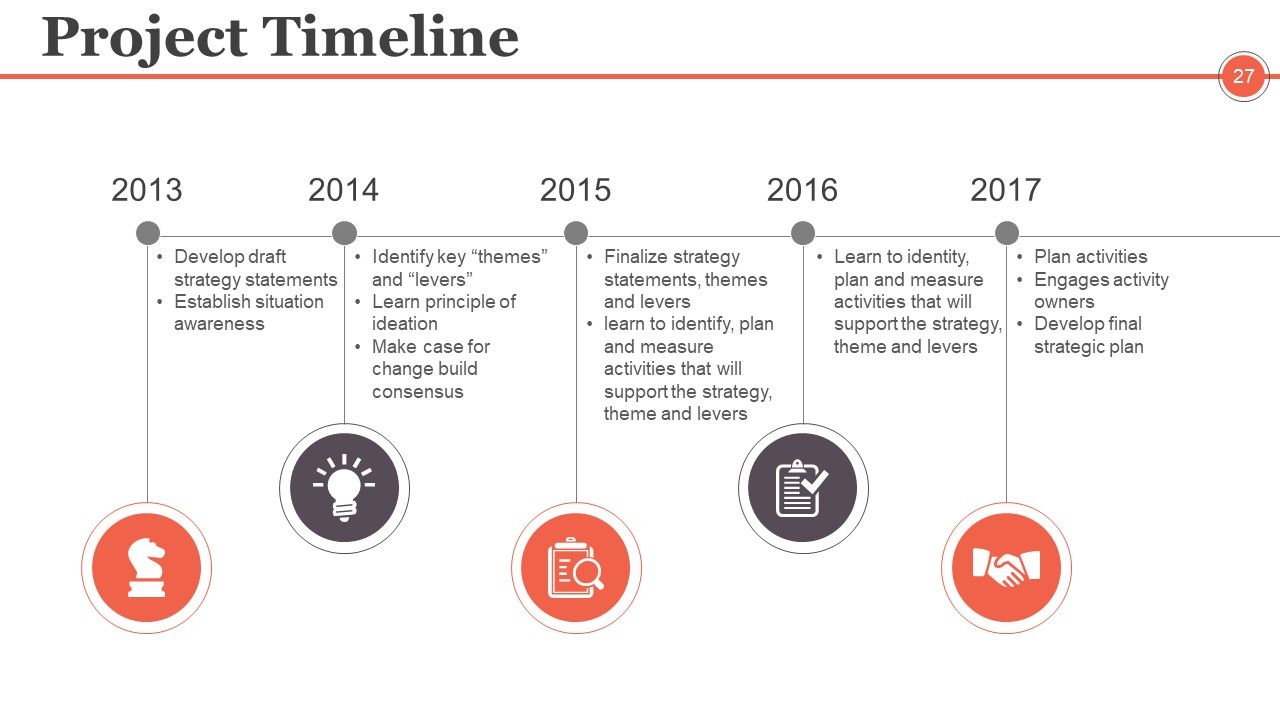
Slide 27: This slide presents a Project Timeline displaying- Develop draft strategy statements, Establish situation awareness, Plan activities, Engages activity owners, Develop final strategic plan, Identify key “themes” and “levers”, Learn principle of ideation, Make case for change build consensus, Finalize strategy statements, themes and levers, Learn to identify, plan and measure activities that will support the strategy, theme and levers.
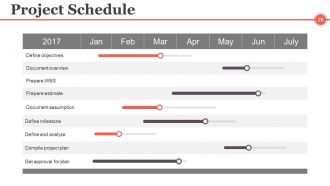
Slide 28: This slide presents a Project Schedule. State scheduling, planning aspects here.
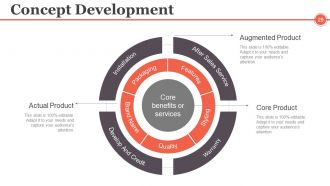
Slide 29: This slide displays Concept Development with the following subheadings- Augmented Product, Core Product, Actual Product.
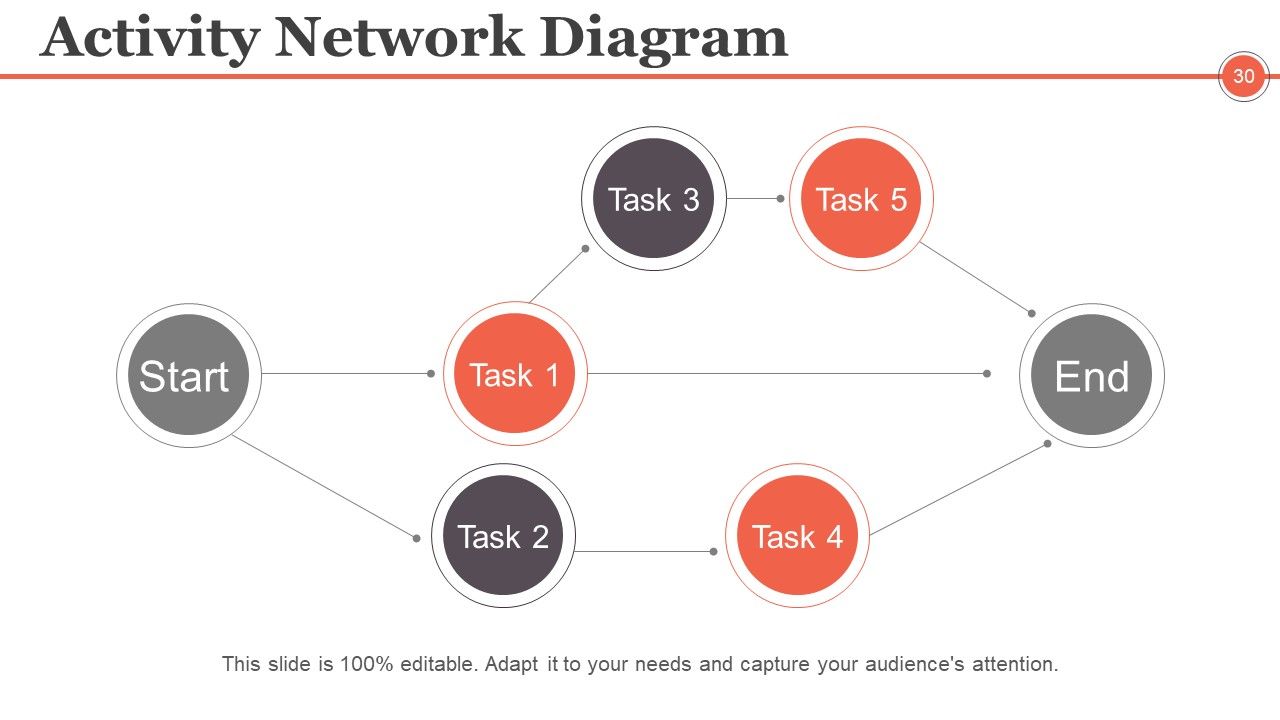
Slide 30: This is an Activity Network Diagram slide. State activities, plans etc. here.
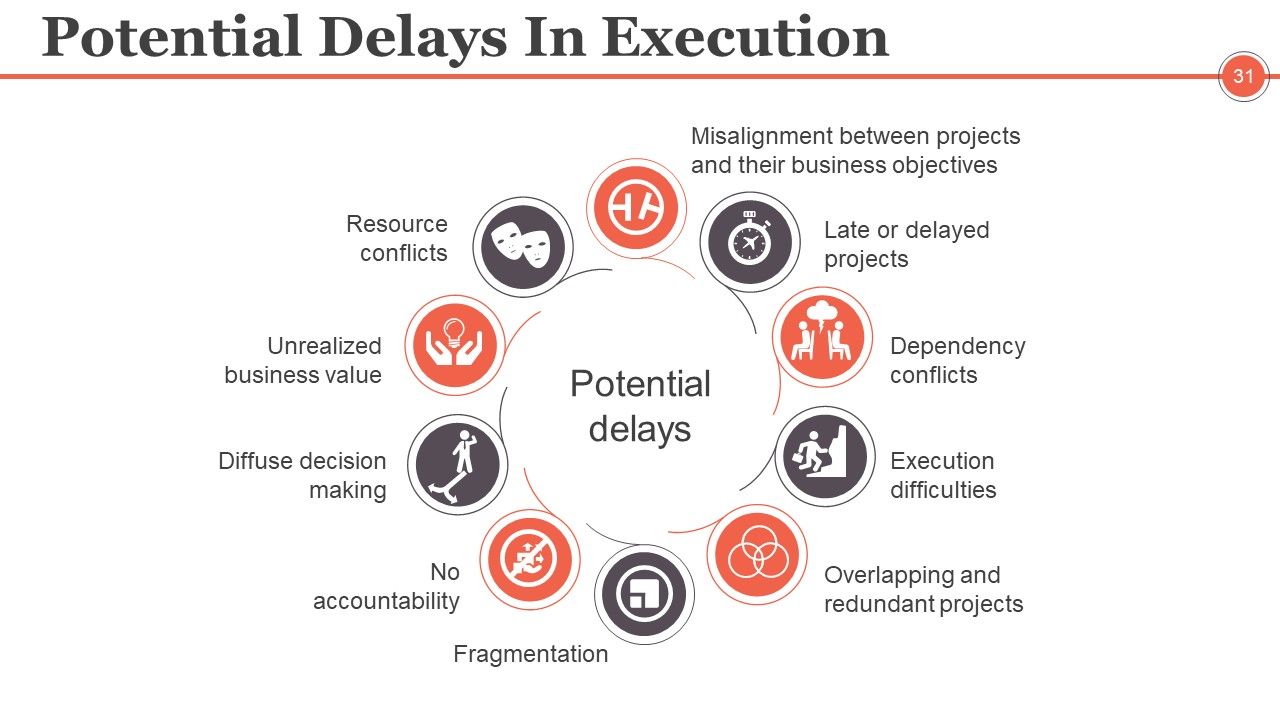
Slide 31: This slide shows Potential Delays In Execution with the following points- Execution difficulties, Misalignment between projects and their business objectives, Late or delayed projects, Dependency conflicts, Overlapping and redundant projects, Fragmentation, No accountability, Diffuse decision making, Unrealized business value, Resource conflicts.
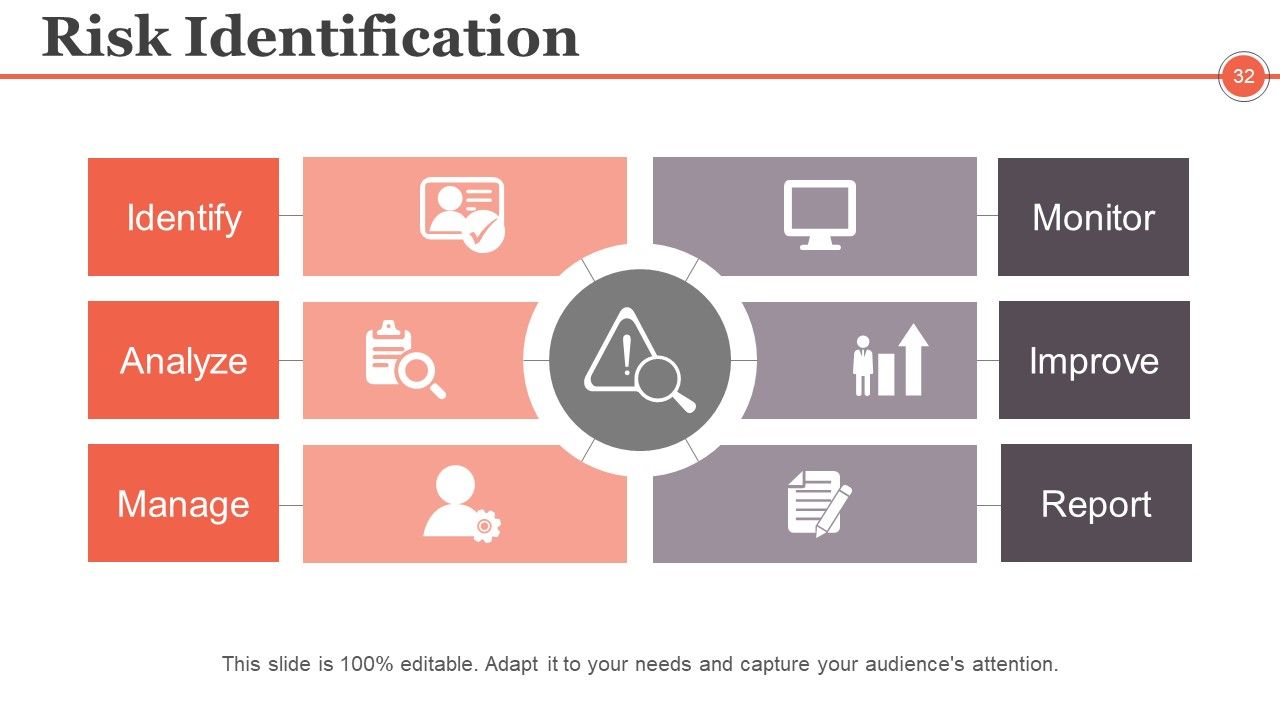
Slide 32: This slide shows Risk Identification with the following points- Identify, Analyze, Manage, Monitor, Improve, Report.
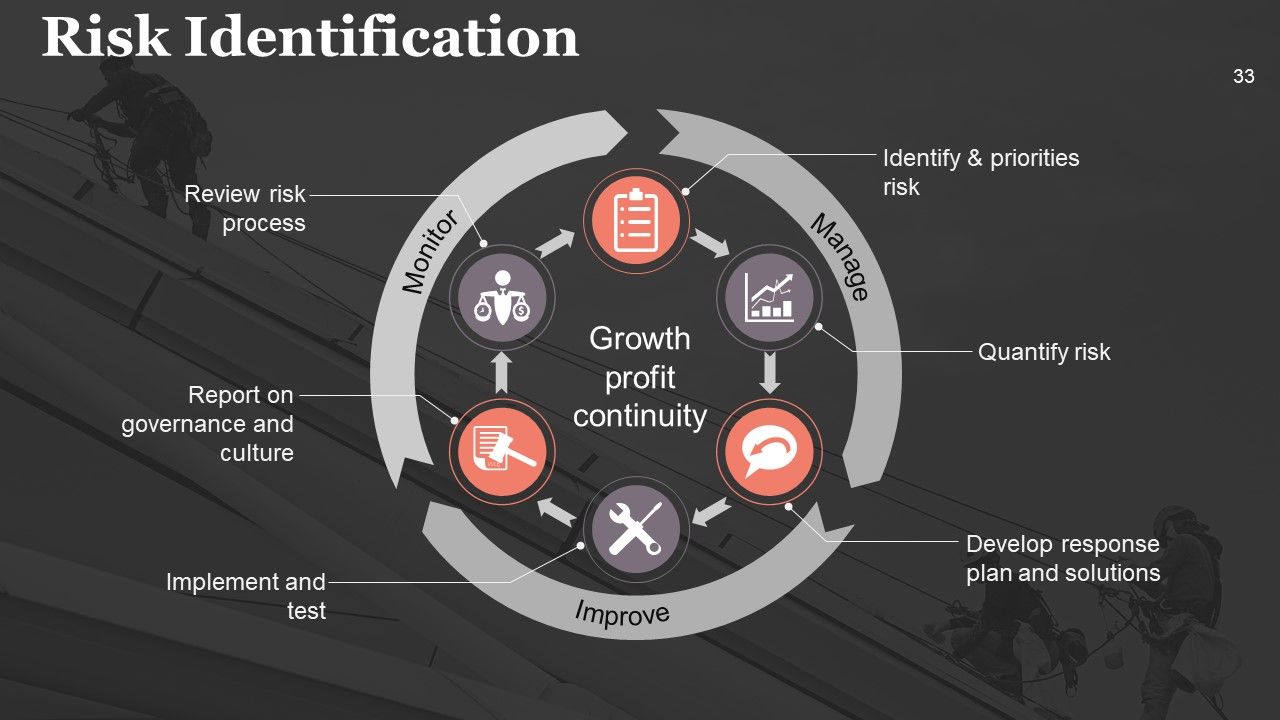
Slide 33: This slide shows Risk Identification with the following points- Quantify risk, Develop response plan and solutions, Report on governance and culture, Implement and test, Review risk process, Identify & priorities risk, Growth profit continuity under the subheadings- Monitor, Manage, Improve.
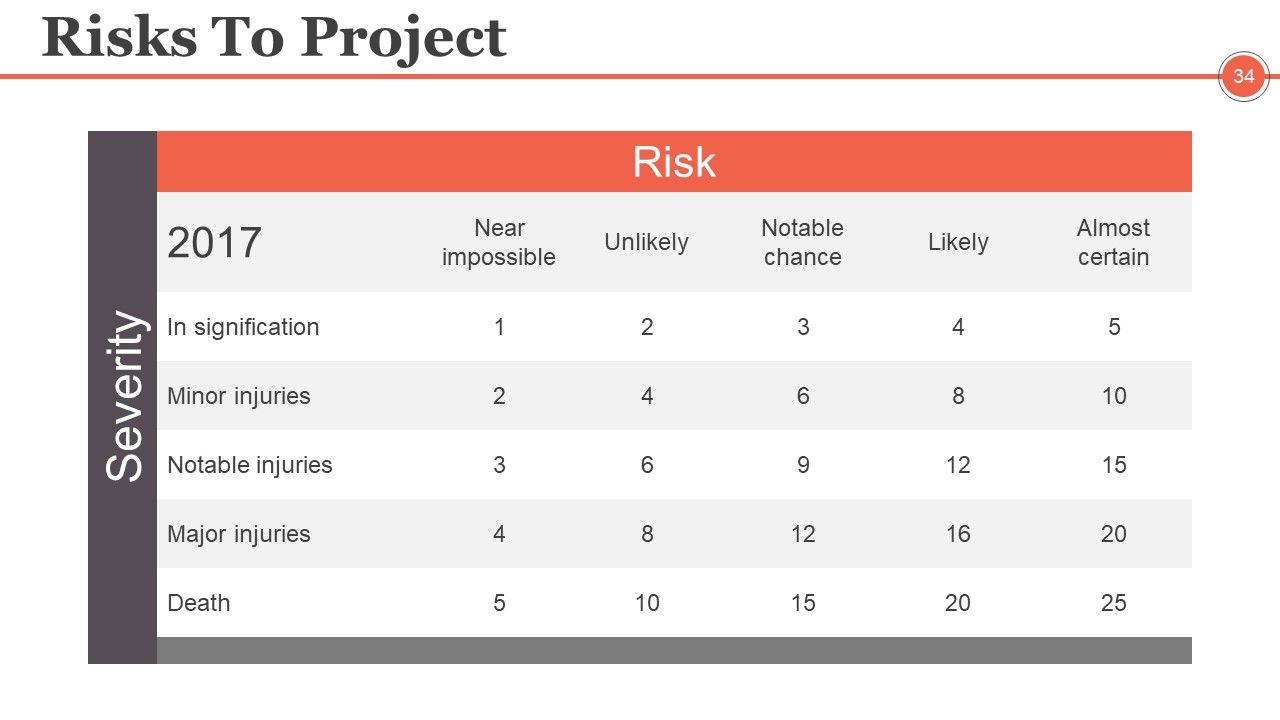
Slide 34: This slide presents Risks To Project table with risks and severity parameter.
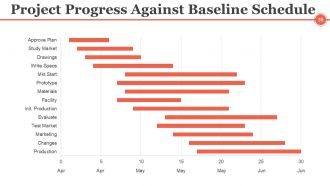
Slide 35: This slide shows Project Progress Against Baseline Schedule in gantt chart form.
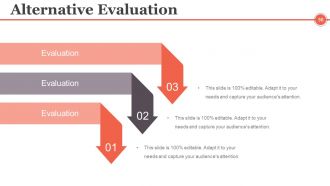
Slide 36: This slide presents Alternative Evaluation. State alternative aspects here.
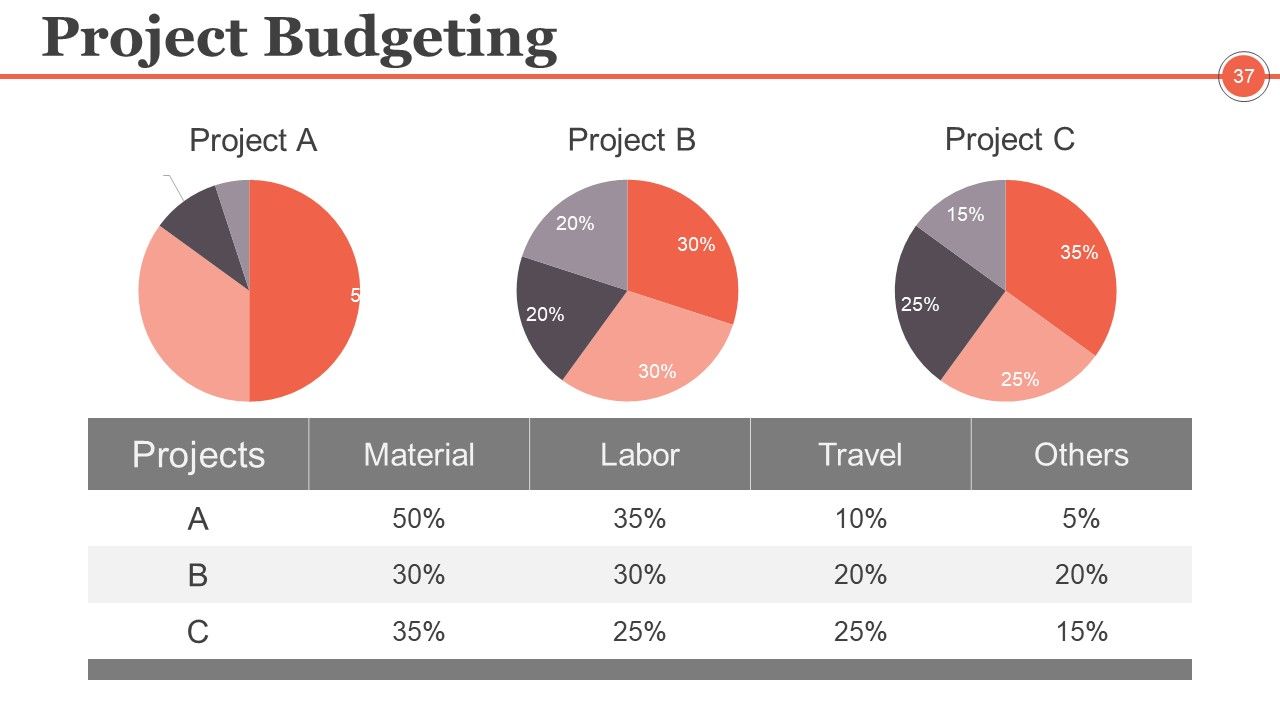
Slide 37: This slide showcases Project Budgeting for proejct management in pie chart form.
Slide 38: This is Project Management Controlling and Monitoring Icons slide. Use the icons as per need.
Slide 39: This slide is titled Additional Slides to move forward. You may change the slide content as per need.
Slide 40: This is an About Our Company slide. State company specifications here.
Slide 41: This is an Our Mission slide. State your company mission here.
Slide 42: This is an Our Goal slide. State goals etc. here.
Slide 43: This is Meet Our Team slide with names, designation and image boxes to fill information for.
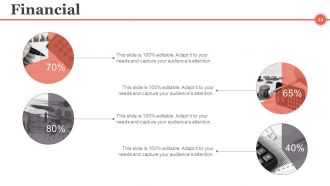
Slide 44: This is a Financial score slide. State financial aspects, information etc. here.
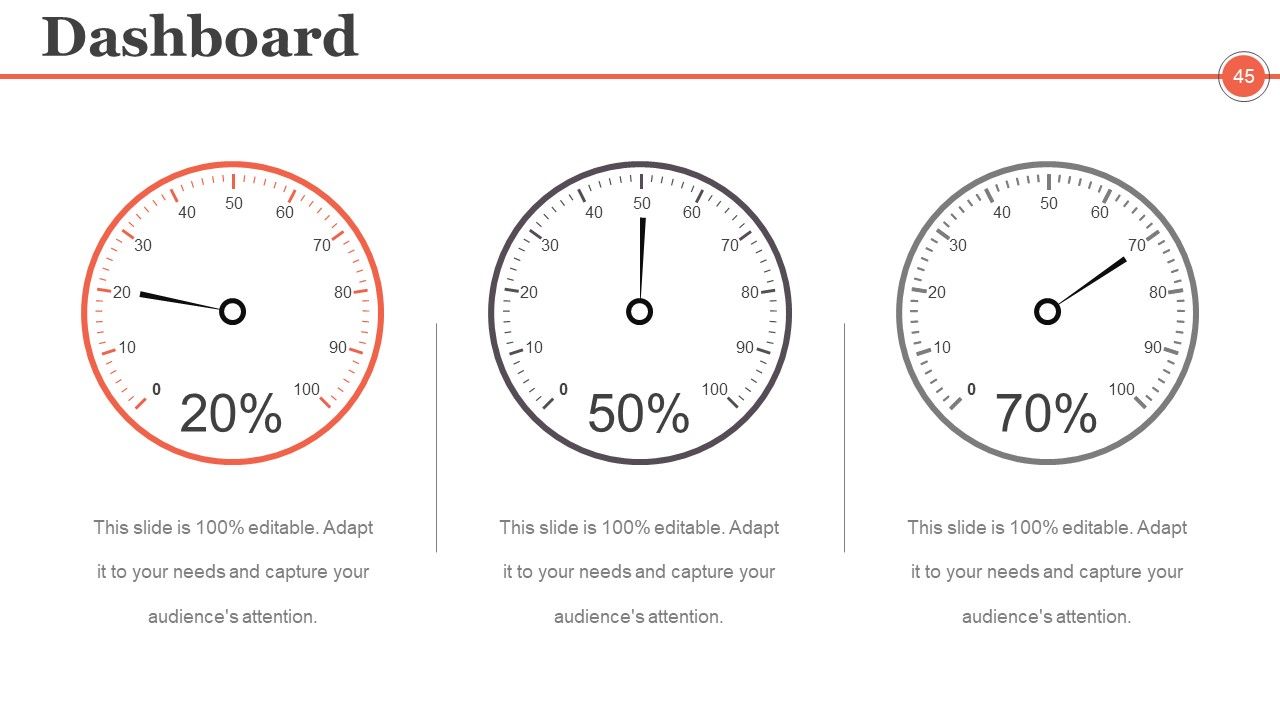
Slide 45: This slide presents Dashboard to present Kpis, metrics etc.
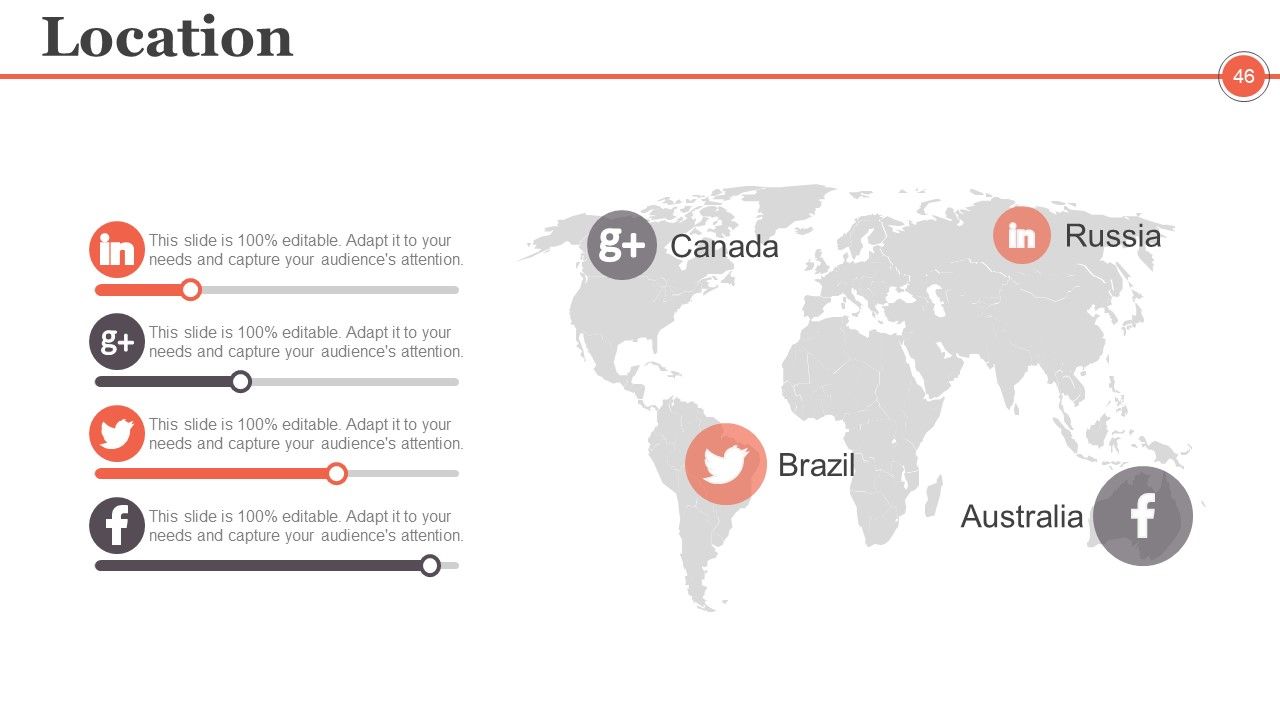
Slide 46: This is a Location slide of world map image to show global presence, growth etc.
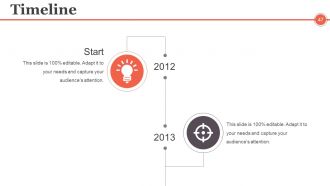
Slide 47: This is a Timeline slide. State milestones, highlights etc. here.
Slide 48: This is a pie chart and gear imagery slide. State specifications, highlights etc. here.
Slide 49: This is a magnifying glass and handshake imagery slide. State specifications, highlights etc. here.
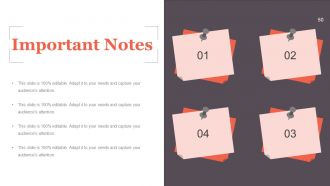
Slide 50: This slide showcases Important Notes. State specifications, highlights, events, etc. here.
Slide 51: This slide showcases Newspaper image slide. State specifications, highlights, events, etc. here. You may change the slide content as per need.
Slide 52: This is a Puzzle image slide. State information, specifications etc. here.
Slide 53: This is a Target image slide. State targets, information, specifications etc. here.
Slide 54: This is a Circular image slide. State information, specifications etc. here.
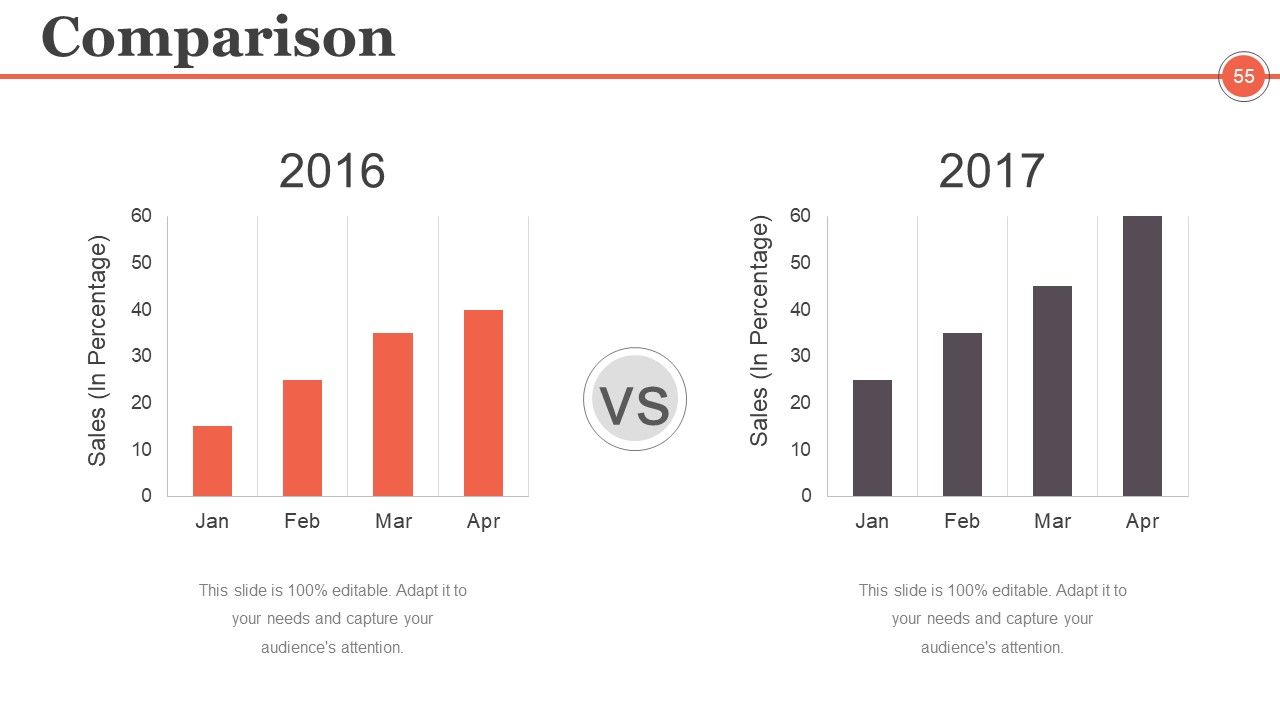
Slide 55: This is a Comparison slide to compare two entities etc. in graph form.
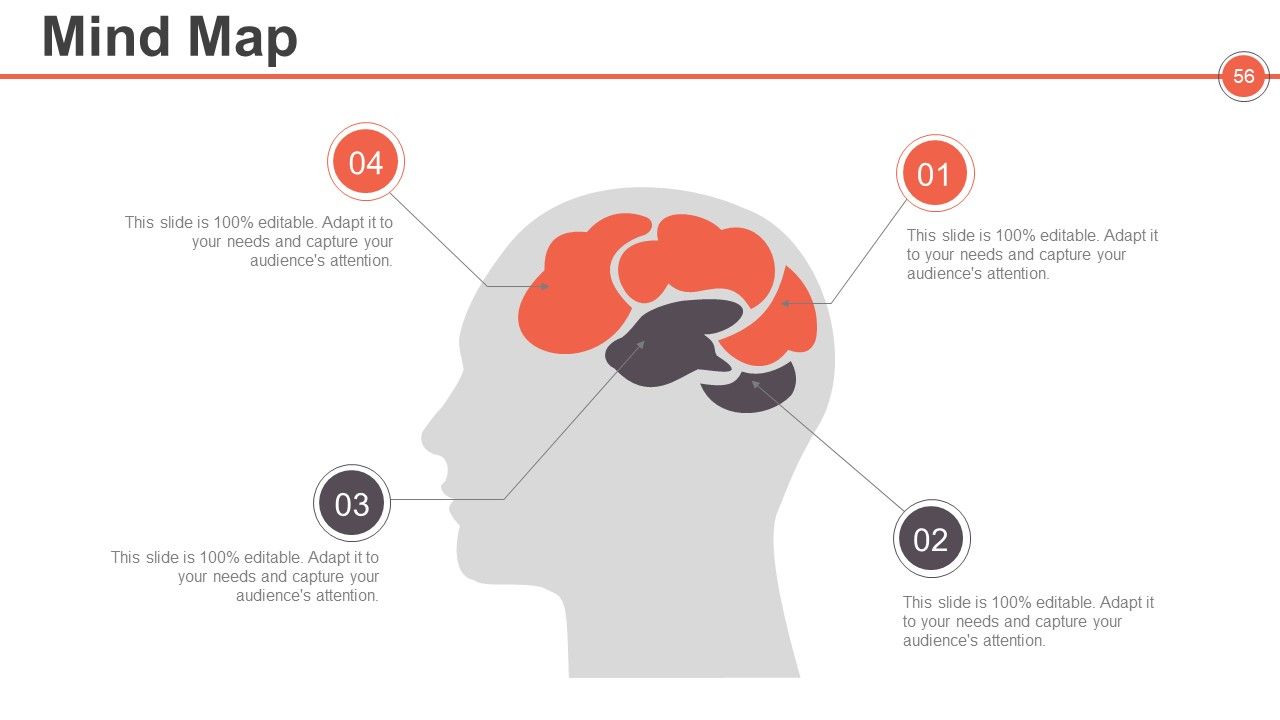
Slide 56: This is a Mind map image slide. State information, specifications etc. here.
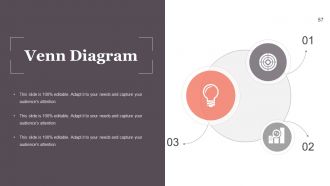
Slide 57: This is a Venn diagram image slide. State information, specifications etc. here.
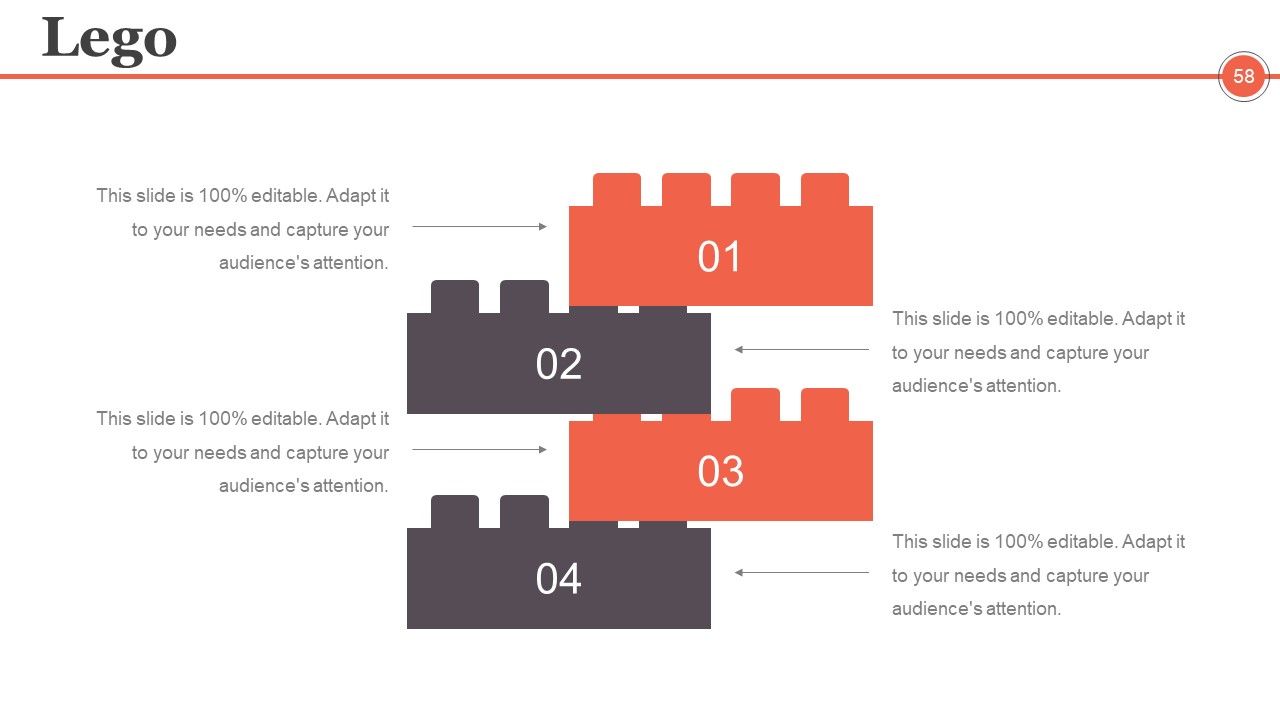
Slide 58: This is a Lego image slide. State information, specifications etc. here.
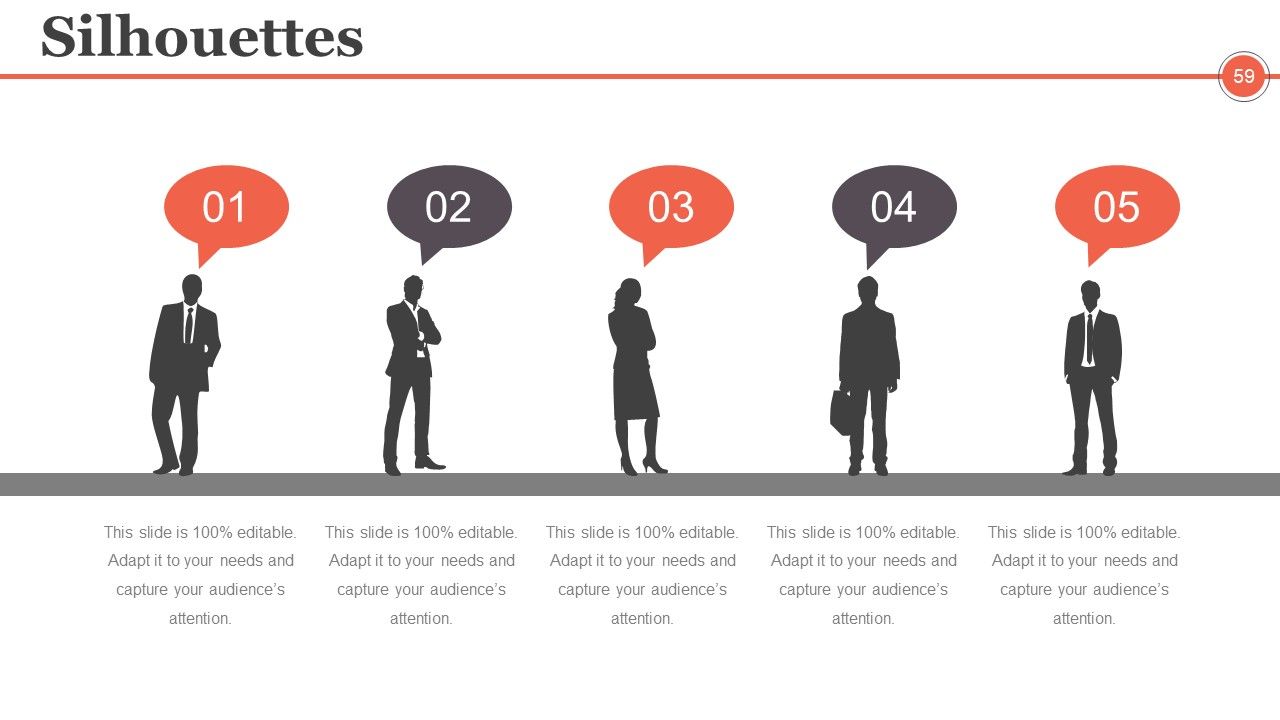
Slide 59: This is a Silhouettes image slide. State people related information, specifications etc. here.
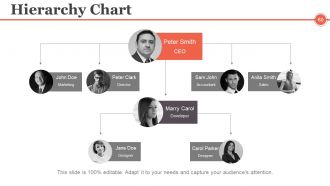
Slide 60: This slide presents a Hierarchy Chart. State management helm, team specifications etc. here.
Slide 61: This is a Generate Idea slide in bulb image. State information, innovative aspects, specifications etc. here
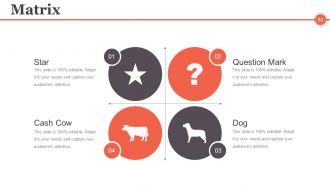
Slide 62: This is a Matrix slide in BCG form. State information, specifications etc. here.
Slide 63: This is a Magnifying Glass image slide. State information, specifications etc. here.
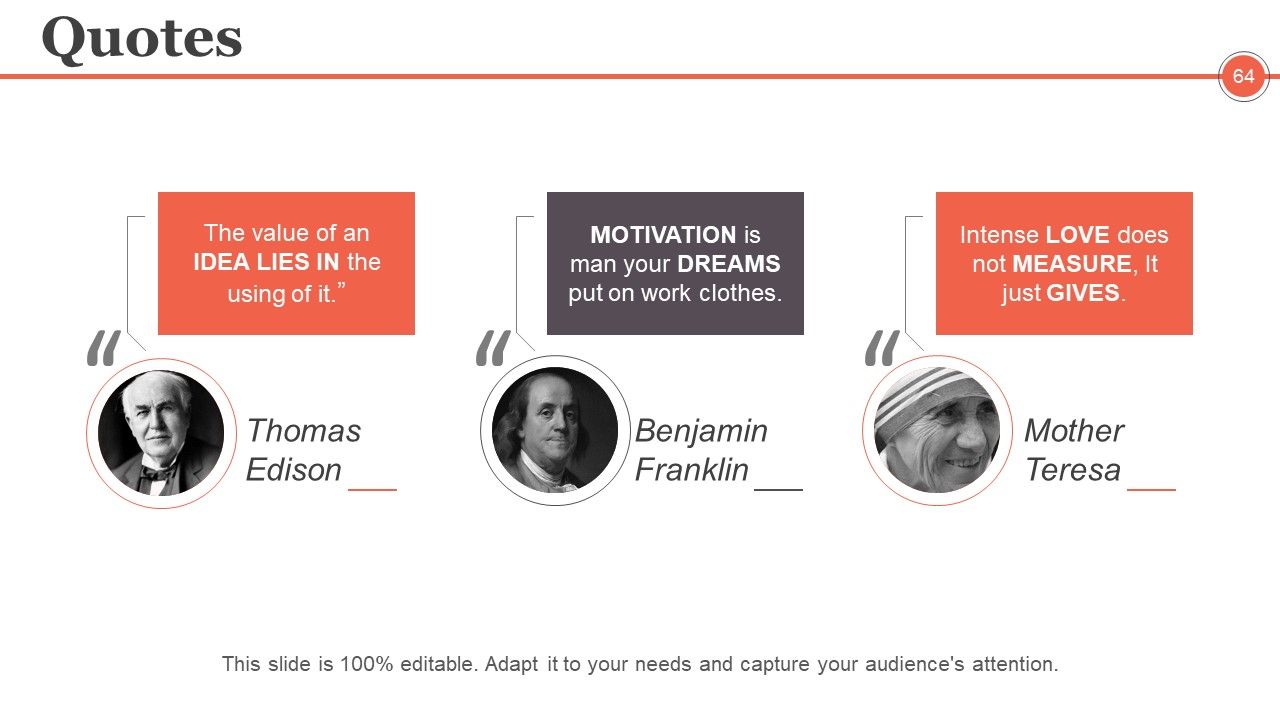
Slide 64: This is a Quotes slide to convey company/organization message, beliefs etc. You may change the slide content as per need.
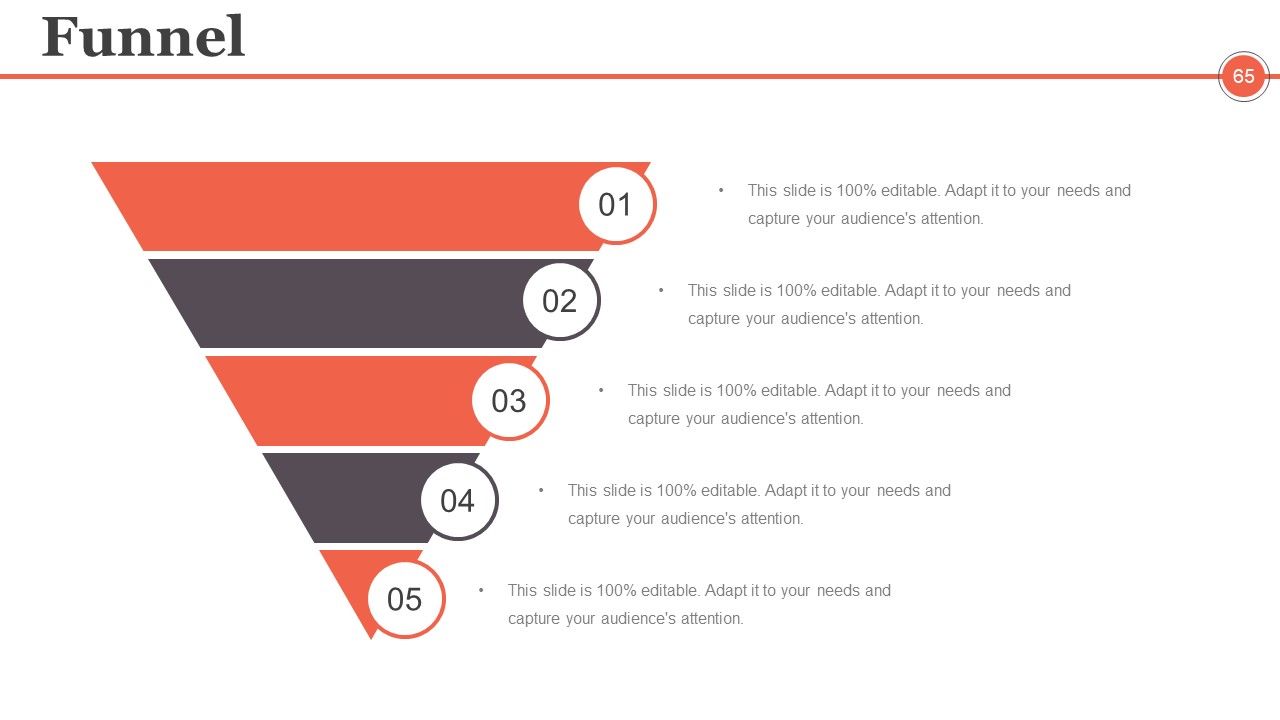
Slide 65: This is a Funnel image slide. State funneling aspects, information, specifications etc. here.
Slide 66: This slide is titled Our Charts to move forward. You can change the slide content as per need.
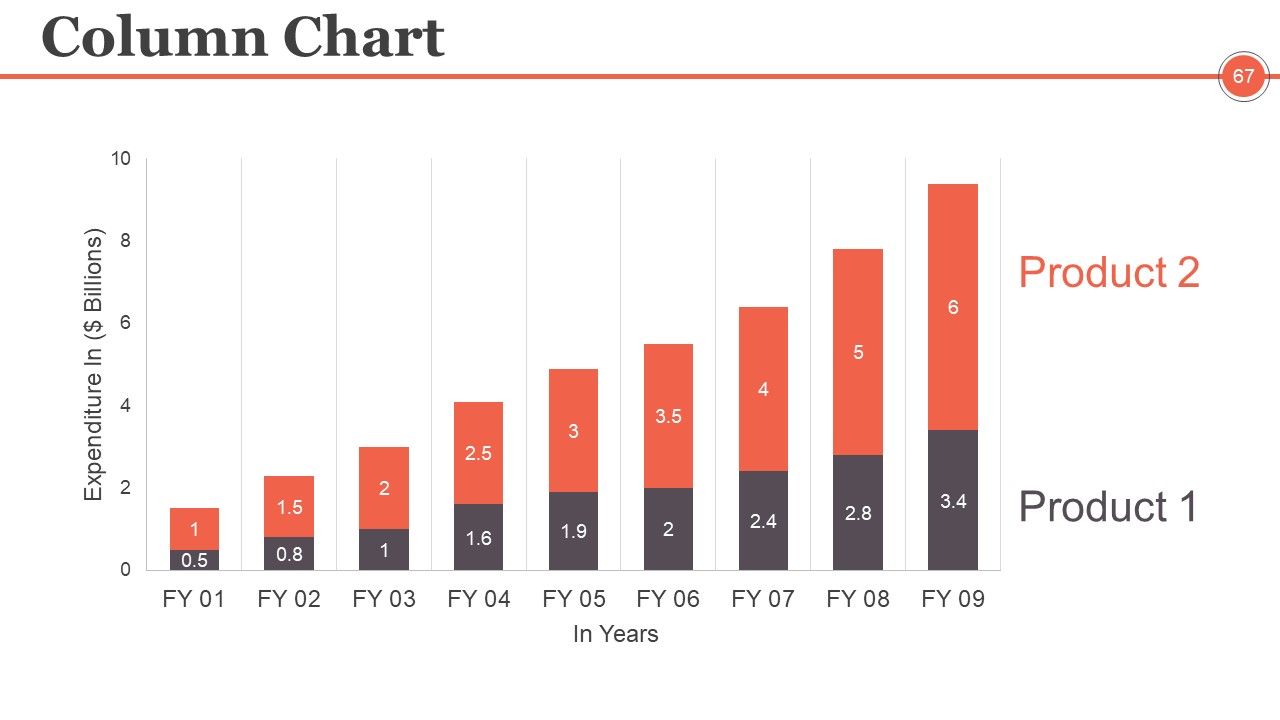
Slide 67: This is a Column Chart slide to show product/entity growth, comparison etc.
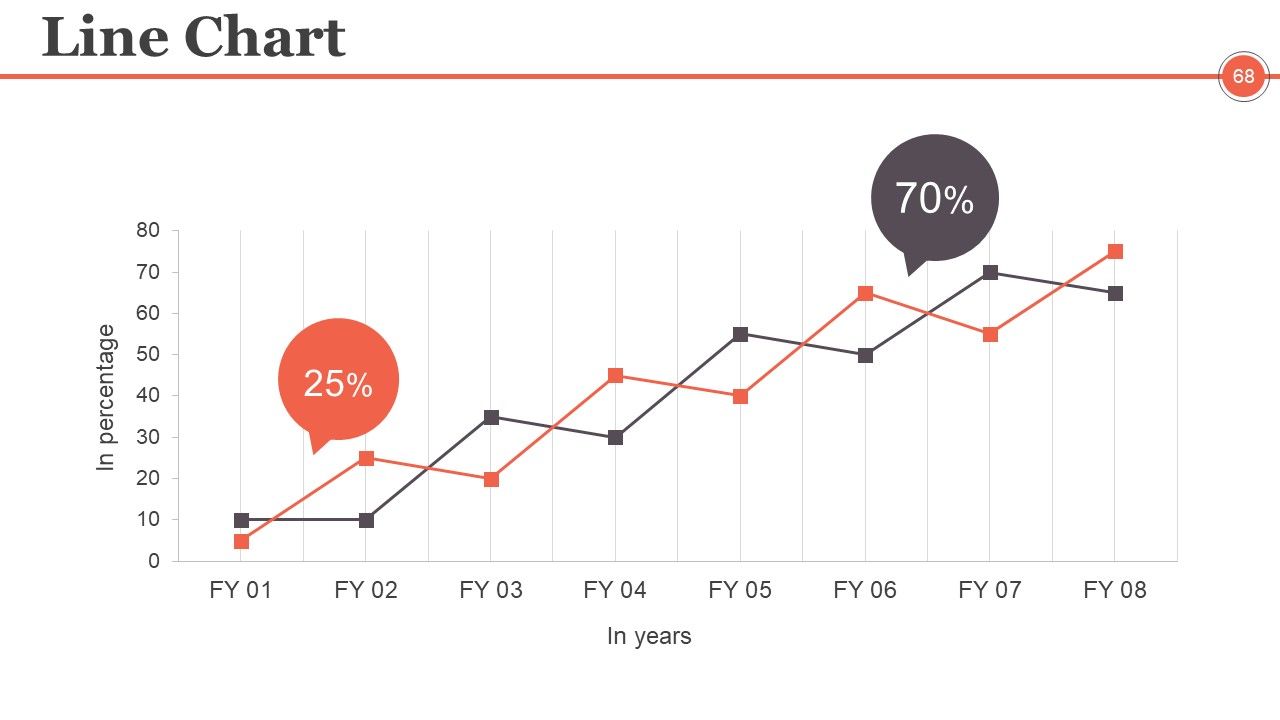
Slide 68: This is a Line Chart slide to show product/entity growth, comparison etc.
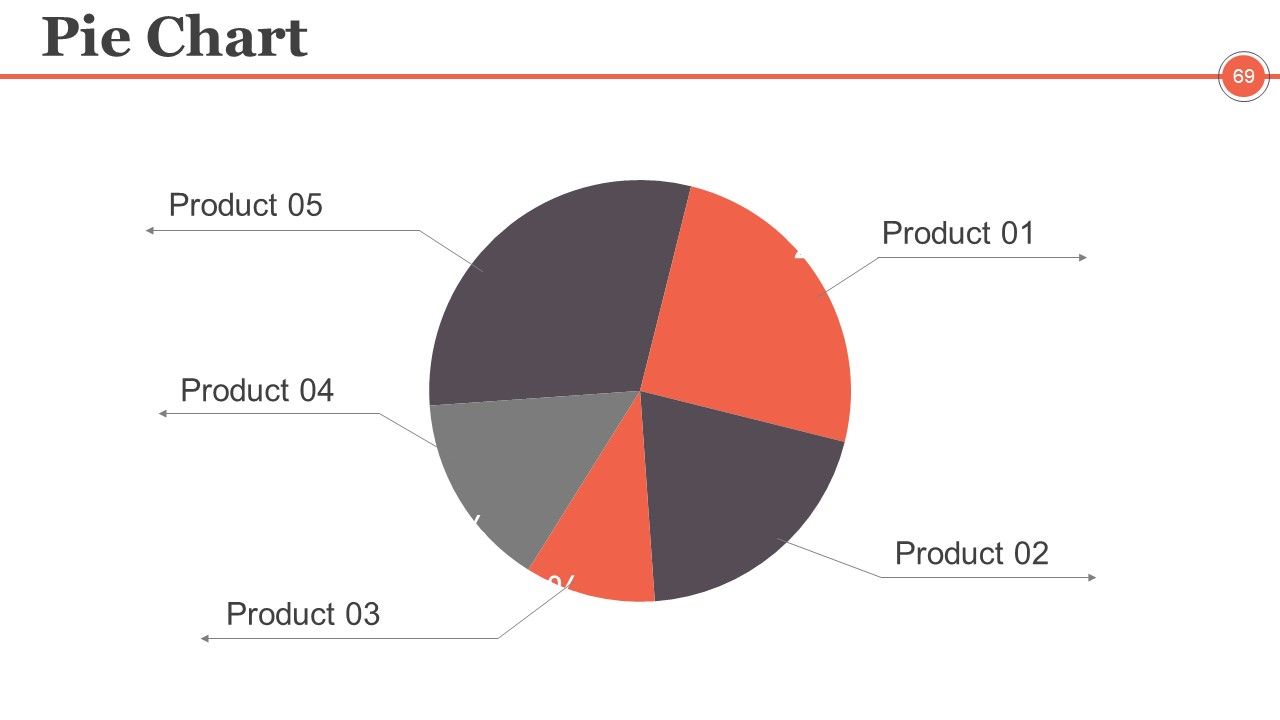
Slide 69: This is a Pie Chart slide to show product/entity growth, comparison etc.
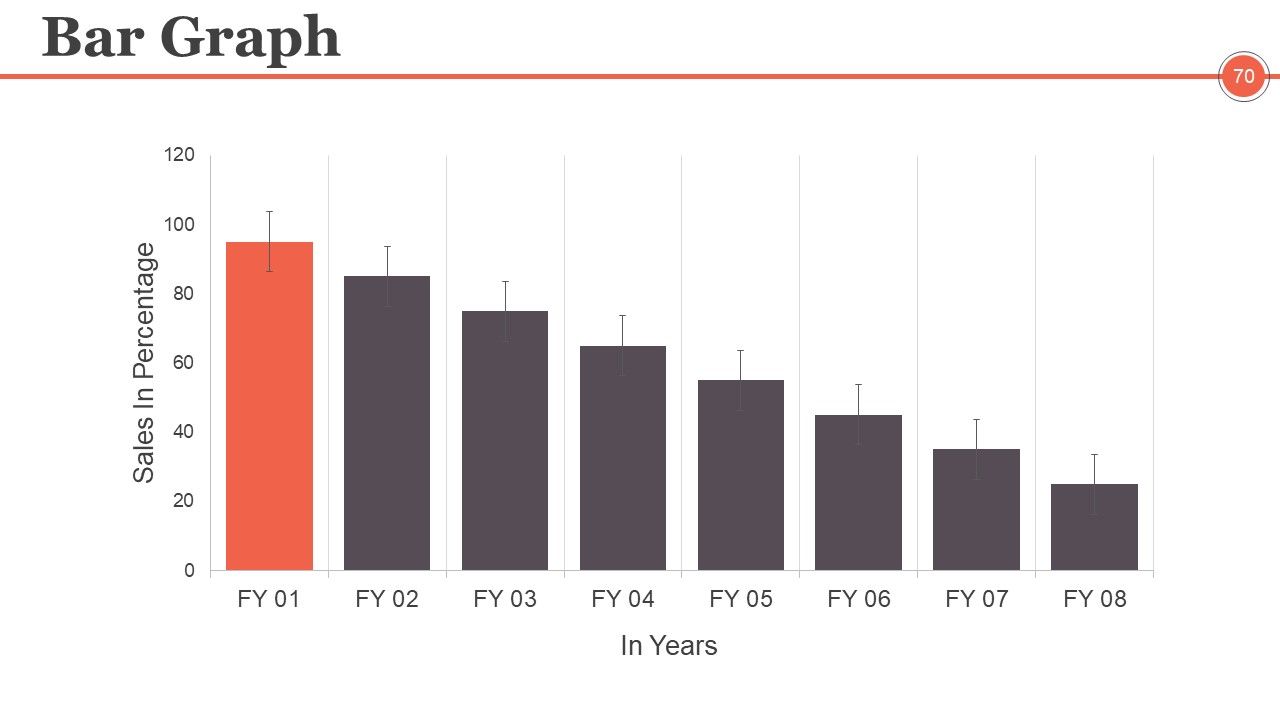
Slide 70: This is a Bar graph Chart slide to show product/entity growth, comparison etc.
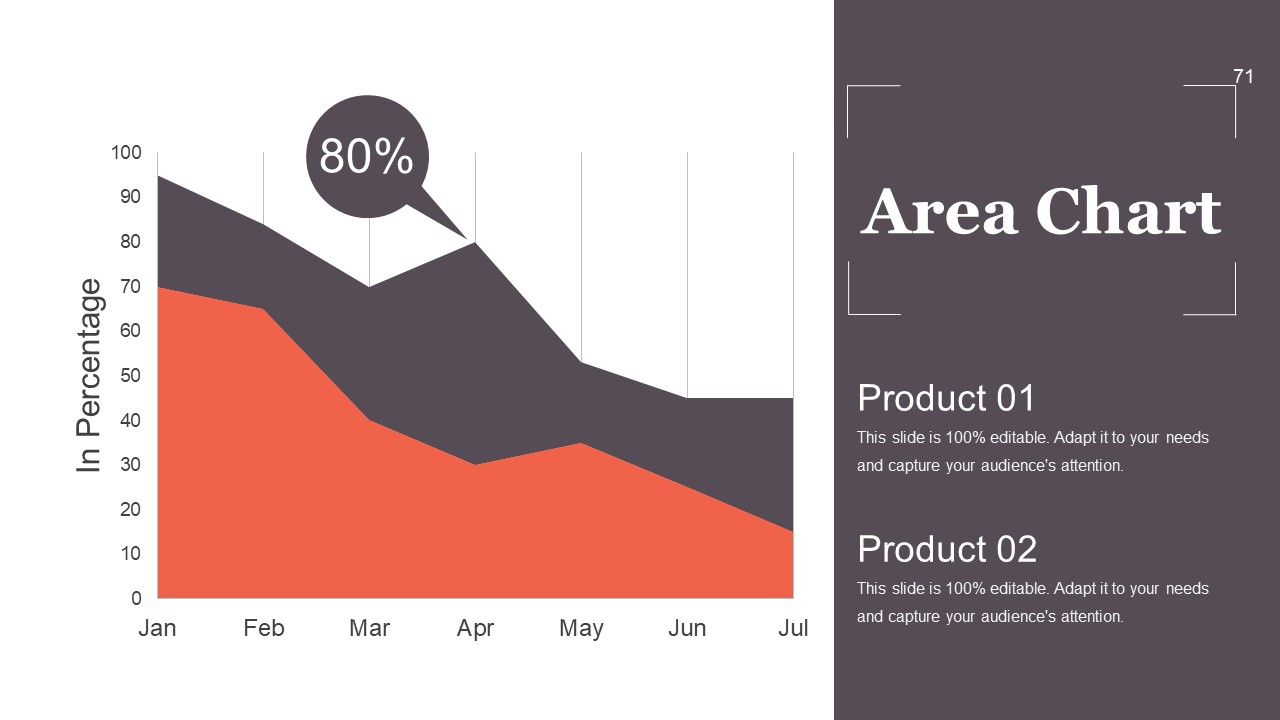
Slide 71: This is an Area Chart slide to show product/entity growth, comparison etc.
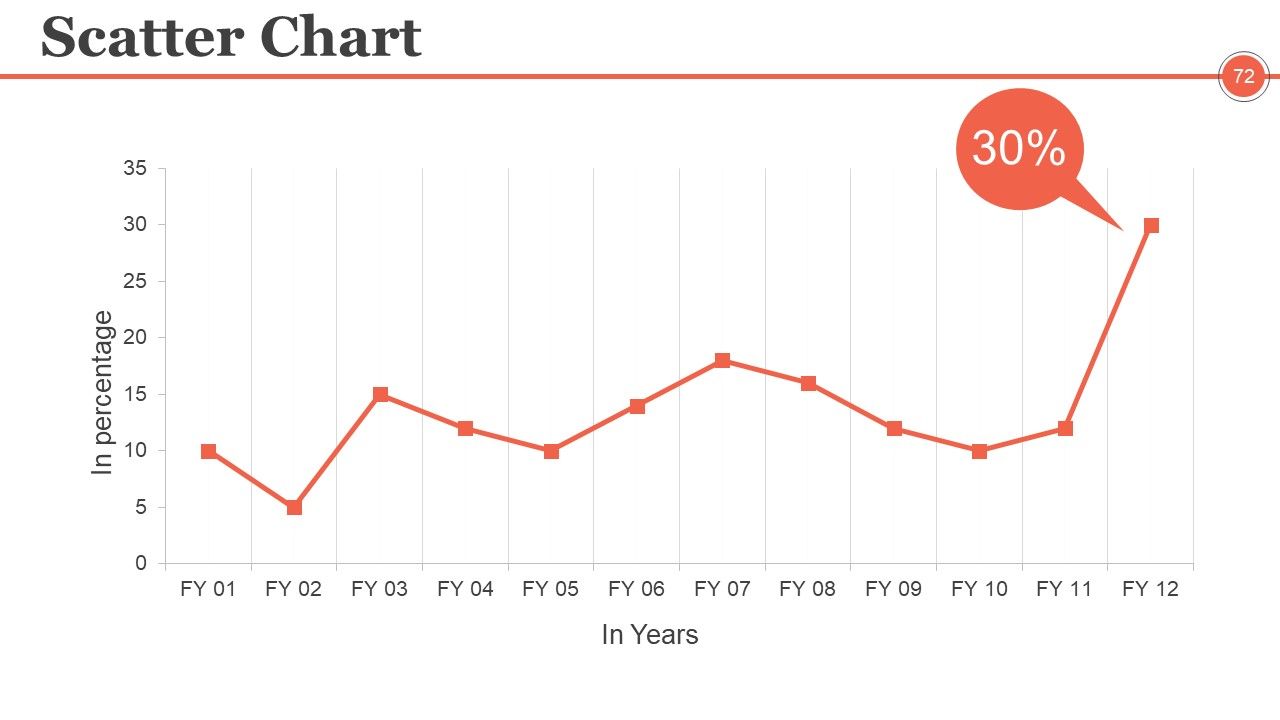
Slide 72: This is a Scatter Chart slide to show product/entity growth, comparison etc.
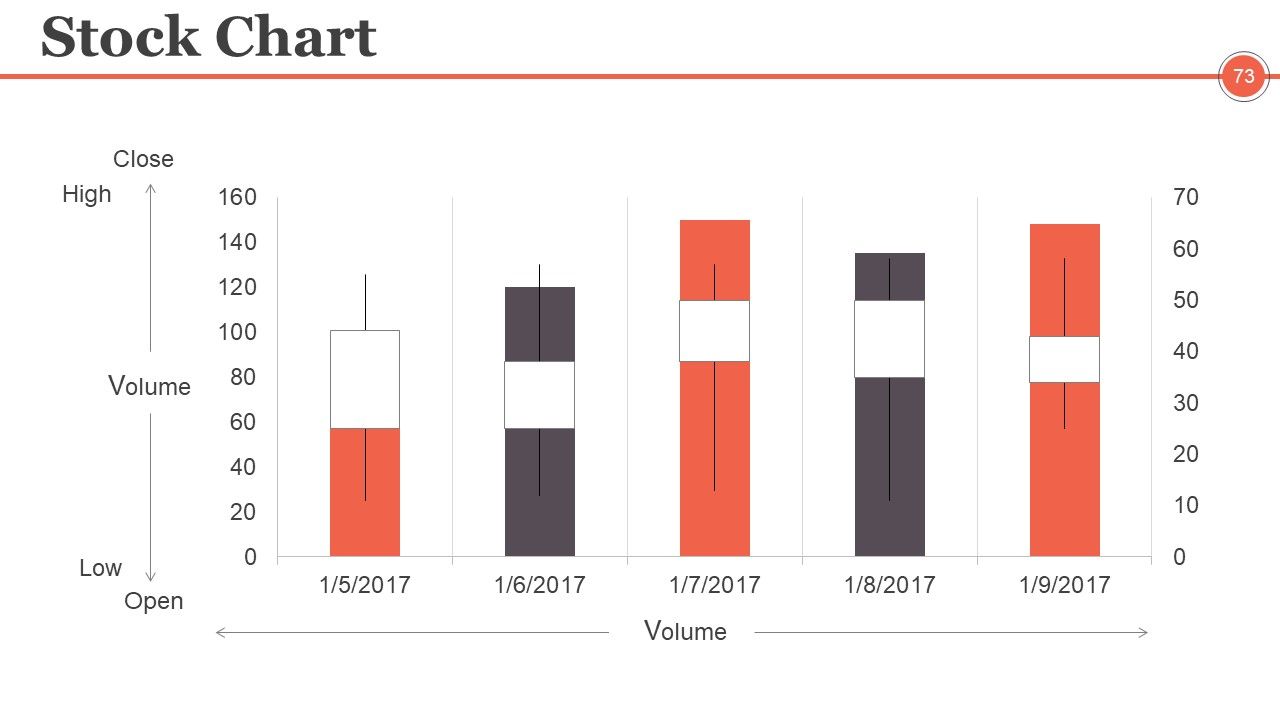
Slide 73: This is a Stock Chart slide to show product/entity growth, comparison etc. in terms of high and low.
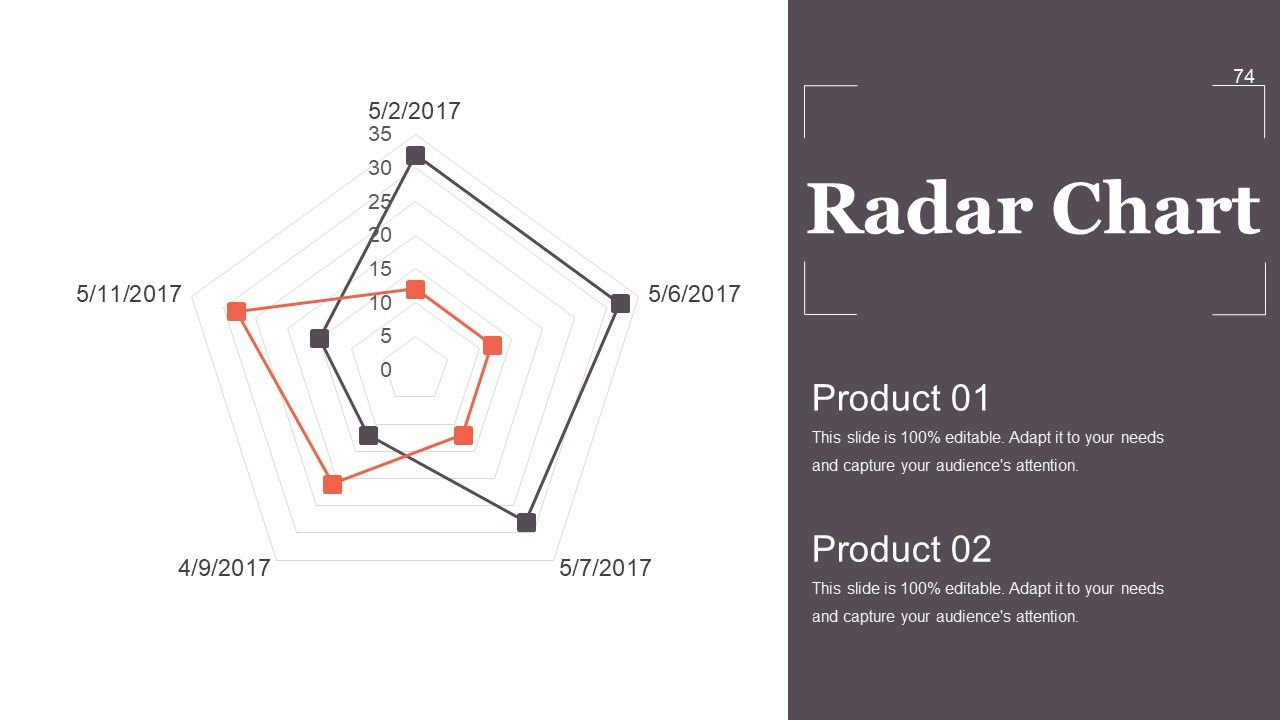
Slide 74: This is a Radar Chart slide to show product/entity growth, comparison etc.
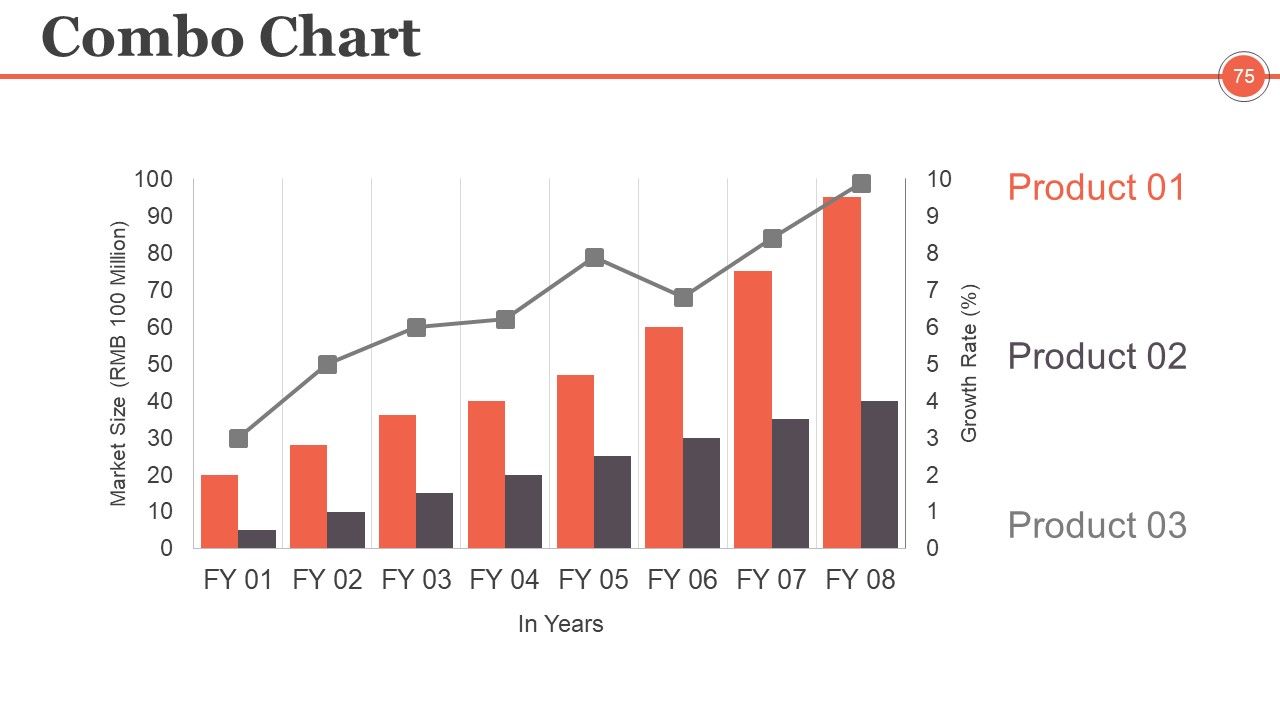
Slide 75: This is a Combo Chart slide to show product/entity growth, comparison etc.
Slide 76: This is a Contact Us slide with Email, Address# street number, city, state and Contact Numbers.
Slide 77: This is a Thank You slide for acknowledgement. You can change the slide content as per need.
Project Management Controlling And Monitoring Powerpoint Presentation Slides with all 77 slides:
Increase your capital with our Project Management Controlling And Monitoring Powerpoint Presentation Slides. Get your bank balance to grow even further.
-
Excellent work done on template design and graphics.
-
Unique and attractive product design.


