Quarterly Comparison Of Real Estate KPIs
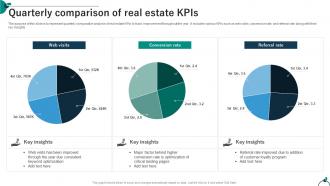
The purpose of this slide is to represent quarterly comparative analysis of real estate KPIs to track improvement throughout the year. It includes various KPIs such as web visits, conversion rate, and referral rate along with their key insights.
You must be logged in to download this presentation.
 Impress your
 audience
Editable
of Time
PowerPoint presentation slides
The purpose of this slide is to represent quarterly comparative analysis of real estate KPIs to track improvement throughout the year. It includes various KPIs such as web visits, conversion rate, and referral rate along with their key insights. Presenting our set of slides with Quarterly Comparison Of Real Estate KPIs. This exhibits information on three stages of the process. This is an easy to edit and innovatively designed PowerPoint template. So download immediately and highlight information on Web Visits, Conversion Rate, Referral Rate.
People who downloaded this PowerPoint presentation also viewed the following :
Quarterly Comparison Of Real Estate KPIs with all 11 slides:
Use our Quarterly Comparison Of Real Estate KPIs to effectively help you save your valuable time. They are readymade to fit into any presentation structure.
-
A big thanks to SlideTeam! An incredible and diverse library of templates helped me with my business project presentation.
-
“I required a slide for a board meeting and was so satisfied with the final result !! So much went into designing the slide and the communication was amazing! Can’t wait to have my next slide!”


