Retail kpi dashboard showing revenue vs units sold ppt slides example file
Build a firm base for your business with our Retail Kpi Dashboard Showing Revenue Vs Units Sold Ppt Slides Example File. You will begin on a good footing.
Build a firm base for your business with our Retail Kpi Dashboard Showing Revenue Vs Units Sold Ppt Slides Example File. Yo..
- Google Slides is a new FREE Presentation software from Google.
- All our content is 100% compatible with Google Slides.
- Just download our designs, and upload them to Google Slides and they will work automatically.
- Amaze your audience with SlideTeam and Google Slides.
-
Want Changes to This PPT Slide? Check out our Presentation Design Services
- WideScreen Aspect ratio is becoming a very popular format. When you download this product, the downloaded ZIP will contain this product in both standard and widescreen format.
-

- Some older products that we have may only be in standard format, but they can easily be converted to widescreen.
- To do this, please open the SlideTeam product in Powerpoint, and go to
- Design ( On the top bar) -> Page Setup -> and select "On-screen Show (16:9)” in the drop down for "Slides Sized for".
- The slide or theme will change to widescreen, and all graphics will adjust automatically. You can similarly convert our content to any other desired screen aspect ratio.
Compatible With Google Slides

Get This In WideScreen
You must be logged in to download this presentation.
PowerPoint presentation slides
Presenting this set of slides with name - Retail Kpi Dashboard Showing Revenue Vs Units Sold Ppt Slides Example File. This is a four stage process. The stages in this process are Business, Management, Strategy, Analysis, Marketing.
People who downloaded this PowerPoint presentation also viewed the following :
Content of this Powerpoint Presentation
Description:
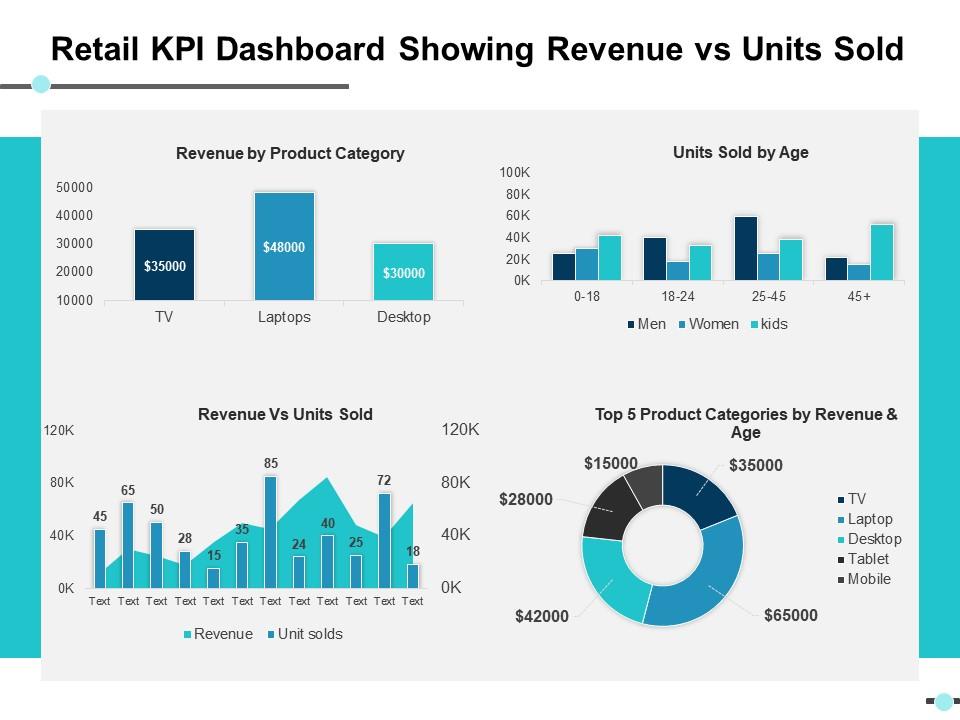
The image shows a "Retail KPI Dashboard" PowerPoint slide that tracks and displays key performance indicators (KPIs) for revenue versus units sold. The dashboard is divided into four main sections:
1. Revenue by Product Category:
Bar graphs show revenue for TV, Laptops, and Desktops with figures like $35,000 for TV, $48,000 for Laptops, and $30,000 for Desktops.
2. Units Sold by Age:
A bar chart categorizes units sold by age groups (0-18, 18-24, 25-45, 45+) and genders (Men, Women, Kids).
3. Revenue Vs Units Sold:
A mixed chart with bars for units sold and line points for revenue, with some placeholder text indicating different time periods or categories.
4. Top 5 Product Categories by Revenue & Age:
A donut chart showing the distribution of revenue among five product categories: TV, Laptop, Desktop, Tablet, and Mobile, with different revenue figures assigned to each.
Use Cases:
This dashboard slide can be effectively used in multiple industries for performance tracking and analysis:
1. Consumer Electronics:
Use: Sales tracking by product and demographics.
Presenter: Sales Manager
Audience: Sales Team, Marketing Analysts
2. E-Commerce:
Use: Overview of online sales performance.
Presenter: E-Commerce Analyst
Audience: Stakeholders, Marketing Team
3. Retail Chain Stores:
Use: Performance benchmarking across store locations.
Presenter: Regional Manager
Audience: Store Managers, Executives
4. Apparel Retailers:
Use: Tracking sales by product lines and customer segments.
Presenter: Merchandising Officer
Audience: Department Heads, Buyers
5. Telecommunications:
Use: Monitoring sales of devices and plans by age group.
Presenter: Product Development Manager
Audience: Marketing and Sales Departments
6. Home Appliances:
Use: Analyzing revenue and units sold across product ranges.
Presenter: Chief Financial Officer
Audience: Investors, Management Team
7. Automotive Dealerships:
Use: Understanding sales trends for different vehicle categories.
Presenter: Dealer Principal
Audience: Sales Consultants, Marketing Staff
Retail kpi dashboard showing revenue vs units sold ppt slides example file with all 5 slides:
Get your engine firing on all cylinders with our Retail Kpi Dashboard Showing Revenue Vs Units Sold Ppt Slides Example File. Your career will go fast forward.
No Reviews


