


Risk And Return In Financial Management Powerpoint Presentation Slides


Try Before you Buy Download Free Sample Product
 Impress Your
 Audience
Editable
of Time


Analyze investment risk and profitability with this professionally designed Risk and Return in Financial Management PowerPoint Presentation Slides. The content ready portfolio risk-return trade-off PowerPoint compete deck comprises of PPT slides such as risk and return of stock bonds, and T-bills, investment strategies of predefined portfolios, risk and return of portfolio manager, measuring stock volatility proportionate, portfolio return analysis, calculating asset beta, portfolio value at risk, ranking the passive income streams impact to name a few. Explain the relationship between risk on investing in the financial market with potential return using portfolio risk analysis PPT slides. Utilize the visually appealing risk-reward relationship presentation design to structure your financial presentation. Furthermore, portfolio risk-return in security analysis PPT visuals are completely customizable. You can add or delete the content if needed. Download this visually appealing security analysis and portfolio management presentation deck to manage investment risk. Our Risk And Return In Financial Management Powerpoint Presentation Slides ensure you feel joyous. You will find the inspiration you desire.
People who downloaded this PowerPoint presentation also viewed the following :
Content of this Powerpoint Presentation
Slide 1: This slide introduces Risk and Return in Financial Management. State Your Company Name and begin.
Slide 2: This slide shows Content of the presentation.
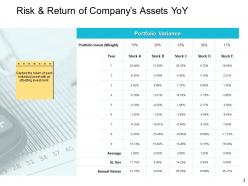
Slide 3: This slide presents Risk & Return of Company’s Assets YoY capturing the return of each individual asset with an offsetting investment.
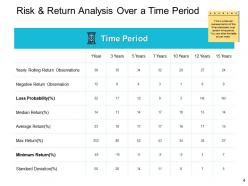
Slide 4: This slide displays Risk & Return Analysis Over a Time Period in a tabular form to represent financial assets over certain time period.
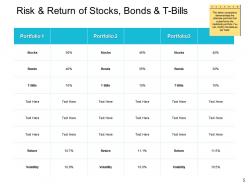
Slide 5: This slide represents Risk & Return of Stocks, Bonds & T-Bills, comparing the alternate portfolio that outperforms the traditional portfolio.You can modify the table as per need.
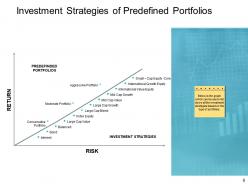
Slide 6: This slide showcases Investment Strategies of Predefined Portfolios in a graphical form to list down all the investment strategies based on the type of portfolios.
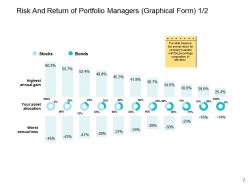
Slide 7: This slide shows Risk and Return of Portfolio Managers to measure the annual return for company’s assets with the percentage composition of allocation.
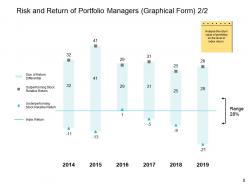
Slide 8: This is another slide presenting Risk and Return of Portfolio Managers.
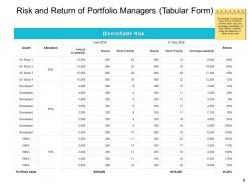
Slide 9: This slide displays Risk and Return of Portfolio Managers in a tabular form to track the record of fund investment with the return value and percentage composition of stock holding in portfolio.
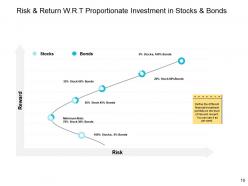
Slide 10: This slide represents Risk & Return W.R.T Proportionate Investment in Stocks & Bonds.
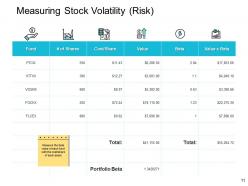
Slide 11: This slide is titled as Measuring Stock Volatility with categories as Funds, No. of Shares, Cost/Share, Value, Beta, Value x Beta.
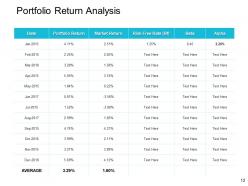
Slide 12: This slide showcases Portfolio Return Analysis to measure the average portfolio return and Avg. market return with the value of alpha and beta, given the level of risk undertaken in portfolio.
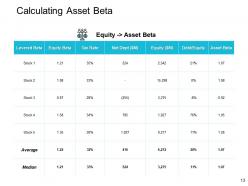
Slide 13: The slide provide the composite measure of portfolio’s performance that also include average and median value. You can modify the table as per need.
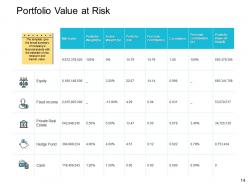
Slide 14: This slide shows Portfolio Value at Risk to give the broad summary of company’s financial assets with the estimate of risk measure and market value.
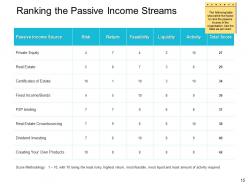
Slide 15: This slide presents Ranking the Passive Income Streams in a tabular form describing the five factors to rank the passive income of the organisation.
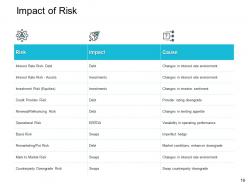
Slide 16: This slide displays Impact of Risk showing risk, impact and cause.
Slide 17: This slide showcases Risk and Return in Financial Management Icons.
Slide 18: This slide is titled as Additional Slides for moving forward.
Slide 19: This is Our Mission slide with related imagery and text boxes.
Slide 20: This is About Us slide to show company specifications etc.
Slide 21: This is Our Team slide with names and designation.
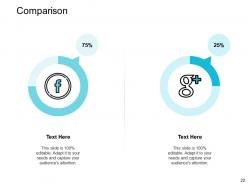
Slide 22: This is a Comparison slide to state comparison between commodities, entities etc.
Slide 23: This is a Financial slide. Show your finance related stuff here.
Slide 24: This is a Bulb or idea slide to state a new idea or highlight information, specifications etc.
Slide 25: This slide is titled as Post it. Post your important notes here.
Slide 26: This is a Quotes slide to convey message, beliefs etc.
Slide 27: This slide shows Mind Map for representing entities.
Slide 28: This is Thank you slide with address, contact numbers and email address.
Risk And Return In Financial Management Powerpoint Presentation Slides with all 28 slides:
Eliminate fears of any harm with our Risk And Return In Financial Management Powerpoint Presentation Slides. Address feelings of insecurity.


FAQs for Risk And Return In Financial Management
So basically, you can't get around the whole risk-reward thing - want bigger gains? Gotta accept bigger potential losses. Your money today is worth more than the same amount later because of inflation and all that. Diversifying helps though, spreads the risk around without killing your returns. I learned this the hard way with some sketchy crypto investments last year lol. But yeah, when you're picking investments, just think about what kind of loss would actually keep you up at night. Don't go beyond that point.
Different investments need totally different risk approaches, honestly. Stocks are all over the place - market swings, company drama, sector stuff. They can tank or moon in a day. Bonds are way more chill but you've still got credit issues and interest rate changes to worry about. Real estate's tricky because location matters so much, plus good luck selling quickly if you need cash fast. I learned that one the hard way! Bottom line - match your timeline to what you're buying. Don't throw next year's vacation money into some volatile growth stock.
Yeah, diversification definitely helps reduce risk by spreading your money across different stuff - various sectors, countries, asset types. When one thing tanks, hopefully another stays steady or even goes up. Honestly though, it's not a magic shield. During big crashes like 2008, almost everything gets hammered together no matter how spread out you are. That's systematic risk kicking in. Diversification mainly protects against company-specific problems. So definitely do it, but also keep some cash on the side and maybe look into things that actually move opposite to stocks.
So CAPM is pretty straightforward - your expected return equals the risk-free rate plus beta times the market risk premium. Beta's what matters most here. It shows how much your stock bounces around compared to the overall market. Like if beta is 1.5, your stock moves 50% more than the market does. Tech stocks usually have crazy high betas, which makes sense if you think about it. Basically you can't get higher returns without taking on more systematic risk. I use this formula all the time to check if an investment's potential return is actually worth the risk you're taking.
Look, volatility is basically how much your investments bounce around - bigger swings mean more risk but also better chances for solid returns. Think rollercoaster vs smooth car ride. When prices jump all over the place, you honestly can't predict what you'll have next week or next year. That uncertainty freaks some people out, but volatility isn't evil or anything. You just gotta match it with how much risk you're cool with and when you actually need the money. I learned this the hard way during my first big market dip - timing matters way more than I thought.
Grab at least 5-10 years of historical data and crunch the numbers - average returns, standard deviation, how different assets move together. Recent stuff might matter more than ancient history, but you need enough data points to actually trust your calculations. Yeah, I know everyone rolls their eyes at "past performance doesn't predict future results," but honestly it's the best starting point we've got. What's really useful is seeing how your assets acted during crashes, booms, weird market periods. Once you've got your baseline, throw some different scenarios at it. See what breaks.
Your brain plays tricks on you when investing. Loss aversion hits hard - losing $100 feels way worse than gaining $100 feels good, so you'll skip decent opportunities to avoid potential losses. Then there's overconfidence, where you think you can totally nail market timing (spoiler: you probably can't). Recent events seem more important than they are - bull markets make everything look safe when it's not. Crashes stick in your memory too, making you overly paranoid about rare events. Honestly, the best fix is making investment rules beforehand when you're thinking clearly, not when emotions are running high.
Look, geopolitical stuff like Brexit or trade wars can really mess with your risk models. Historical data becomes way less useful when currencies are jumping around and trade routes get disrupted. I'd start stress-testing portfolios more often - maybe quarterly instead of annually? Scenario planning beats relying on your standard forecasts right now. Currency hedging is huge if you've got international positions. Honestly, the whole "set it and forget it" approach doesn't work anymore. Make geopolitical risk part of your regular check-ins rather than something you think about once a year when things blow up.
So the efficient frontier is this curved line that shows the sweet spot between risk and return. Basically, you plot return on the y-axis and risk on the x-axis. The curve goes up because you can't get higher returns without more risk - wish it worked differently but it doesn't. Anything below that line? You're leaving money on the table since you could do better with the same risk level. The cool part is you don't need to pick individual "winner" stocks. Smart diversification gets you there. Just find where you sit on the curve based on how much risk makes you sleep well at night.
So there's three main ones - Sharpe, Sortino, and Treynor ratios. Sharpe's the go-to since everyone uses it. Basically measures your extra returns vs how volatile things get. Higher numbers = better. Sortino's kinda similar but way smarter honestly - it only cares about bad volatility, not the good stuff. Like why would upside moves be "risky" anyway? Treynor's different, uses beta instead of total volatility so you're looking at systematic risk. I'd start with Sharpe since that's what most people expect to see, then maybe check out Sortino if you want something that actually makes sense.
So basically, inflation eats away at what your money can actually buy, even when your investments look like they're doing okay on paper. Higher interest rates? They make boring stuff like bonds way more appealing, so money flows out of stocks. Companies also get hit with higher borrowing costs, which can mess with their profits. It's honestly kind of annoying how it all works against you. The real trick is looking at inflation-adjusted returns instead of just the flashy numbers - that'll show you what you're actually making.
Honestly, I think it's worth checking if your investments match what you actually believe in. Like, are you accidentally funding weapons companies or places that trash the environment? ESG screening is pretty mainstream now - there's a reason for that. Sure, you might miss out on some returns occasionally, but do you really want your money supporting exploitative labor practices? I mean, higher profits shouldn't come at the expense of workers or communities getting screwed over. Maybe start small with some ESG filters and see how it feels.
So basically, we're all pretty irrational when it comes to money - behavioral finance proves it. Loss aversion is huge - losing $100 feels way worse than winning $100 feels good. Then there's overconfidence, where people think they can beat the market (spoiler: most can't). During bubbles everyone piles in together, then panic sells when things crash. I learned this the hard way in 2020 honestly. The key is recognizing when your emotions are driving decisions instead of logic. Once you know your brain's working against you, it's easier to stick to actual strategy.
So systemic risk is when the whole market tanks together - like 2008 or when COVID hit. Your diversification? Totally useless because everything crashes at once. Normally stocks and bonds don't move together, but during these events they're suddenly best friends heading straight down. You can't really hedge against this stuff like you can with individual company problems. It's honestly pretty brutal when it happens. That's why I always tell people to keep some cash sitting around and maybe hold some defensive stocks. Won't save you completely, but it helps when everything goes sideways.
Honestly, tech has been a game changer for risk management but it's kinda a double-edged sword. You can run algorithmic trading that executes strategies in milliseconds - auto-rebalancing, stop-losses, all that stuff way faster than we could ever do manually. Flash crashes though? System glitches? Those are new headaches we didn't have before. Sometimes I wonder if we're moving too fast for our own good. My take - use the tech for sure, but don't go full autopilot. Set up circuit breakers and keep manual overrides handy. Never trust algorithms to run completely on their own.
No Reviews