

Sales Rep Performance Measuring Dashboard Marketing Planning And Segmentation Strategy





Try Before you Buy Download Free Sample Product
 Impress Your
Audience
 100%
Editable
 Save Hours
of Time


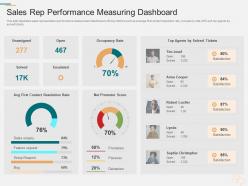
This slide illustrates sales representative performance measurement dashboard with key metrics such as average first contact resolution rate, occupancy rate, NPS and top agents by solved tickets.
People who downloaded this PowerPoint presentation also viewed the following :
Sales Rep Performance Measuring Dashboard Marketing Planning And Segmentation Strategy with all 2 slides:
Use our Sales Rep Performance Measuring Dashboard Marketing Planning And Segmentation Strategy to effectively help you save your valuable time. They are readymade to fit into any presentation structure.

FAQs for Sales Rep Performance Measuring Dashboard Marketing Planning
Start with revenue stuff - total sales, pipeline value, conversion rates by stage. Activity metrics matter too: calls, emails, meetings booked. Those actually drive the revenue numbers. Win/loss ratios and average deal size are huge - seriously, most dashboards I've seen totally ignore these and it's such a missed opportunity. Quota attainment and forecasting accuracy help you catch trends before they bite you. Oh, and keep it under 8-10 metrics max. Any more than that and nobody'll actually look at the thing.
Yeah, dashboards should totally match what each team actually does day-to-day. Inside sales cares about call volume and conversion rates. Field sales? Territory maps and travel stuff - plus those longer deals they're nursing along. Enterprise is a whole different beast - they want account health and relationship mapping since they're playing the long game. Time frames matter too. Some teams check numbers daily, others think monthly or quarterly. Honestly, just ask each team what decisions they're making every day and build around that. Generic revenue dashboards are pretty useless for most people.
Honestly, real-time data is a game changer for sales dashboards. You're not stuck looking at last week's numbers wondering what went wrong. Spot trends as they happen and actually fix problems before they get worse. See which reps need help today, track deals that are stalling, get the real picture of your pipeline. I swear, there's nothing worse than finding out about issues when it's already too late. Set up alerts for whatever metrics matter most to your team - that's where the magic happens. Way better than playing catch-up all the time.
Dude, visuals are a game changer for sales data. Your brain just clicks with charts way faster than staring at endless spreadsheet rows. I can spot trends and weird outliers instantly now - stuff that used to take me forever to dig up. Heat maps work great for territory stuff, line charts show your momentum, bar charts make quota comparisons super obvious. Honestly? I used to dread our weekly reports until we got better at this. The trick is matching the right chart to what you're actually trying to show. Now my team makes decisions based on real data instead of just winging it.
Honestly, I'd go with Power BI first - it's cheap and works great if you're already using Microsoft stuff. Tableau looks way better but costs more, so depends on your budget I guess. The big three are those two plus Salesforce Analytics Cloud. Google Data Studio could work for basic stuff, and yeah technically you could use Excel but trust me, that gets ugly real fast with actual sales numbers. My boss tried that once and... yikes. Start with Power BI's free version, see how it feels. If you need fancier visuals later, then maybe try Tableau's trial.
Honestly, daily minimum but real-time if you can swing it. Sales numbers get stale super quick - like yesterday's data is basically useless when you're scrambling to hit monthly goals. Most teams I know do automatic updates every few hours. Works pretty well and doesn't crash your system. Weekly? Way too slow unless you're only watching long-term stuff. Match it to how fast your sales cycle moves and how quickly your team pivots. Oh, and definitely automate it - nobody wants to be that person refreshing Excel every morning at 8am.
Oh man, data integration is gonna be your worst enemy. Sales teams are juggling like five different tools and none of them talk to each other properly. Getting people to actually USE the thing you build? Way harder than it sounds. Also your data's probably messier than you think - took me forever to realize how much time I was wasting on that part. Honestly just pick one metric everyone already obsesses over, nail that first, then build from there. Don't try to boil the ocean right away or you'll burn out fast.
Dude, sales dashboards are game-changers. Instead of guessing what's working, you'll see exactly which products are hot and which reps are struggling. Problems get caught early rather than during those painful monthly meetings when everything's already gone sideways. It's honestly like getting superpowers for your business decisions. Your pipeline issues become obvious immediately. I'd focus on your three biggest headaches first - whatever keeps you up at night - then build the dashboard around surfacing that stuff. Way better than flying blind and hoping for the best.
Put your most important KPIs right at the top - trust me on this one. Color coding works great for showing what needs immediate attention, but don't go crazy with it. Your sales team's probably checking this stuff on their phones constantly, so mobile design matters way more than you'd think. Ask the actual users what numbers they look at every single day first, then build everything around that. Auto-refresh the data so nobody's wondering if they're staring at yesterday's numbers. Keep formatting consistent across charts, and honestly? Simple beats fancy every time - information overload will kill adoption faster than anything else.
Honestly, the math is pretty simple once you set it up right. Compare your metrics before and after - deal closure rates, how long sales cycles take, revenue per rep. That's where you'll see the biggest jumps. Your baseline investment is just the dashboard cost plus setup time. Most teams I know hit 15-25% efficiency gains in about 6 months, which... yeah, that makes the ROI calculation super clear. Time savings matter too though - reps stop wasting hours digging through data and actually sell more. Just make sure you're tracking from day one or you'll be kicking yourself later trying to reconstruct the "before" numbers.
Honestly, your sales dashboard is a lifesaver for catching issues before they become disasters. I check mine weekly to see how predictions stack up against reality - saves me from those brutal month-end panic sessions. You'll start noticing patterns pretty quick, like which products are tanking or if someone on your team needs backup. The best part? You can tweak your forecasts as you go instead of flying blind. Oh, and don't get too attached to your original numbers - I learned that the hard way. Data doesn't lie, even when you want it to.
Dude, your dashboard probably just shows numbers without the why behind them. Customer feedback changes that completely - you'll see patterns like what makes deals stall or which pain points your best reps handle. Most people totally ignore this stuff! Overlay that feedback with your sales data and boom, you can spot which complaints kill deals and what satisfaction scores actually mean for renewals. Way better than just tracking random metrics that don't matter. Oh, and start simple - just throw a customer sentiment widget next to your conversion rates.
Start with automated checks that catch outliers and missing data before stuff hits your dashboard. Someone should manually audit the numbers regularly too - I've seen way too many dashboards showing ridiculous 100% conversion rates that were clearly broken. Pull from clean sources and document how you're calculating things so everyone knows what's up. Train your team to actually question weird numbers instead of just going "looks good!" The worst data disasters happen when people stop thinking critically about what they're seeing.
Look, dashboards are game-changers because they turn your hunches into hard data. You'll catch patterns you'd miss otherwise - like which products crush it in the Northeast or when your team always hits a wall (usually Q3, right?). The cool part is pivoting fast when something's not working. Maybe you need to shift budget or reassign territories based on what you're seeing. Instead of wondering why sales tanked, you'll actually know what happened and can fix it. Honestly, just pick your top 3 metrics first and let those drive your decisions.
Don't overload your dashboard with a million charts - nobody wants to decode 20 different metrics just to figure out what's happening. Focus on what your sales team actually uses to make decisions. Vanity metrics are the worst offenders here (looking at you, total leads count when conversion rates tell the real story). Keep your data fresh too - stale numbers from weeks ago will make people stop trusting the whole thing. Honestly, start simple with maybe 3-5 revenue-focused metrics. You can always add more once you see what they're actually clicking on.
-
Excellent Designs.
-
Good research work and creative work done on every template.
-
It saves your time and decrease your efforts in half.
-
Presentation Design is very nice, good work with the content as well.