Stock Market Dashboard Indicating Candlestick Time Series
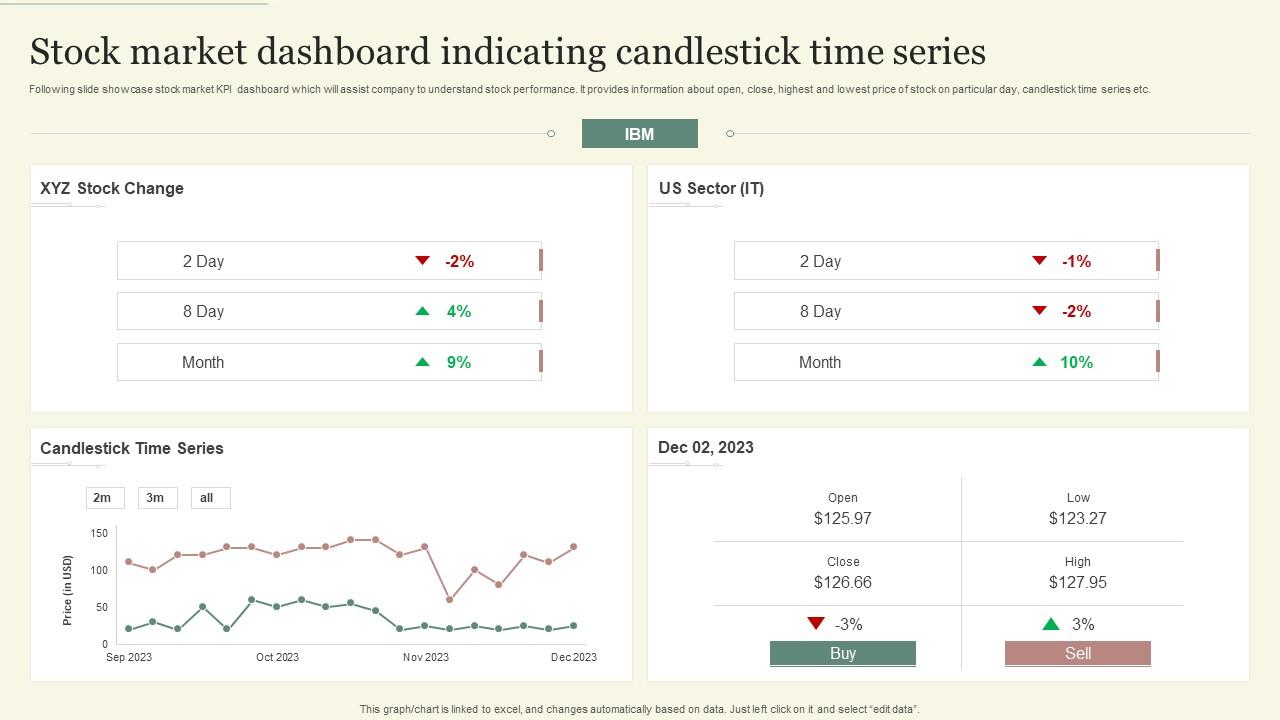
Following slide showcase stock market KPI dashboard which will assist company to understand stock performance. It provides information about open, close, highest and lowest price of stock on particular day, candlestick time series etc.
Following slide showcase stock market KPI dashboard which will assist company to understand stock performance. It provides ..
- Google Slides is a new FREE Presentation software from Google.
- All our content is 100% compatible with Google Slides.
- Just download our designs, and upload them to Google Slides and they will work automatically.
- Amaze your audience with SlideTeam and Google Slides.
-
Want Changes to This PPT Slide? Check out our Presentation Design Services
- WideScreen Aspect ratio is becoming a very popular format. When you download this product, the downloaded ZIP will contain this product in both standard and widescreen format.
-

- Some older products that we have may only be in standard format, but they can easily be converted to widescreen.
- To do this, please open the SlideTeam product in Powerpoint, and go to
- Design ( On the top bar) -> Page Setup -> and select "On-screen Show (16:9)” in the drop down for "Slides Sized for".
- The slide or theme will change to widescreen, and all graphics will adjust automatically. You can similarly convert our content to any other desired screen aspect ratio.
Compatible With Google Slides

Get This In WideScreen
You must be logged in to download this presentation.
PowerPoint presentation slides
Following slide showcase stock market KPI dashboard which will assist company to understand stock performance. It provides information about open, close, highest and lowest price of stock on particular day, candlestick time series etc. Introducing our Stock Market Dashboard Indicating Candlestick Time Series set of slides. The topics discussed in these slides are Candlestick Time Series, IBM. This is an immediately available PowerPoint presentation that can be conveniently customized. Download it and convince your audience.
People who downloaded this PowerPoint presentation also viewed the following :
Stock Market Dashboard Indicating Candlestick Time Series with all 7 slides:
Use our Stock Market Dashboard Indicating Candlestick Time Series to effectively help you save your valuable time. They are readymade to fit into any presentation structure.
-
I never had to worry about creating a business presentation from scratch. SlideTeam offered me professional, ready-made, and editable presentations that would have taken ages to design.
-
Top Quality presentations that are easily editable.


