Stock Performance Graph Intel Company Profile Ppt Themes CP SS
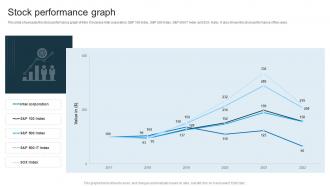
This slide showcases the stock performance graph of Intel. It includes Intel corporation, SandP 100 Index, SandP 500 Index, SandP 500 IT Index and SOX Index. It also shows the stock performance of five years.
This slide showcases the stock performance graph of Intel. It includes Intel corporation, SandP 100 Index, SandP 500 Index,..
- Google Slides is a new FREE Presentation software from Google.
- All our content is 100% compatible with Google Slides.
- Just download our designs, and upload them to Google Slides and they will work automatically.
- Amaze your audience with SlideTeam and Google Slides.
-
Want Changes to This PPT Slide? Check out our Presentation Design Services
- WideScreen Aspect ratio is becoming a very popular format. When you download this product, the downloaded ZIP will contain this product in both standard and widescreen format.
-

- Some older products that we have may only be in standard format, but they can easily be converted to widescreen.
- To do this, please open the SlideTeam product in Powerpoint, and go to
- Design ( On the top bar) -> Page Setup -> and select "On-screen Show (16:9)” in the drop down for "Slides Sized for".
- The slide or theme will change to widescreen, and all graphics will adjust automatically. You can similarly convert our content to any other desired screen aspect ratio.
Compatible With Google Slides

Get This In WideScreen
You must be logged in to download this presentation.
PowerPoint presentation slides
This slide showcases the stock performance graph of Intel. It includes Intel corporation, SandP 100 Index, SandP 500 Index, SandP 500 IT Index and SOX Index. It also shows the stock performance of five years. Present the topic in a bit more detail with this Stock Performance Graph Intel Company Profile Ppt Themes CP SS. Use it as a tool for discussion and navigation on Stock Performance Graph. This template is free to edit as deemed fit for your organization. Therefore download it now.
People who downloaded this PowerPoint presentation also viewed the following :
Stock Performance Graph Intel Company Profile Ppt Themes CP SS with all 11 slides:
Use our Stock Performance Graph Intel Company Profile Ppt Themes CP SS to effectively help you save your valuable time. They are readymade to fit into any presentation structure.
-
The designs by SlideTeam are honestly the best I have seen so far. Will be definitely coming back for more.
-
I was never satisfied with my own presentation design but SlideTeam has solved that problem for me. Thank you SlideTeam!


