Yearly Mobile App Comparison Graph
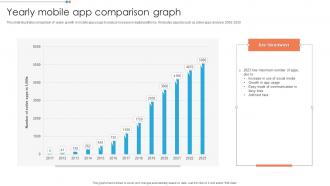
This slide illustrates comparison of yearly growth in mobile app usage to analyze increase in digital platforms. It includes aspects such as active apps and year 2008 to 2020.
You must be logged in to download this presentation.
PowerPoint presentation slides
This slide illustrates comparison of yearly growth in mobile app usage to analyze increase in digital platforms. It includes aspects such as active apps and year 2008 to 2020. Introducing our Yearly Mobile App Comparison Graph set of slides. The topics discussed in these slides are Yearly Mobile, Comparison Graph, Social Media. This is an immediately available PowerPoint presentation that can be conveniently customized. Download it and convince your audience.
People who downloaded this PowerPoint presentation also viewed the following :
Yearly Mobile App Comparison Graph with all 7 slides:
Use our Yearly Mobile App Comparison Graph to effectively help you save your valuable time. They are readymade to fit into any presentation structure.
-
They helped us design the pamphlets for our church’s food drive! The people loved the design, and I’m happy to say it was successful. Thank you, SlideTeam!
-
The content is very helpful from business point of view.


