Have you wondered what are the numbers that signal growth for a business? Is it the same as profit?
Ultimately, all enterprises work to get maximum output from minimum input. This automatically means that the ratio of output to input needs to be as large as possible. Such ratios can be calculated for varied inputs and outputs, giving rise to the domain of ratio analysis.
This type of analysis is vital for financial growth of businesses. It provides valuable insights into an entity's financial health and performance. Ratios help assess the relationships between financial variables, enabling deeper understanding of an organization's strengths, weaknesses, and trends. It aids in identifying areas of improvement, potential risks, and growth opportunities. By analyzing ratios, stakeholders can take big-ticket decisions on investment opportunities, financial planning, and risk management strategies. Ratio analysis enhances transparency, facilitates effective communication, and supports sound financial decision-making.
These templates provide a range of tools and resources to effectively measure and interpret financial ratios, enabling a thorough assessment of liquidity, profitability, efficiency, and solvency. Each template includes appealing graphics, charts, and tables, simplifying complex financial data and making it easier to interpret and communicate to stakeholders.
What’s even better, each of the templates is 100% customizable and editable. The content-ready nature means you get the much-coveted structure to your presentation and a way to start it; the editability means you can tailor this presentation template to the audience profile.
Let's dive in.
Template 1: Financial Statements Ratio Analysis Interpretation PPT Presentation Slides
Explore your business's efficiency, liquidity, and profitability through our comprehensive financial statement ratio analysis. Our team of skilled designers has crafted this PPT Presentation encompassing economic status and historical monetary statements. Using these slides, you can assess your company's ability to settle debts and determine if your earnings can sustain long-term operational success. This theme focuses on how your company manages its assets and liabilities to optimize profits. The ratios you can study on solvency, operating performance, risk analysis, and growth analysis make this template valuable.
Template 2: Financial Ratio Analysis And Interpretation PPT Presentation Slides
This comprehensive financial ratio analysis and interpretation, in the form of PPT Slides, includes ratio analysis presented through dashboards, timelines, graphs, and line charts. Our pre-designed PPT templates focus on investment valuation ratios, financial data comparison, budget analysis, and forecasting. These can also be used for accounting ratios, financial modeling, market value, ratio analysis, balance sheet reports, etc. Accurately identify the existing predicament with a download of this template.
Template 3: Financial Ratio Analysis Powerpoint PPT Template Bundles
Our Financial Ratio Analysis PowerPoint PPT Template Bundles offer comprehensive tools and resources for conducting in-depth financial analysis. These bundles provide a range of PowerPoint Templates tailored explicitly for financial ratio analysis.
Also, showcase your expertise in understanding the types of ratios and the purposes it resolves. For instance, the ratios can depict Growth, Profitability, Activity, Liquidity and Solvency. Use this template to communicate your findings and insights, making it easier for stakeholders to understand your organization's financial health and performance.
Template 4: Financial ratio analysis inventory accounts receivables shareholders equity interest
Financial ratio analysis helps us predict the future in terms of which way the company is going; does it need some insights into reframing a different way of managing its receivables. This PPT Template on inventory turnover ratio computes how efficiently a company manages its inventory, while accounts receivable turnover ratio assesses the effectiveness of its credit and collection policies. The shareholders' equity ratio indicates the company's financial leverage and ability to withstand financial risks. Lastly, the interest coverage ratio determines the company's capacity to meet interest payments on its debt obligations. This one analysis can prevent the eventual disintegration of the company, as the ratio acts as a red flag.
Template 5: Small Business Company Profile Financial Ratio Analysis
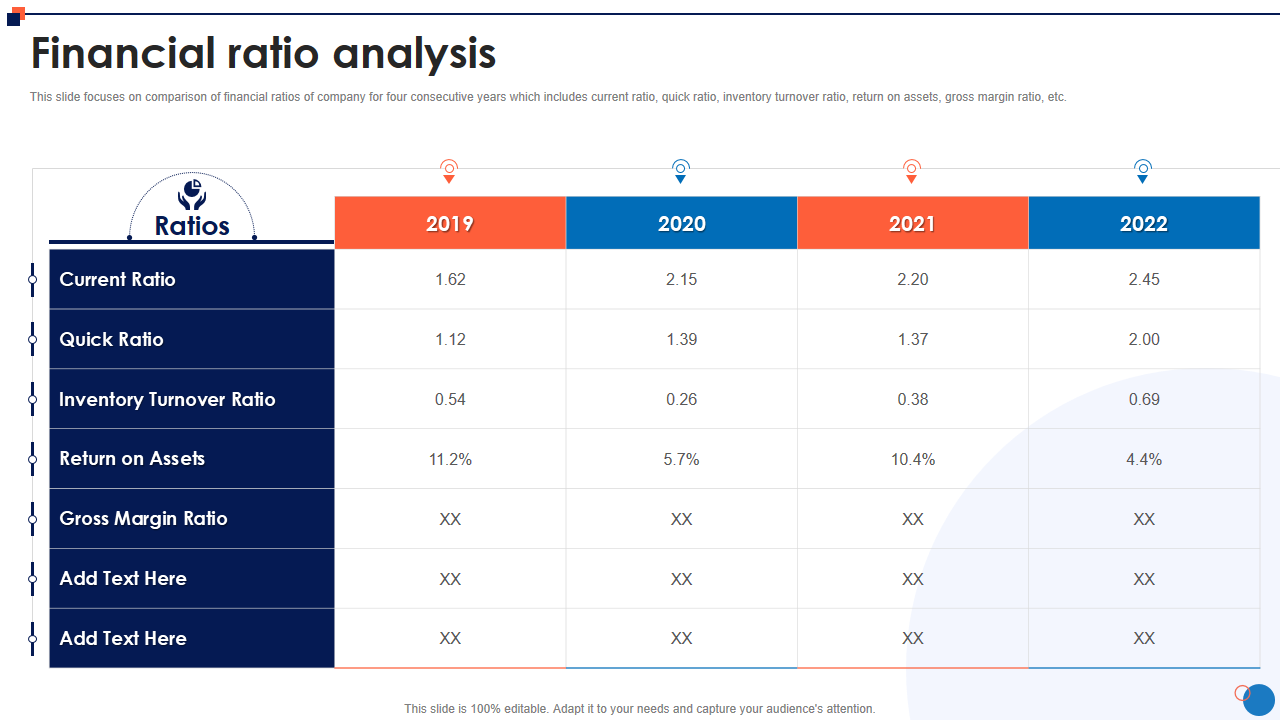
This PPT Template includes key sections to provide a comprehensive company overview, including its background, mission, and values. These ratios help assess the company's financial health, operational efficiency, and ability to meet financial obligations. Compare ratios like current, inventory turnover ratio, return on assets, and gross margin ratios across four years. Each of these ratios has a specific use, and has a meaning that stakeholders take very seriously.
Template 6: IT Company’s Business Introduction Ratio Analysis Of The Company
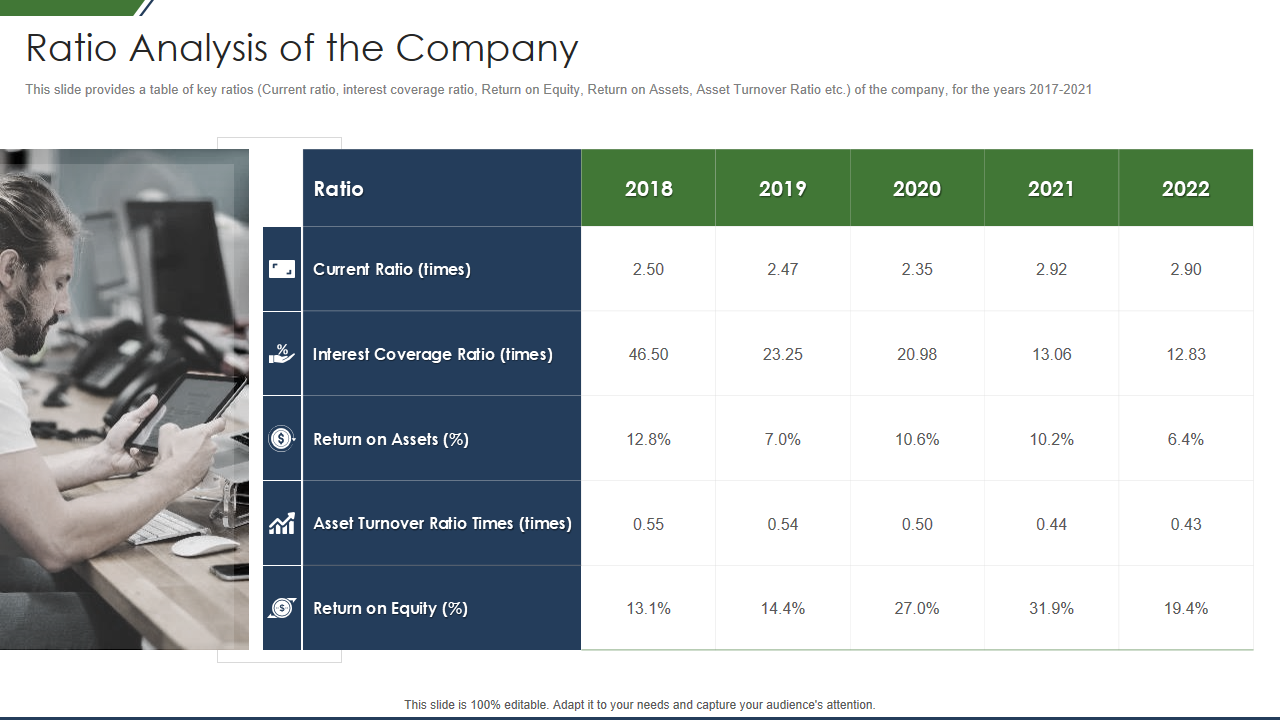
This PPT Template provides a comprehensive overview of an IT company's core business activities, highlighting its expertise and unique value proposition in the industry. Additionally, it offers a detailed ratio analysis section, presenting key financial ratios relevant to the IT sector. These ratios include revenue growth rate, profit margin, return on investment (ROI), and asset turnover. Use this presentation template, an IT company can showcase its strengths, highlight its financial achievements, and position itself as a strong player in the industry, fostering trust and confidence among its audience.
Template 7: Ratio analysis to measure business performance
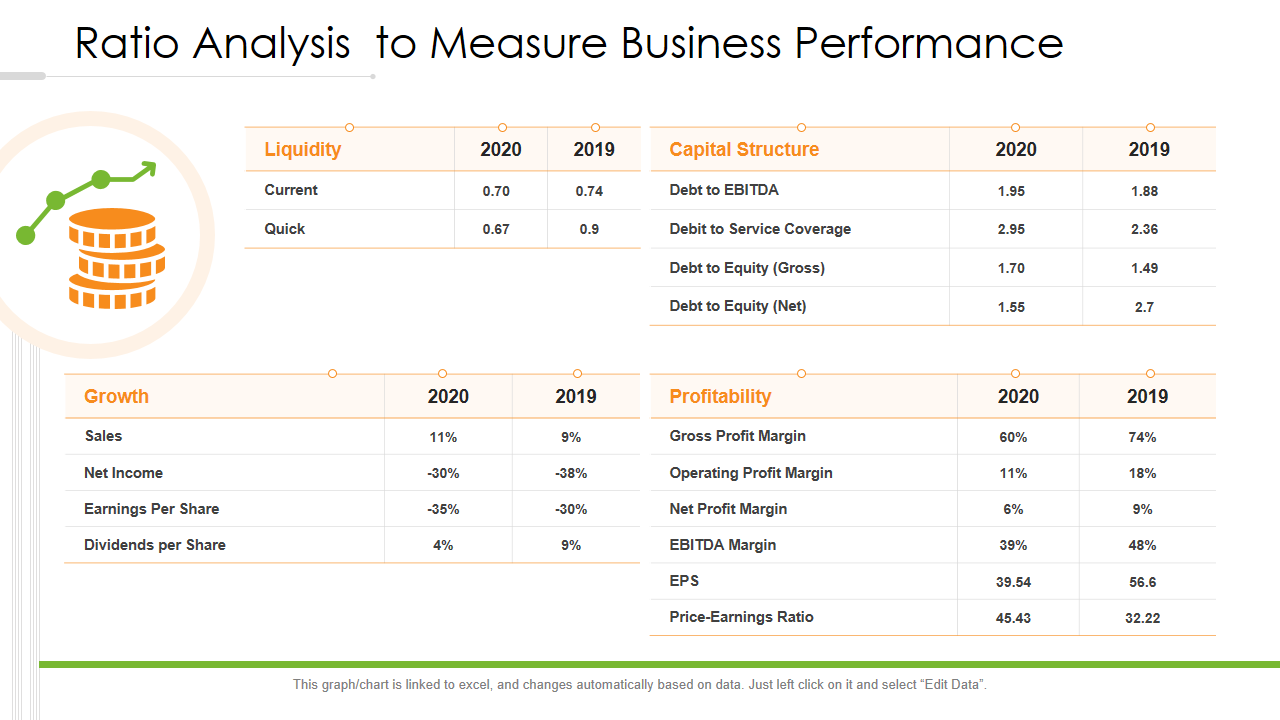
This presentation template is a valuable tool for assessing and presenting the performance of a business through ratio analysis. It enables users to communicate the ratio analysis results effectively to stakeholders, investors, and decision-makers. The template covers efficiency, current, quick, and solvency ratios, allowing for a comprehensive assessment of the business's financial health. Using this PPT Template, businesses can demonstrate their financial strengths, identify areas for improvement, and make knowledgeable decisions based.
Template 8: One-page ratio analysis infographic ppt pdf document
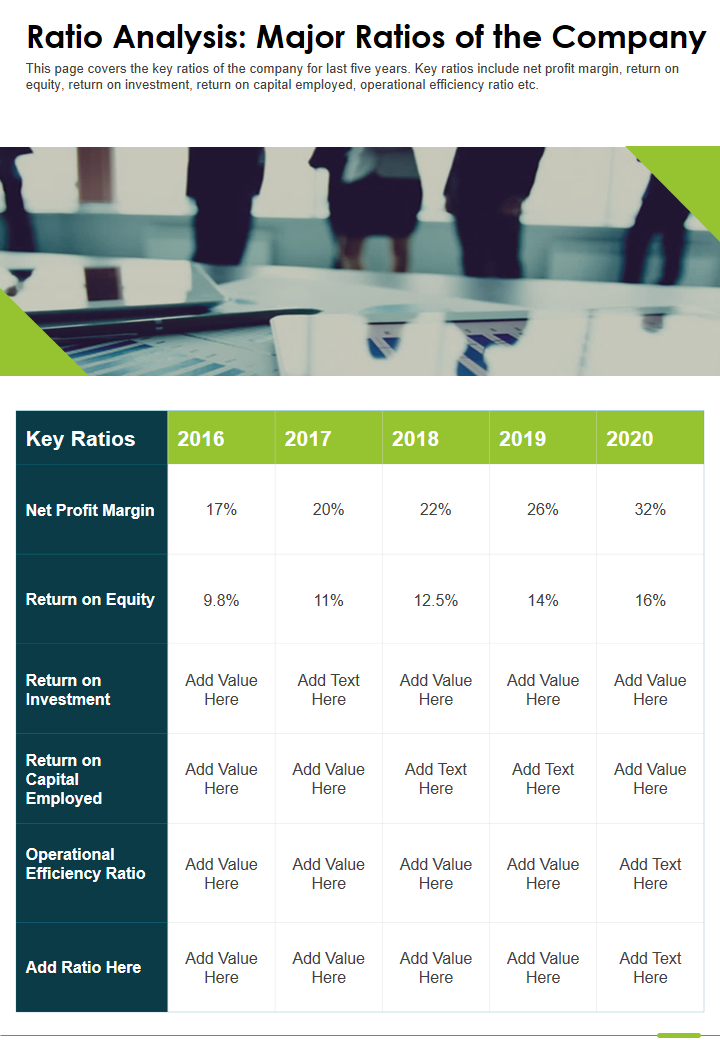
This document condenses the major ratios used in ratio analysis onto a single page, making it easy to comprehend and analyze the company's financial performance. The one-pager document provides a comprehensive overview of essential ratios such as liquidity, cost analysis, and solvency ratios. The design that enables tabular comparison is the USP of the product.
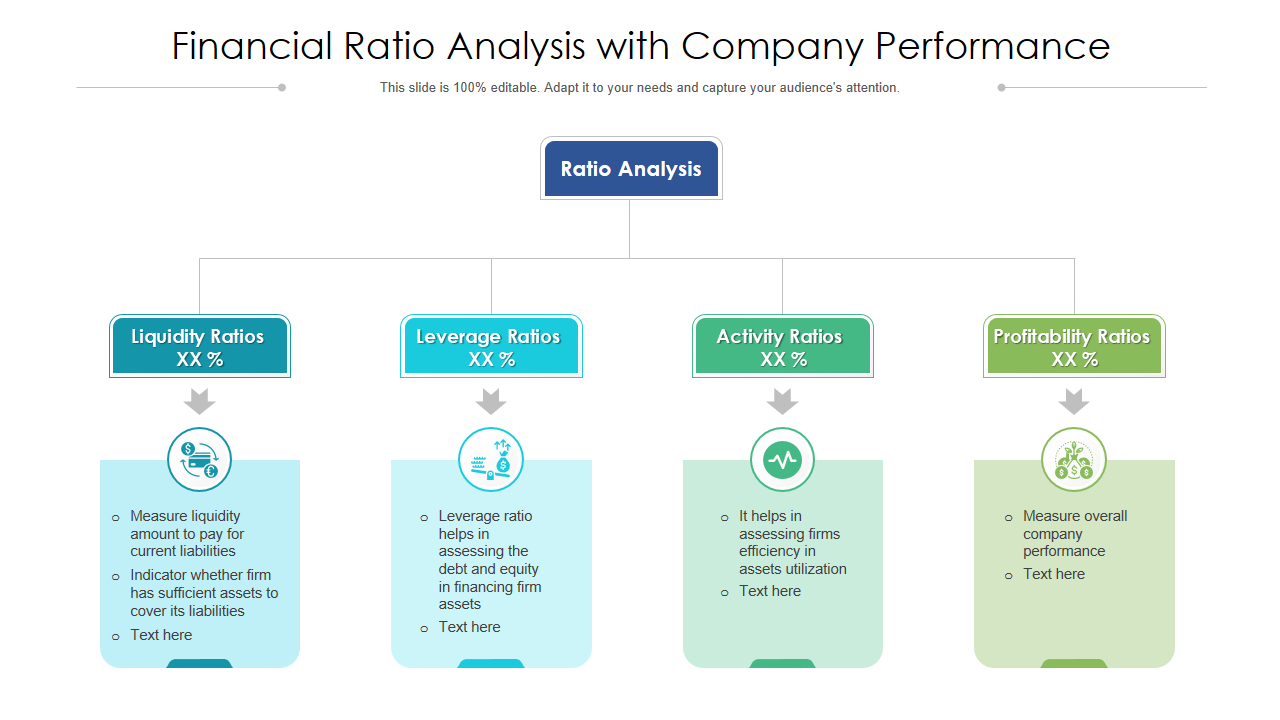
Template 9: Financial ratio analysis with company performance
This template provides a range of professionally-designed slides that effectively showcase the company's financial ratios. The template makes it easier to interpret and analyse data; as the four categories of ratios showcased and highlighted are liquidity ratios; leverage ratios; activity ratios and profitability ratios. You also write a one-word summary of the ratio. For instance, an activity ratio can be defined as ratios (numbers) that help in assessing a firm’s efficiency in using its assets; profitability ratios measure overall company performance. Get this template now!
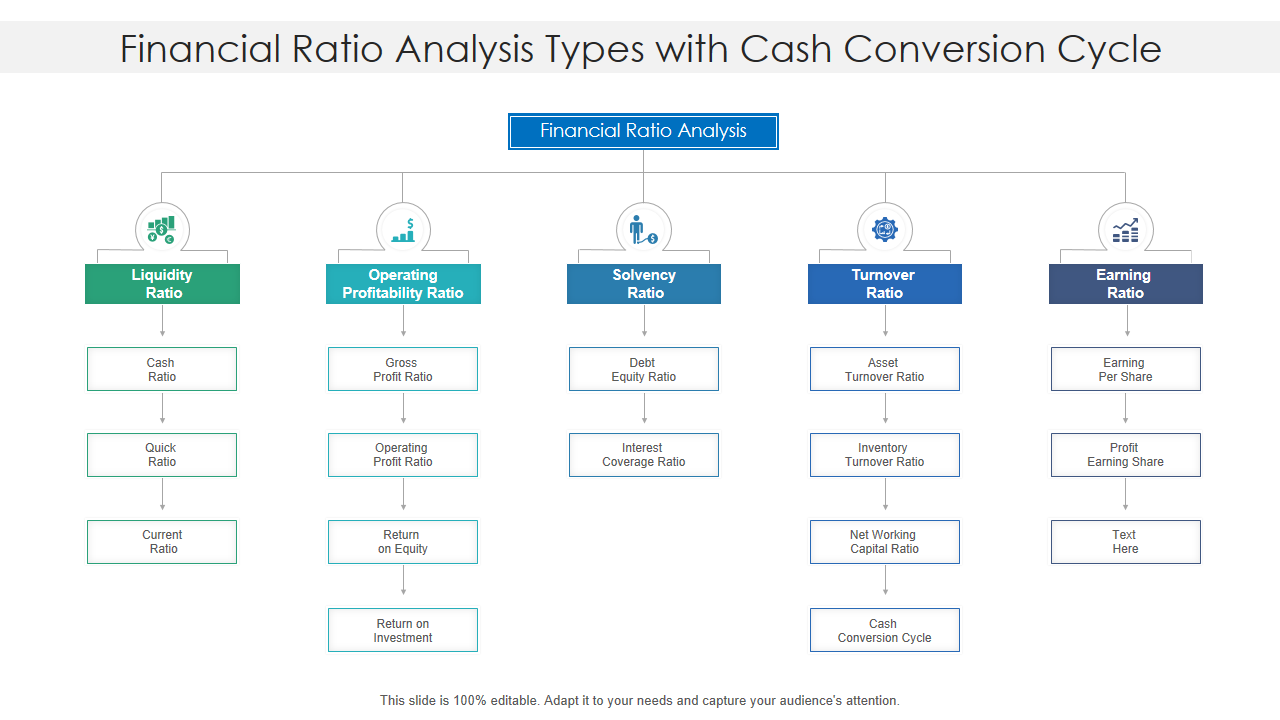
Template 10: Financial ratio analysis types with cash conversion cycle
This PPT Template is a comprehensive resource that enables businesses to analyze and understand their financial performance using financial ratios, with specific focus on the cash conversion cycle. Use this template to highlight the importance of the cash-conversion cycle, which measures the time it takes for a company to convert its inventory and accounts receivable investments into cash flows from sales. The customizable nature of the template allows users to input financial data and compare it against industry benchmarks or historical performance.
GET DEEPER INTO NUMBERS
These bundles of slides, either standalone or in the form of a complete deck, are a powerful toolkit for businesses seeking to evaluate and gauge their financial performance. Whether you're a financial analyst, executive, or investor, these templates provide an invaluable resource for assessing and monitoring financial performance.
FAQs on Ratio Analysis
What is ratio analysis and its formula?
Ratio analysis is a financial technique for evaluating a company's performance, liquidity, profitability, and solvency. It encompasses computation and interpretation of these diverse ratios derived from financial statements. Common ratio formulas comprise:
- Current ratio (current assets divided by current liabilities).
- Equity Returns (net income divided by shareholders' equity).
- Gross profit margin (GPM) (gross profit divided by net sales).
Ratio analysis helps stakeholders gain insights into a company's financial health and make an informed investment.
What are the five ratios in ratio analysis?
These ratios include liquidity ratios, with examples being the current ratio and quick ratio, which measure a company's ability to meet short-term obligations. Profitability ratios like gross profit margin and net profit margin evaluate this aspect. Efficiency ratios such as inventory and accounts receivable turnover assess asset management effectiveness. Lastly, solvency ratios like debt-to-equity and interest coverage ratios analyze a company's ability to meet long-term obligations.
What are the four types of ratio analysis?
Four main types of ratio analysis are used to evaluate a company's financial performance. Liquidity ratios assess a company's ability to meet short-term obligations. Profitability ratios measure the company's ability to generate profits. Efficiency ratios evaluate how effectively a company uses its assets. Lastly, solvency ratios examine the company's ability to meet long-term debt obligations.


![[Updated 2023] Top 10 Ratio Analysis Templates to Gauge Financial Performance](https://www.slideteam.net/wp/wp-content/uploads/2021/05/Top-10-Ratio-Analysis-Templates-to-Gauge-Financial-Performance.png)


 Customer Reviews


