Including data and statistics in your presentations is a great way to bolster your points with ease. Displaying data in your presentations makes it more impactful, but sometimes charts and graphs aren’t the best option available for visualizing relationships between various concepts. If so, perhaps a Venn diagram can be your best friend.
What is a Venn Diagram?
You probably learned first about these diagrams in your primary school math class. Isn’t it? And the fond memories of charting the likes, dislikes and comparing your favorite movie character might have flooded your emotions till now. While you may have thought your Venn diagramming days are long gone, who knew they are a great visualization tool used in the business world too. In fact, professionals use them for problem-solving presentations, representing complex relationships and highlighting the product characteristics that stand out! These are also great for organizing, assessing and interpreting complex relationships visually; an accepted practice worldwide. That is why these are the most preferred universal visualization tools used in business presentations, high-level managerial conferences, technical webinars, meetings, etc.
We have compiled 25 useful Venn diagrams in PowerPoint to help you get started with creating your own data visualization presentations and deliver them confidently to the masses.
Let us begin!
Venn Diagrams to Download and Use
Venn Diagram Template- 1
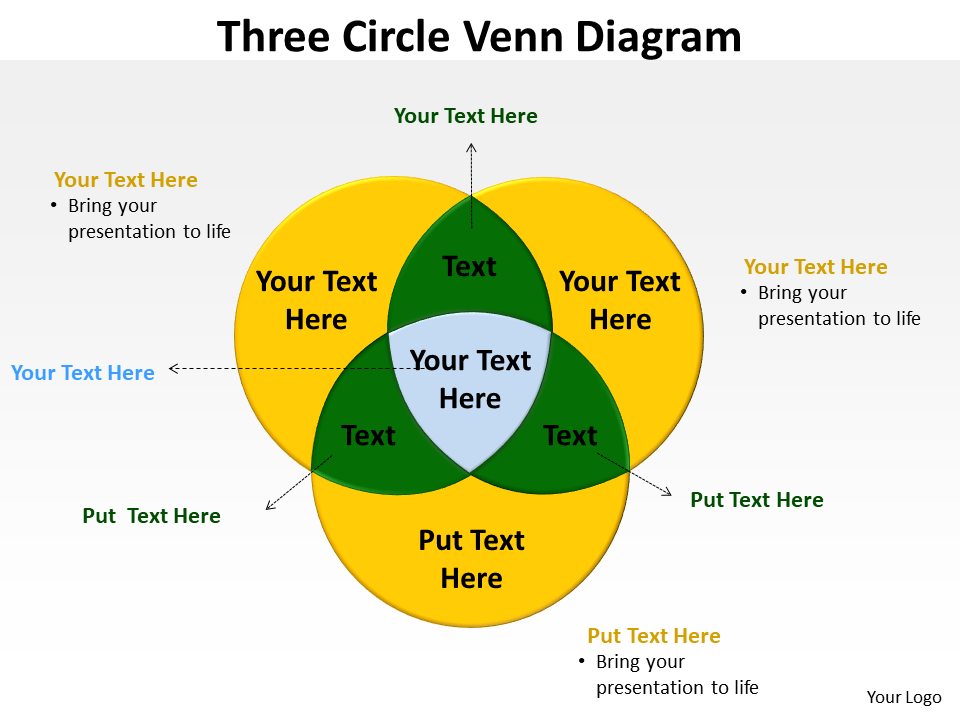
This is a three-circle Venn diagram template designed to examine the relationship between three or more topics simultaneously. It helps the students understand the concepts of sorting information with ease. It also comes in handy when you have to make a comparison and evaluate the relationship between various sets whether they are business oriented or academic. Apart from this, it is flexible enough to make the necessary alterations. For this, simply click on the download button, add your desired factors and compare confidently.
Download Three Circle Venn Diagram
Venn Diagram Template- 2
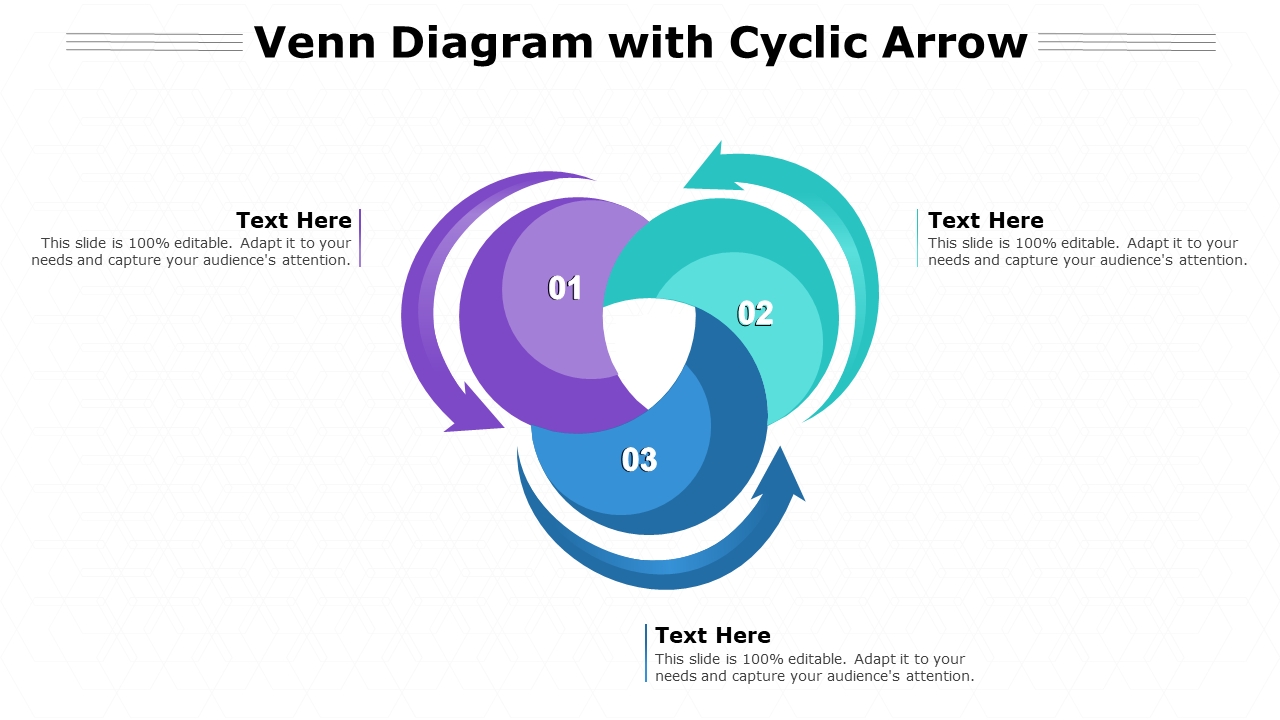
Another variation and a slightly more advanced version of the three-circle Venn diagram is this Venn diagram with cyclic arrow slide. The use of cyclic arrows makes the design more appealing, thus grabbing the immediate attention of the viewer. This Venn diagram is a relatively good example to show the relationship between three sets. It uses overlapping circles with cyclic arrows to remind the users that meaningful work not, only pays well, but also brings out your passion. Since this template is created by our design experts, you will face no difficulty in editing it as per your needs and requirements.
Download Venn Diagram With Cyclic Arrow
Venn Diagram Template- 3
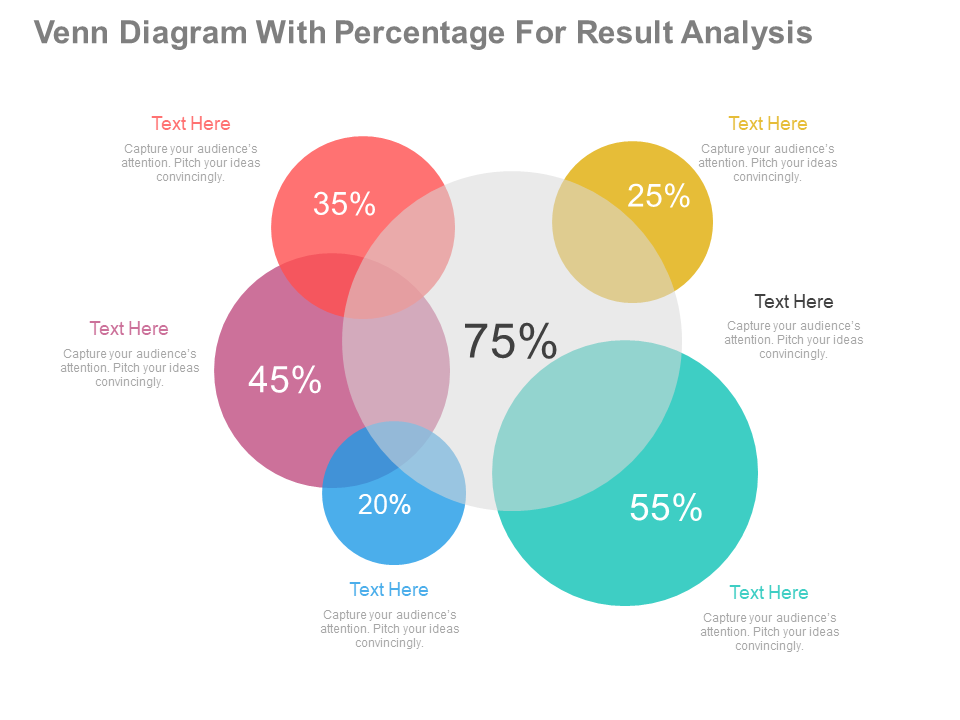
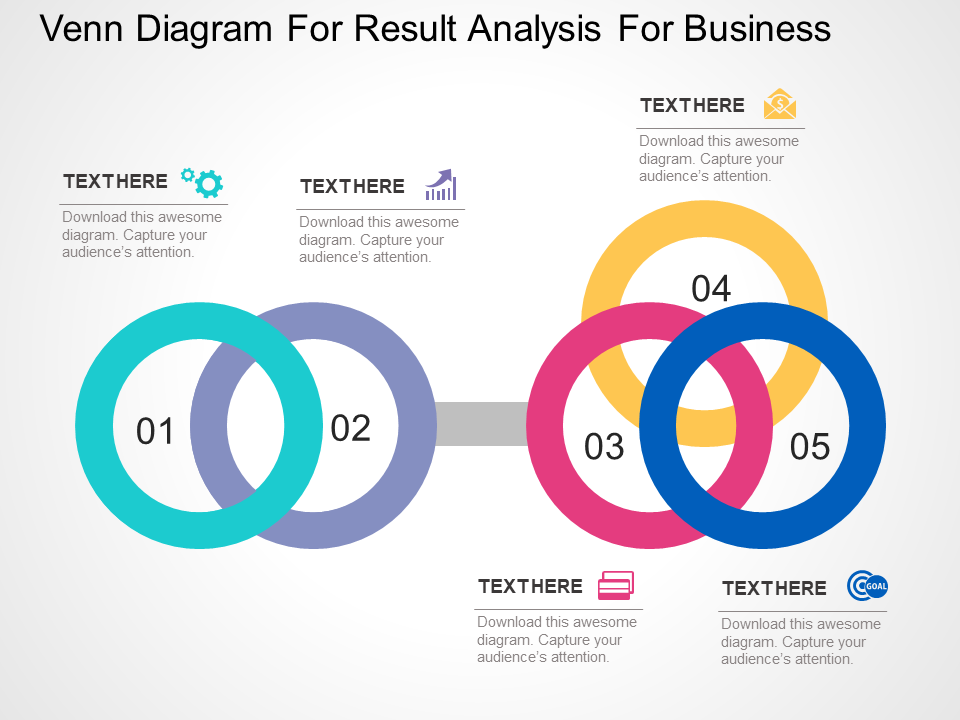
A bit more complex yet very easy to follow is what best describes this Venn diagram for result analysis template. The main interest of this PPT slide is to show how a variety of subjects interact together to bring out the final result, which in this case is several percentages. You can easily use this template to display the work percentage of several departments, thus examining the total work completed. Simultaneously it can be used to examine the profit margin, production process or anything that resonates with your business. Since this template is versatile enough, it can accommodate all your business needs with ease.
Download Venn Diagram For Result Analysis Powerpoint Design
Venn Diagram Template- 4
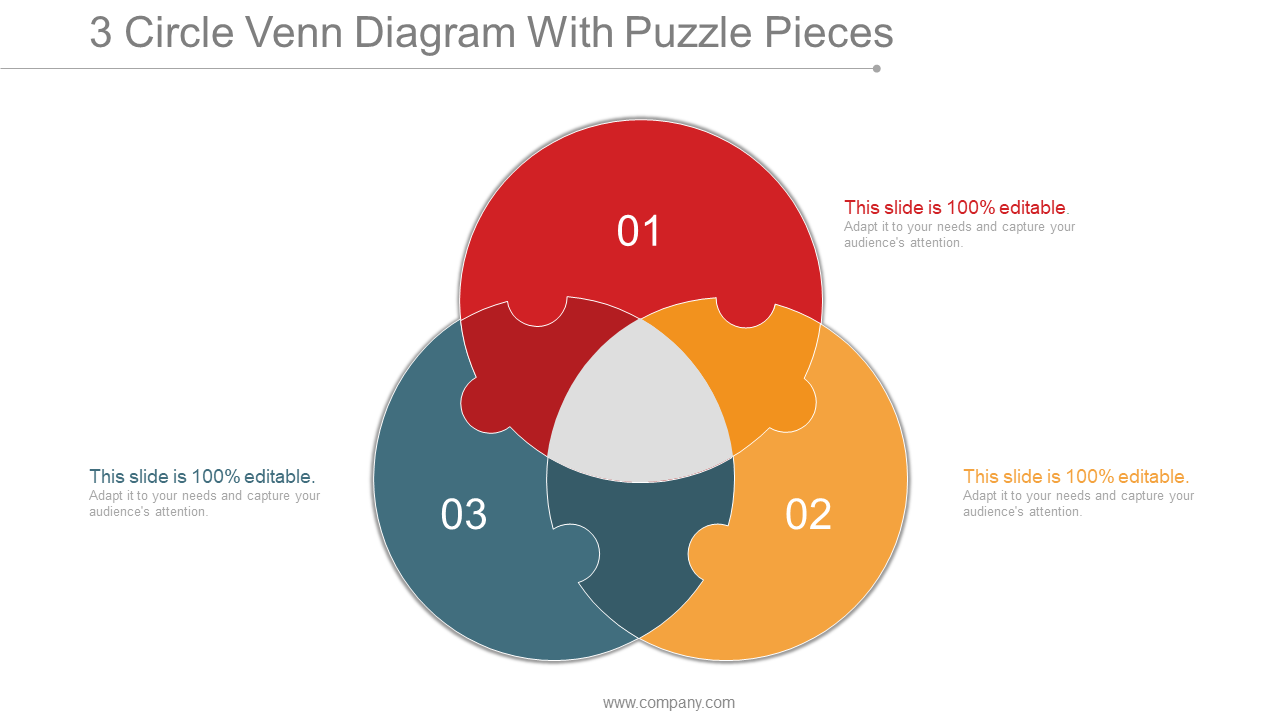
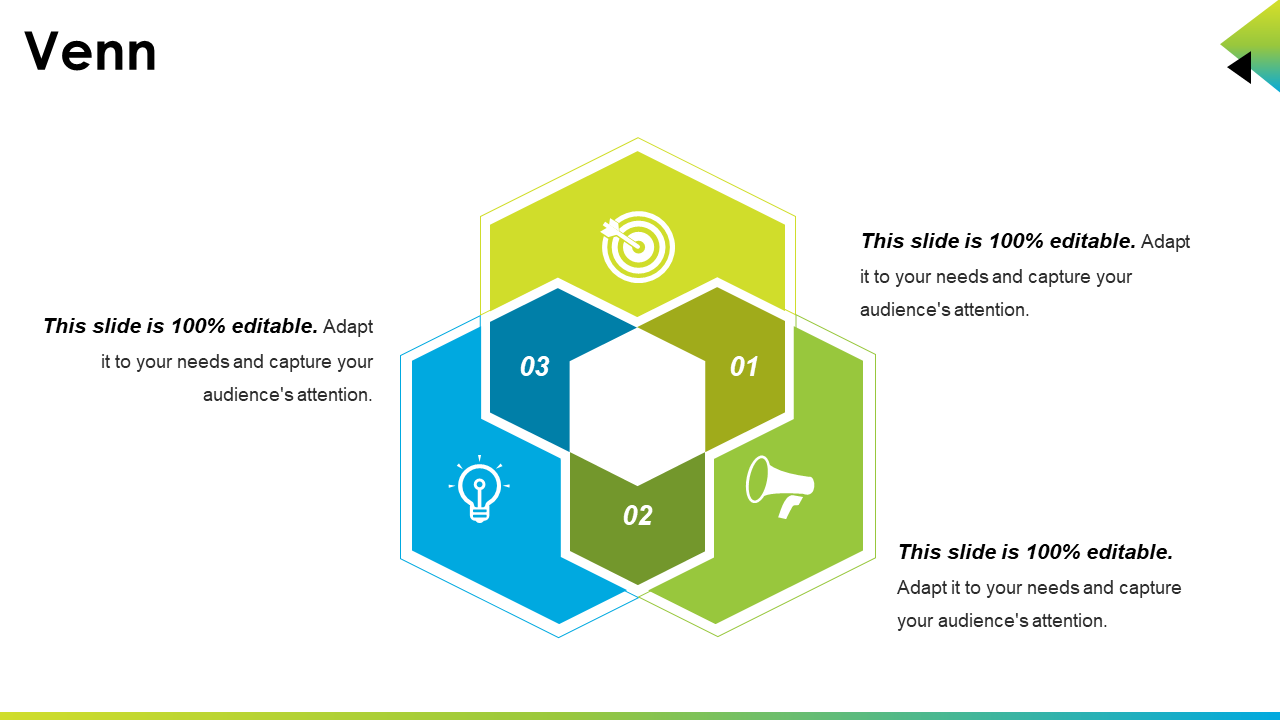
This is a pretty good template in terms of creativity and usability. All you have to do is add the distinctive features you want to evaluate and showcase the correlation between them. It can be a very useful tool to communicate with your audience. When editing this PPT slide, make sure to visualize not only the interaction between components and their counterparts but also how they come together to convey your message across.
Download 3 Circle Venn Diagram PPT Example
Venn Diagram Template- 5
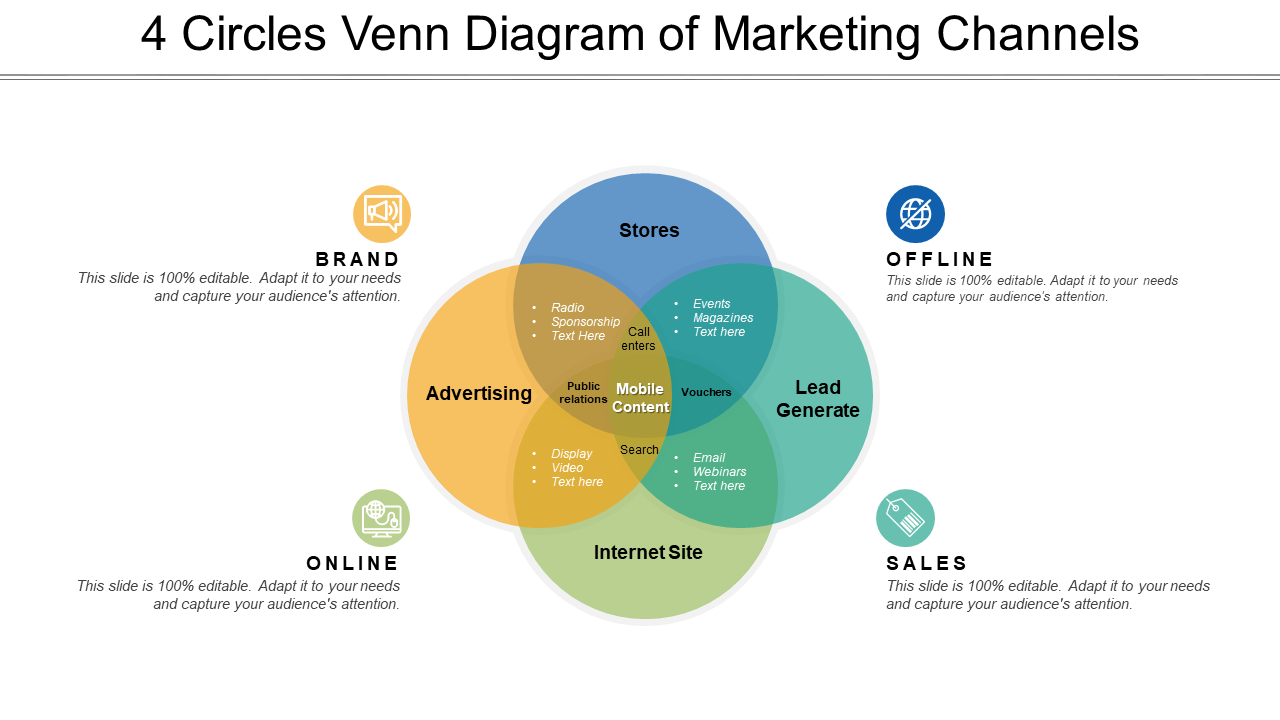
This advanced Venn diagram can be used to compare four different marketing strategies to determine the best one for your business operations. Showcase the entire marketing landscape innovatively using this template. Here each circle represents a different aspect of marketing, with its interconnecting counterparts that show the format of each strategy. The evaluation based on this Venn diagram will help you decide which marketing strategy is the most suitable for your kind of operations. If you are not satisfied with the factors added in this template, you can easily replace them with your own, as this PPT slide is fully editable.
Download 4 Circles Venn Diagram Of Marketing Channels PPT
Venn Diagram Template- 6
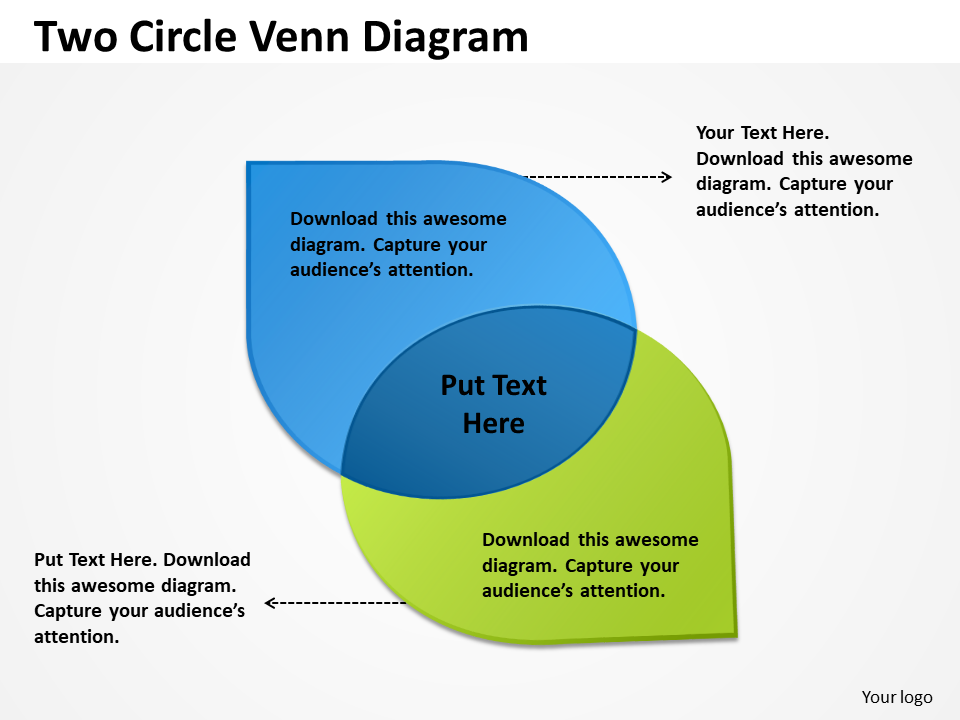
This template is slightly more creative than the usual two circle Venn diagram that we use for our operations. Presented in the form of a “raindrop”, it can be used for finding the correlation between two factors. Since this is a variation of a simple two circle Venn diagram, you can add any information of your choice in it. However, as it has an environmental feel, it is best suitable for topics related to sustainability, energy consumption, environmental issues, and similar other topics. Experiment with various shapes that relate to your subject and see which one works the best for you.
Download Two Circle Venn Diagram PowerPoint Template
Venn Diagram Template- 7
Showcase interconnected ideas and concepts with this fully editable layout. This is a perfect layout to illustrate inter-dependent processes and their contributing factors for statistical analysis. It will further assist presenters to explain complex issues in a visually attractive way as infographics are nothing but metaphors that take your presentation to the next level. Apart from this, it is a very handy tool in demonstrating technology, logical reasoning, social trends, culture and many more depending upon your requirement.
Venn Diagram Template- 8
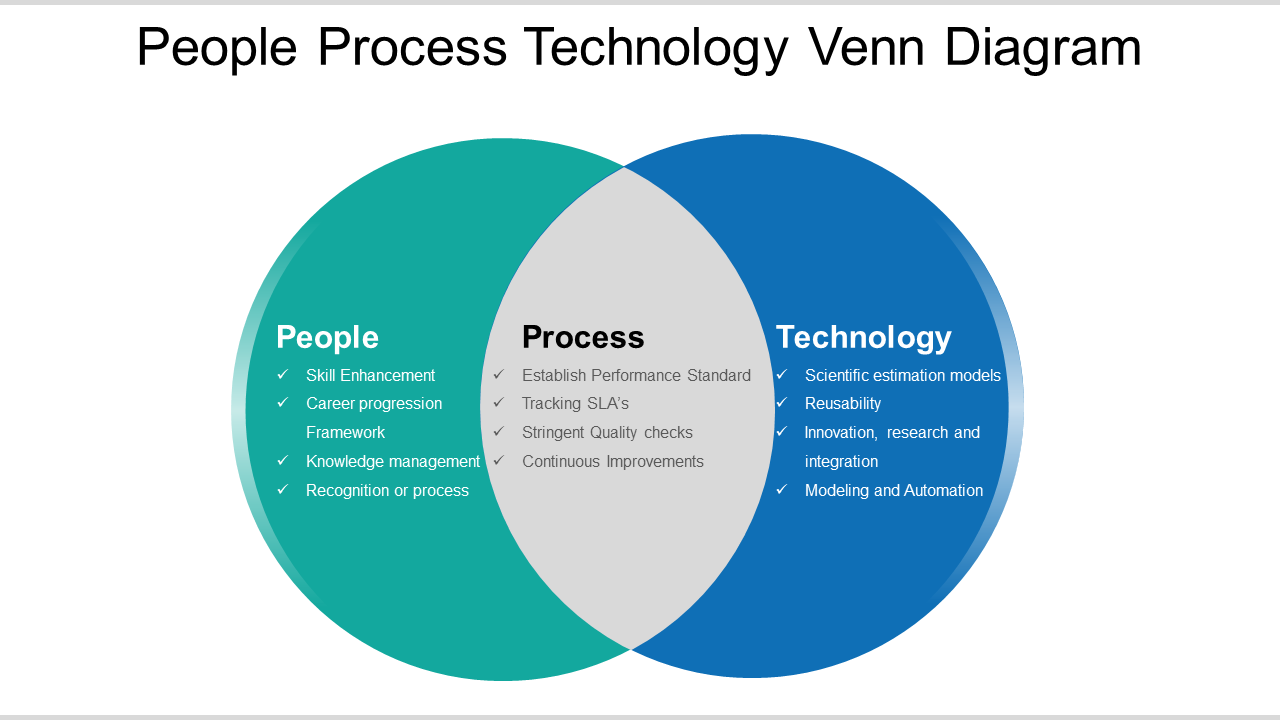
Probably the most widely used type of Venn diagram, as well as the simplest one as it is used to compare only two subjects. This is the most common Venn diagram used in countless business presentations and classroom learning courses because of how easily it can be put together. Choose the two subjects you want to compare and put them along with a common trait at the center so that the relationship can be evaluated. Furthermore, you can make use of this PPT slide as you please, as it is customizable.
Download People Process Technology Venn Diagram PPT Slide Show
Venn Diagram Template- 9
This is a variation of the four circle Venn diagram that can be used to add some flair to boring visuals and graphics. These designs can be a little more complex than the usual but are great to showcase your creativity. You can compare various social and technical aspects using this sample layout which can be edited as per your requirement. Not only that, it can also be used to show a variety of aspects with multiple connections and the colors can be blended together to give a different effect.
Download Four Staged Venn Diagram PowerPoint Design
Venn Diagram Template- 10
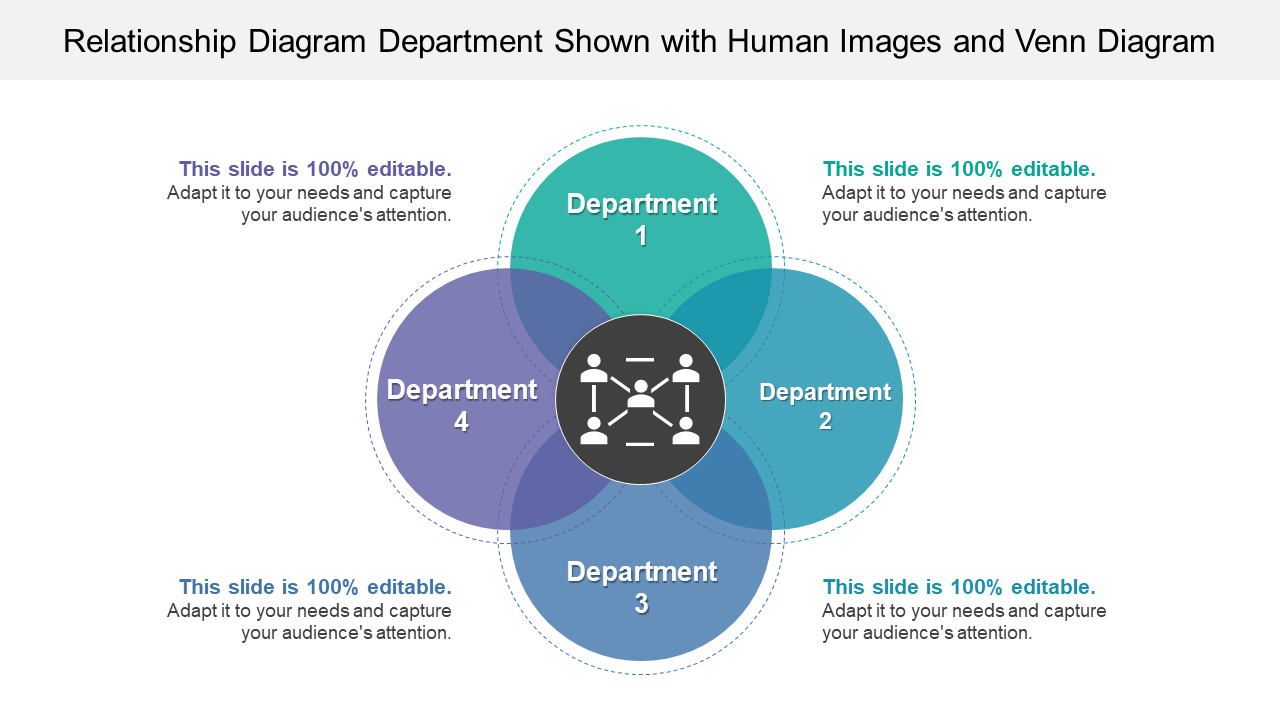
This is a versatile resource for students, teachers and companies alike to make comparisons. Compare anything whether they are numbers, factors, events, places, people, etc using this template. Being a highly useful tool you can edit all its elements as and when necessary. You can also use this slide for comparing various departments and their efficiency in meeting the end goals.
Download Relationship Venn Diagram PPT
Venn Diagram Template- 11
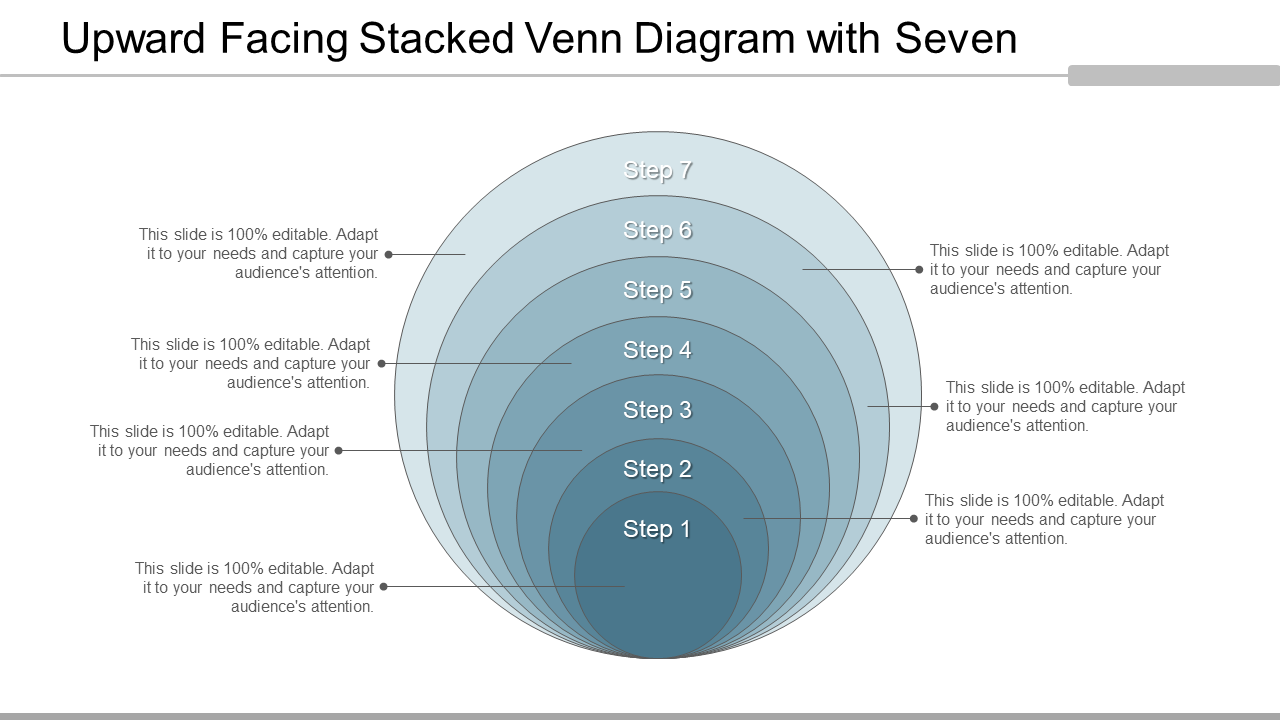
This is an onion-shaped design used to highlight dependencies among parts or entities. This diagram is both meaningful and technical and can help in capturing your novel ideas and present them creatively. The user can identify various steps, tasks, brief team members and study numerous topics with this PPT slide. Furthermore, this is a very unique design so it will immediately catch the audience’s eye.
Download Stacked Venn Diagram PPT Slide
Venn Diagram Template- 12
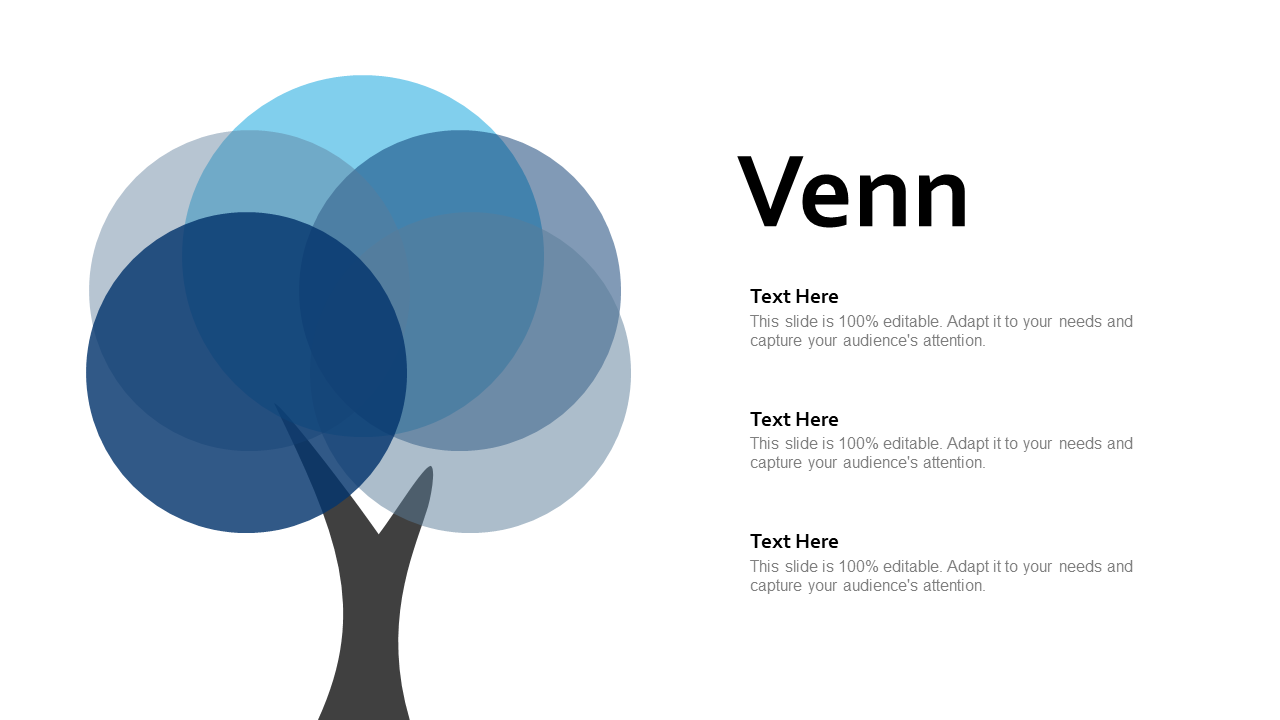
This is a very creative Venn diagram presented in the form of a tree that is a metaphor for growth. Showcase various growth concepts and determine the relationship between them using this PPT slide. This is an outstanding Venn diagram design to compare various modeling structures and skill development aspects. This is why it is an apt design to be used for academic presentations, seminars, and others.
Download Venn PPT Portfolio Structure
Venn Diagram Template- 13
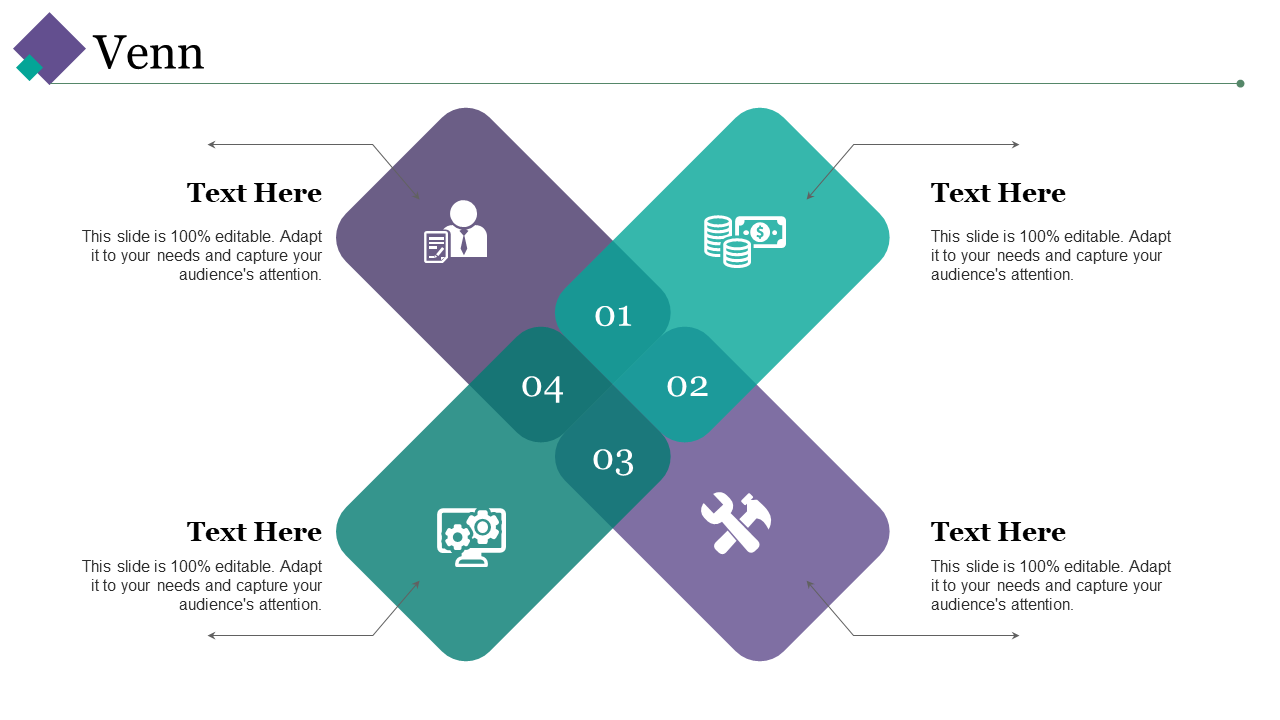
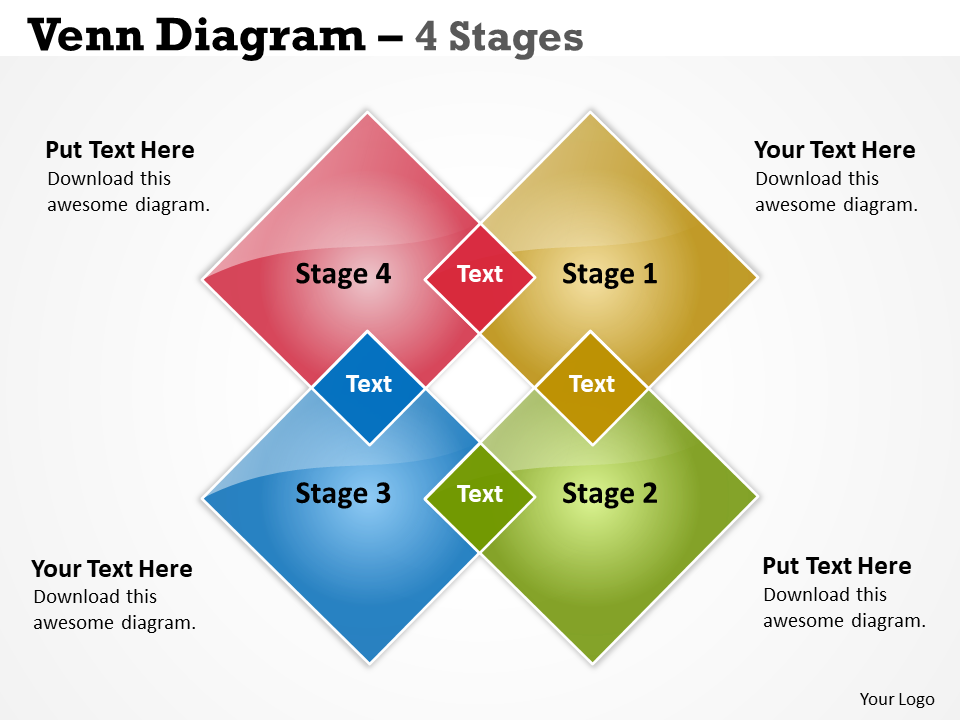
The overlapping diamond shapes increase the aesthetic appeal of this template so it can be used to showcase any aspect creatively. However, this design is relatively more complex. You can discuss various traits, characteristics, etc, using this PPT slide. For eg, you can list various types of employees and their traits, to make a suitable comparison. The multiple connections established by these diamond shapes can be used to show a variety of examples with ease. Therefore, download and use this template to stand out from the rest!
Download Venn Diagram 4 Stages PPT Layout
Venn Diagram Template- 14
Want something really complex looking, yet pleasing to the eye? Try using this creative Venn Diagram template. Created using various interconnected circles, this PPT layout will help you present your data innovatively. This allows you to evaluate the connection between various variables and still maintain the creative aspect of your presentation. You can label this template and make it color-coded to make the interpretation easier to follow. Also creating labels for every circle will help keep a track of the interactions efficiently.
Download Venn Diagram For Result Analysis PowerPoint Design
Venn Diagram Template- 15
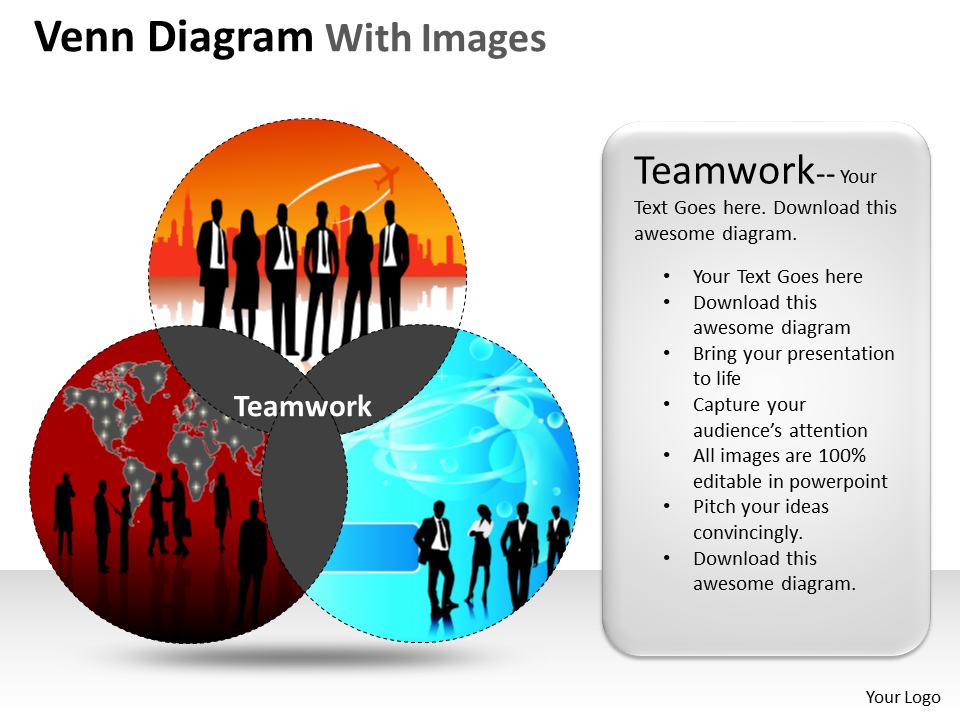
A picture can speak a thousand words. That is why we have designed this template wherein you can show multiple images and their relationship. You can include creative images and explain the common connection between them with this layout. Furthermore, after downloading, you can alter all the elements of this template as per your convenience as it comes in an editable format. So, represent various combinations of factors creatively by including this slide.
Download Venn Diagram With Images PPT Template
Venn Diagram Template- 16
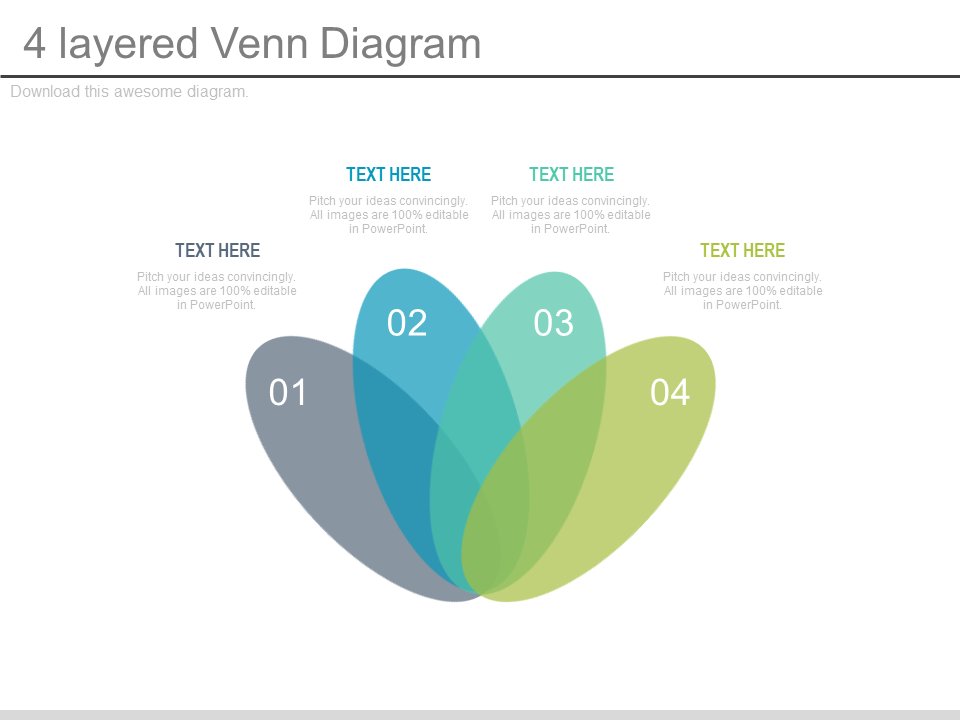
This the most inclusive Venn diagram that we have created for people that have an eye for design and layout. This is a layered model that can help you present a visualization of four data sets with no restrictions. These data sets can be related to any field, whether it is business, academic, artistic or any other. All you have to do is download the design, tweak its content, add your preferred information and present it confidently.
Download Four Layered Venn Diagram For Business PowerPoint Slides
Venn Diagram Template- 17
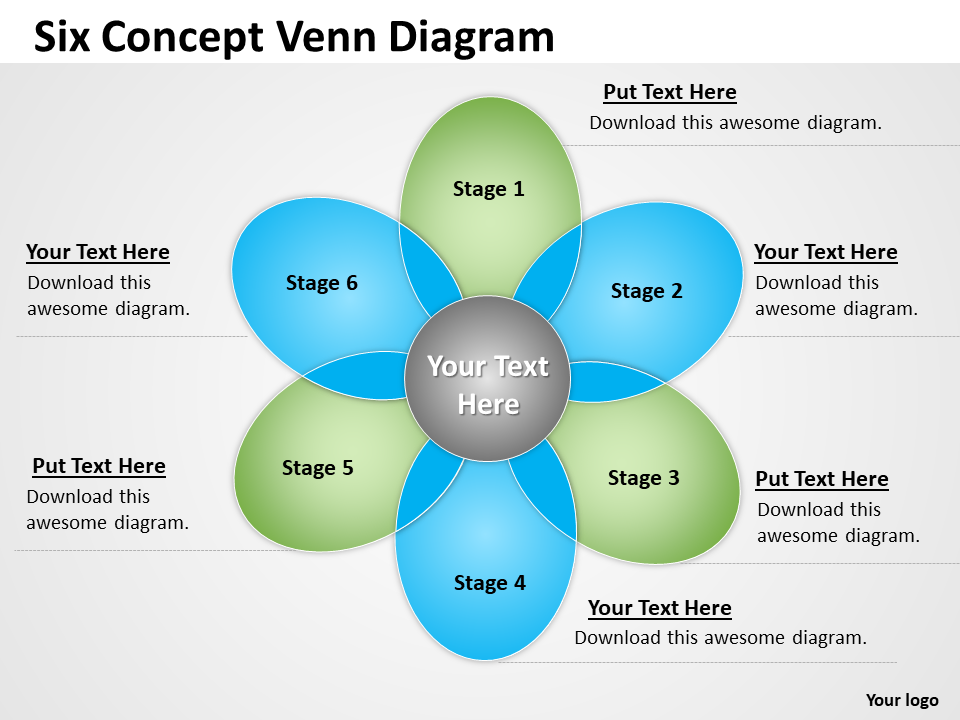
This Venn diagram visualizes all possible logical reasons between various sets presented in the form of a flower. The sets are presented in oval shapes which can be widely used for topics related to mathematics, statistics, logical reasoning, technology, and others. It is not only an ideal fit for teachers and mathematicians but also presenters looking to showcase the correlation between various business aspects.
Download Six Concept Venn Diagram PPT Slide
Venn Diagram Template- 18
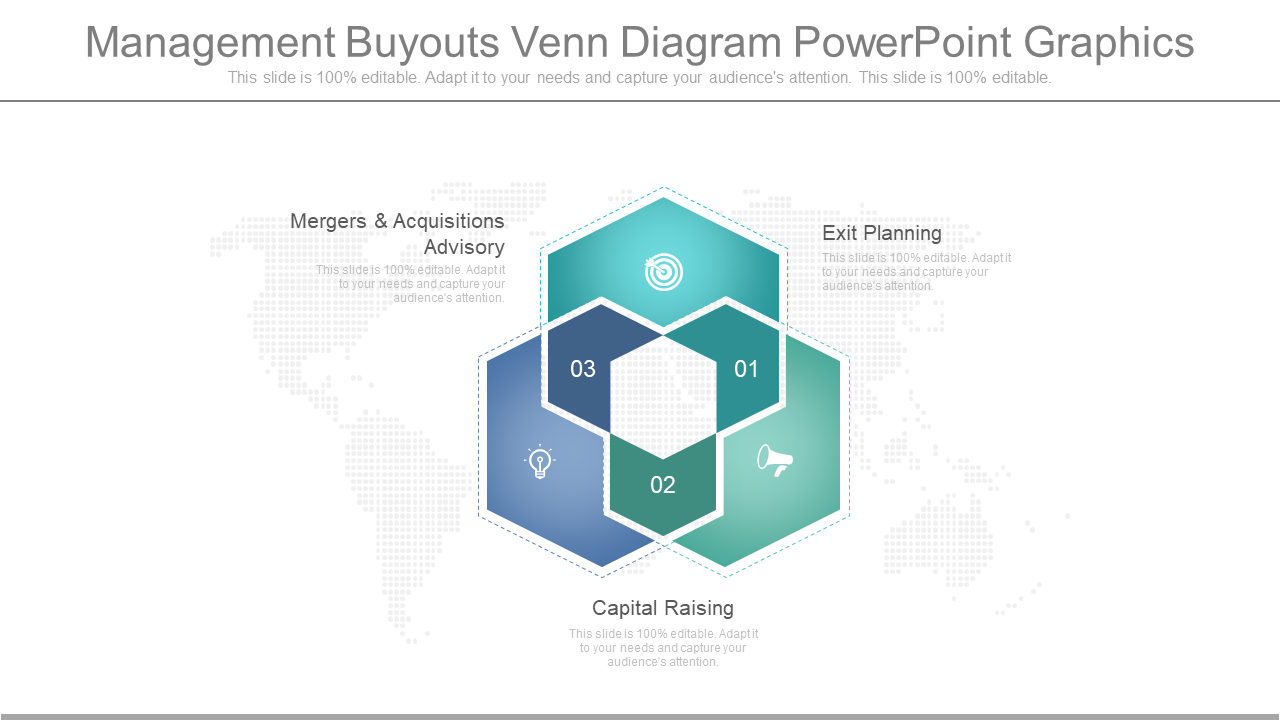
These color-coded overlapping shapes are the perfect base for your business presentations. Showcase various management buyouts using this template such as capital raising, merger and acquisition advisory and the like. Since these shapes have room to add text, you can present your data sets visually whether they are operational, informational or any other. This template makes it easy to reach your target audience, all thanks to its easy to follow format.
Download PPT Management Venn Diagram
Venn Diagram Template- 19
This is a very versatile and creative Venn diagram set with relevant icon imagery. Use it to compare five data sets with ease. Using this data set will help you sort out important information and thereby explaining its efficiency. It is also a very handy tool for academic learning which is why it is highly recommended for teachers and educators.
Download 5 Circle Venn Diagram PPT Layout
Venn Diagram Template- 20
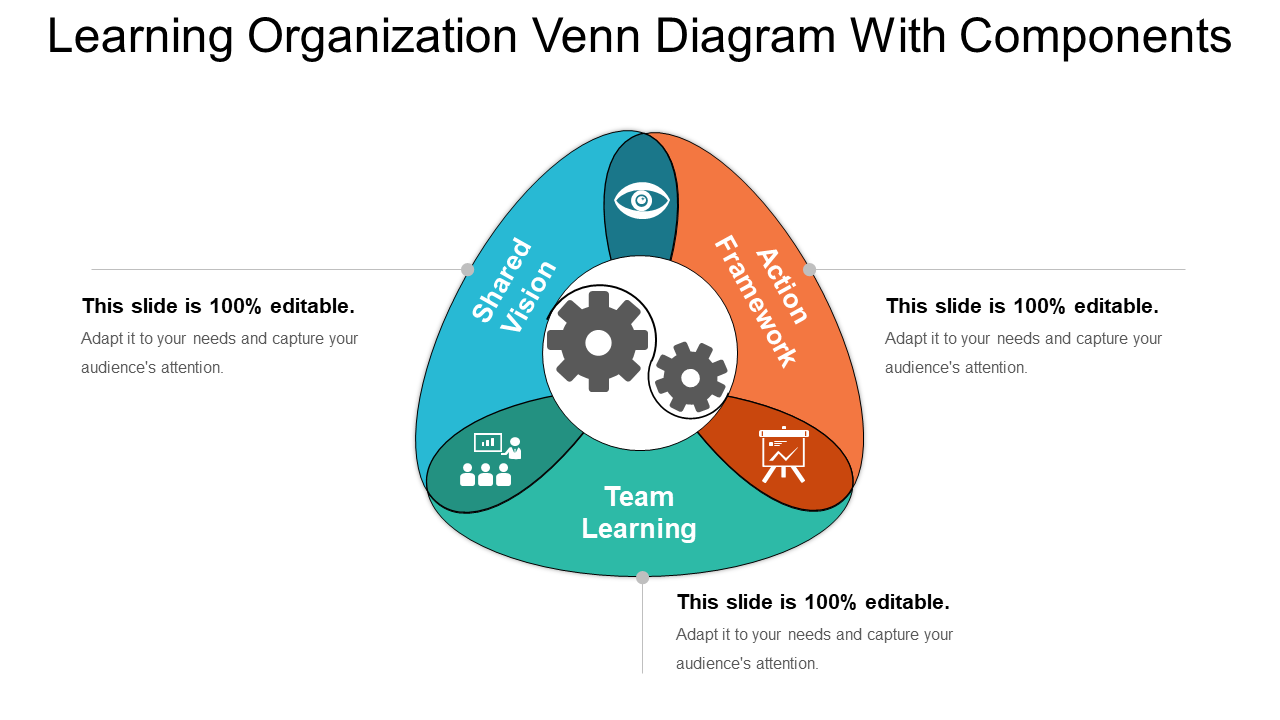
If you want a creative take on a three-subject Venn diagram, then this template is the right fit for you. Presented in the form of a triangle, this is a great example to use for interacting with your target audience. Much like the three- circle Venn diagram, this template includes three triangles interlocked together. So, it will be able to showcase three data sets with ease. You can also change the shapes as per your preference and instead of a triangle, you can use an oval, circle or any other option you prefer.
Download Learning Organization Venn Diagram With Components PPT Model
Venn Diagram Template- 21
This is an ideal set for marketers as it will help you in conducting a successful market analysis for your company. Analyze various market segments, target customers and other marketing aspects by downloading this template. Moreover, it is a very versatile template so you can make as many amendments as you like in it so that it adheres to your company’s policies.
Download Venn PPT Professional Designs Download
Venn Diagram Template- 22
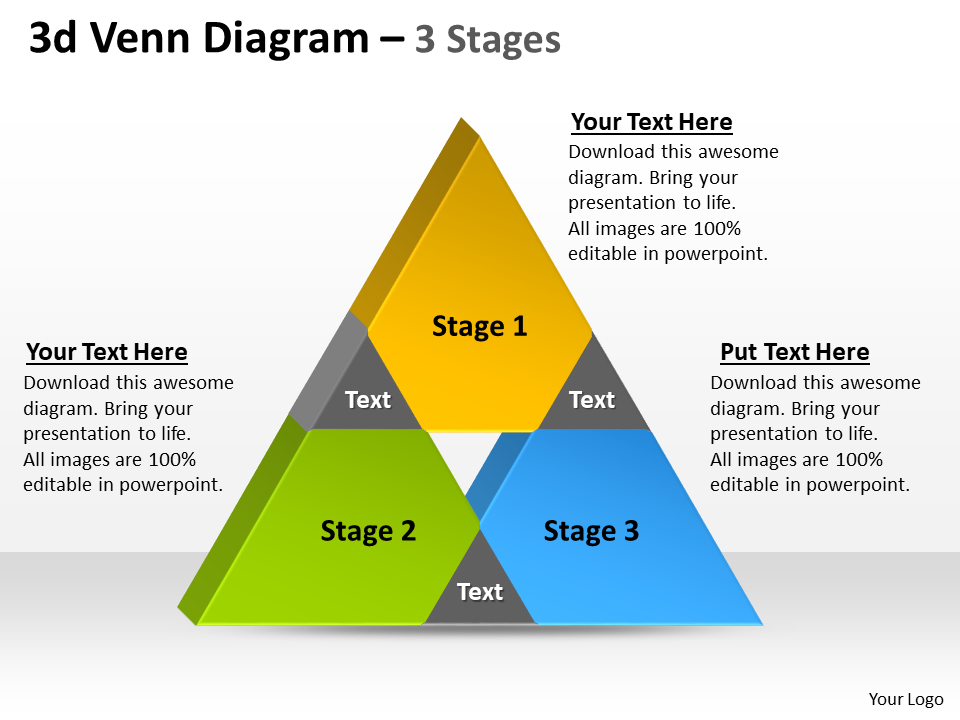
This is a very creative Venn diagram layout that can be used for classroom learning courses. However, it is not only limited to academic presentations but also business presentations. It all depends on the choice and preference of the user, as this template can be applied in various fields.
Download 3D Venn Diagram PPT Design
Venn Diagram Template- 23
Use this diagram to show overlapping or interconnected ideas whether they are academic, business, informational or any other. You can also use this template to show the continuing stages of various tasks in a creative format that is fully editable and customizable.
Download Venn PPT Background Template
Venn Diagram Template- 24
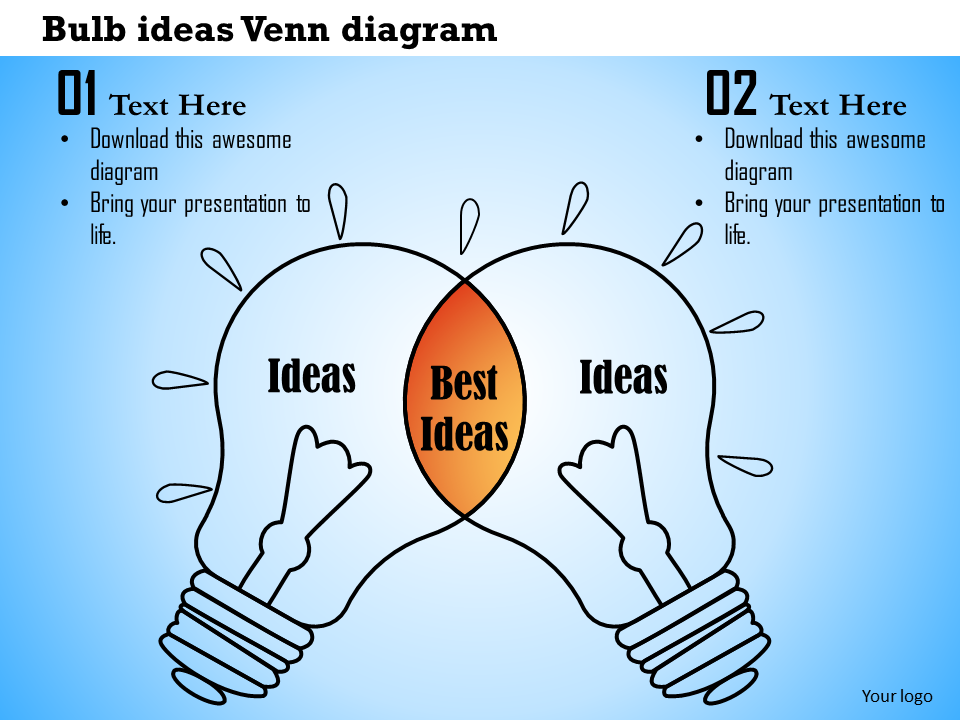
Showcase interconnected ideas with ease by employing this creative bulb Venn diagram. This is a variation of the basic two-segment Venn diagram which is fully responsive to your needs and requirements. So you can edit the layout any which way.
Download Bulb Ideas Venn Diagram PowerPoint Presentation
Venn Diagram Template- 25
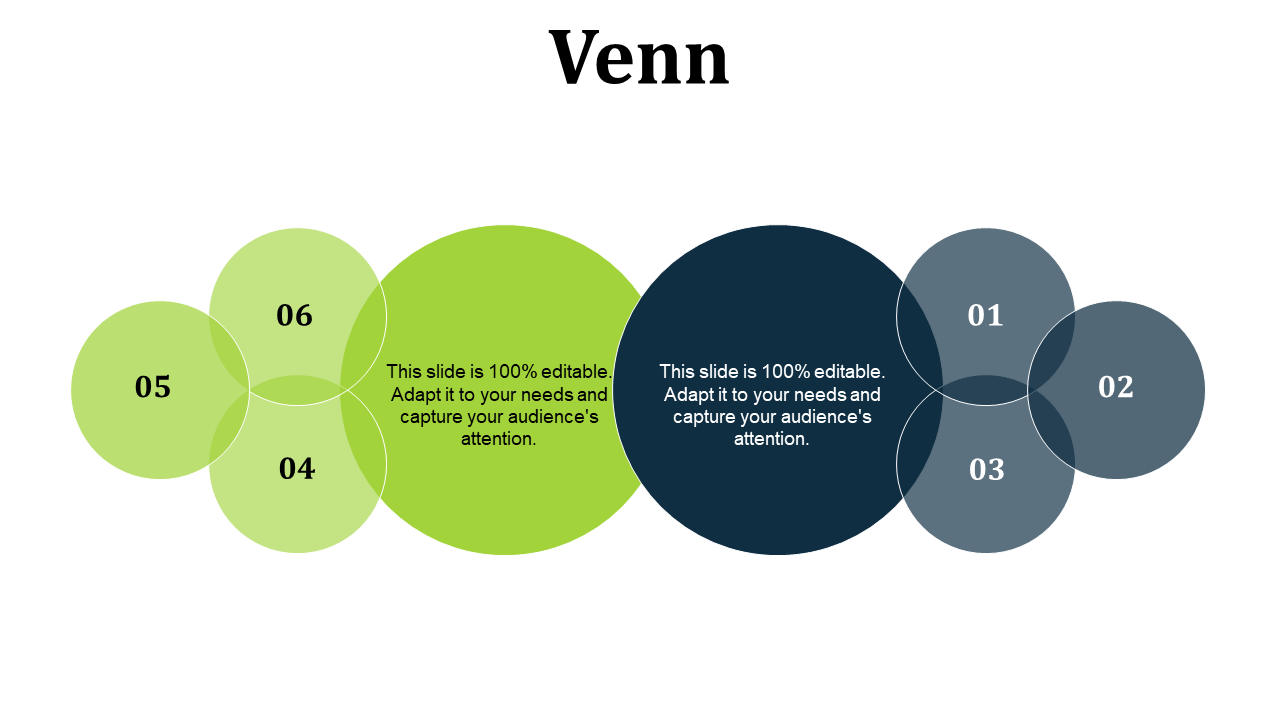
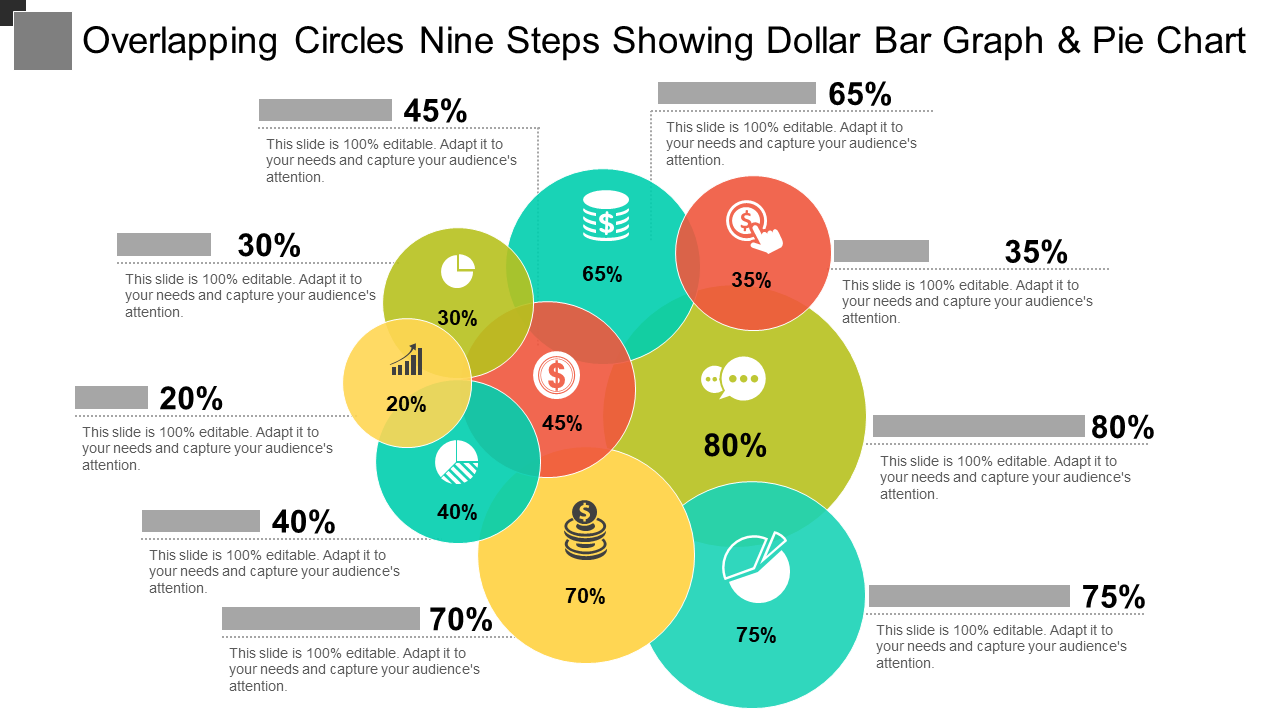
This template is somewhat similar to the multi-layered template, the only difference is that it uses different sizes of circles, thus helping you show various aspects, their weightage and how they interact with each other. Show the relative sizes of different objects using this design and feel free to change its elements as you like. Also, this template works best where multiple combinations have to be shown.
Download Overlapping Circles Nine Steps Venn Diagram PPT
These are a few Venn diagrams to display various relationships.
Which one is your favorite from the lot? Share with us in the comment section below!




 Customer Reviews

